Dinapoli Package MT5
- Indicadores
- Versión: 1.1
- Actualizado: 13 mayo 2023
- Activaciones: 15

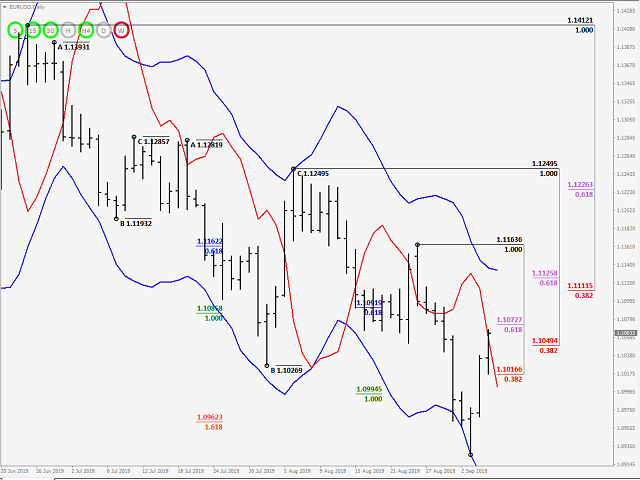
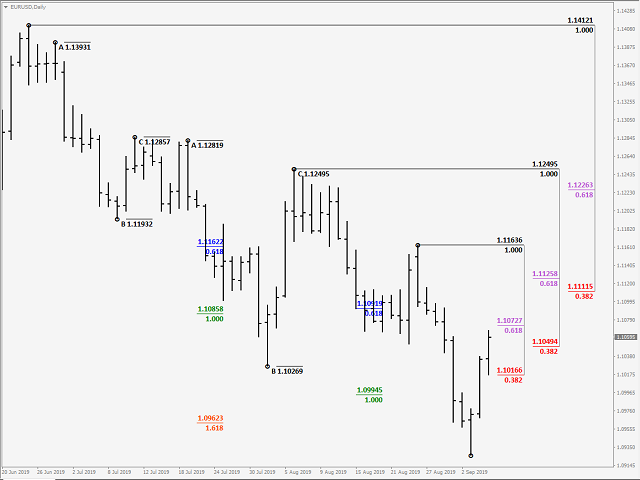
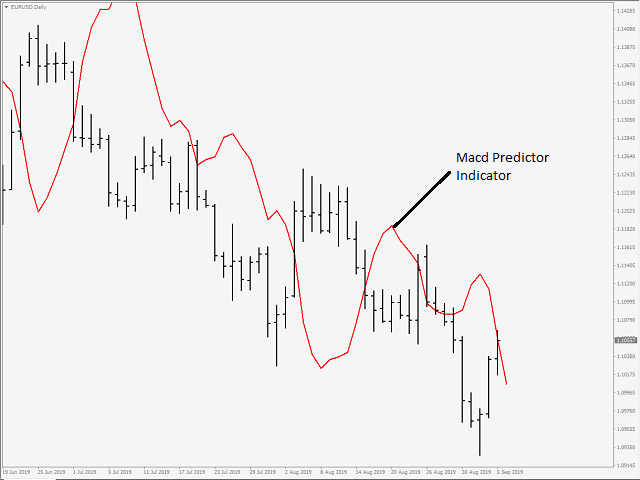
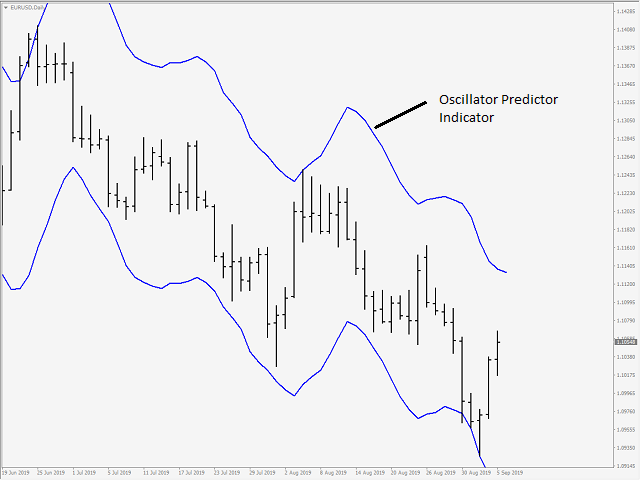
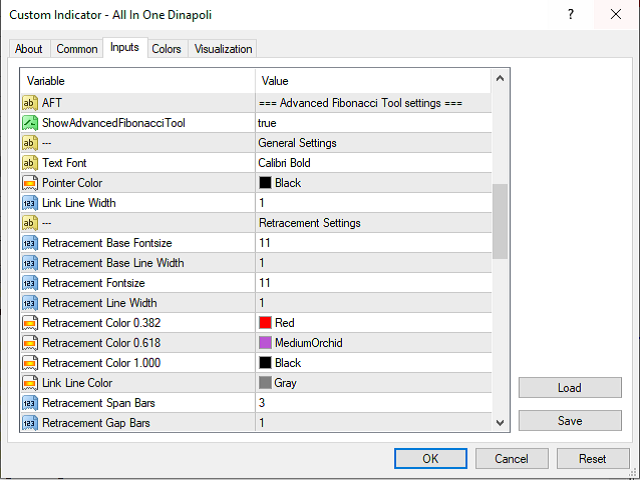
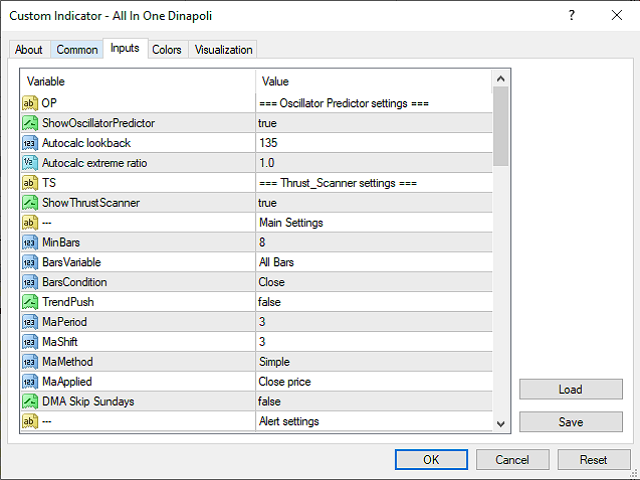
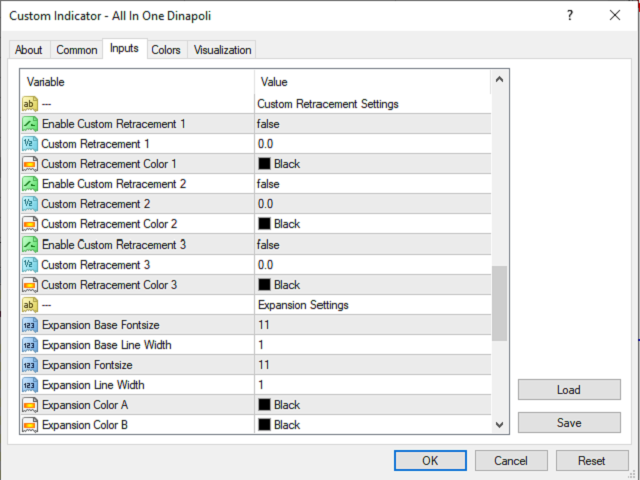
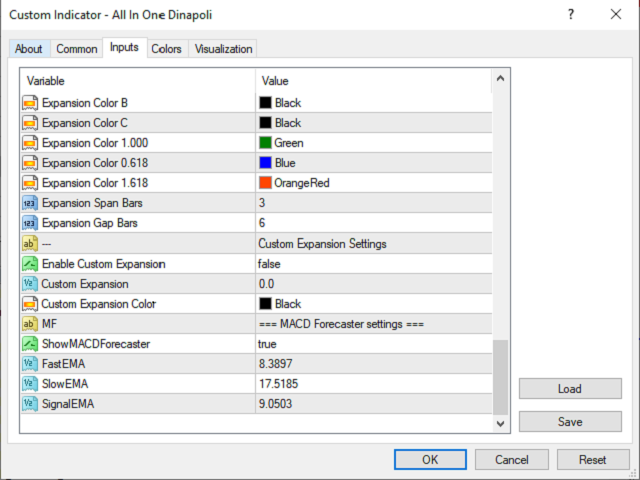
El paquete All in One incluye los indicadores Oscillator Predictor, MACD Predictor, Thrust Scanner y Advanced Fibonacci, que son obligatorios para aplicar los planes comerciales de Dinapoli.
Por favor, visite los siguientes enlaces para obtener explicaciones detalladas de los indicadores.
Indicador Fibonacci Avanzado => https://www.mql5.com/en/market/product/107933
Indicador Thrust Scanner => https://www.mql5.com/en/market/product/52829
Indicador Overbought /Oversold Predictor => https://www.mql5.com/en/market/product/52628
Indicador Macd Predictor => https://www.mql5.com/en/market/product/52623
Para la versión MT4; por favor visite ► https://www.mql5.com/en/market/product/52630
Para Mis Otros Productos; por favor visite ► https://www.mql5.com/en/users/samil34
I bought these indicators about a month ago and already made a billion dollars. Jokes aside, if you're trading Dinapoli style you know what this is. Def worth the money.