Fractal Pattern Scanner MT4
- Indicadores
-
Young Ho Seo
 Harmonic Pattern Indicator - Repainting + Japanese Candlestick Pattern Scanner + Automatic Channel + Many more
https://www.mql5.com/en/market/product/4488 - Versión: 21.8
- Actualizado: 5 marzo 2022
- Activaciones: 5
Introducción a Fractal Pattern Scanner
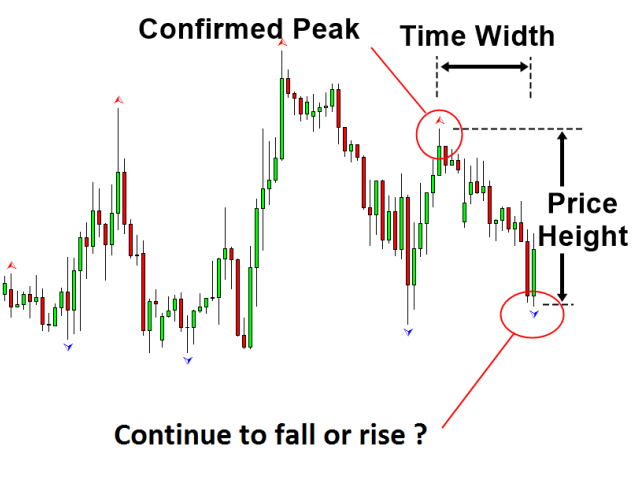
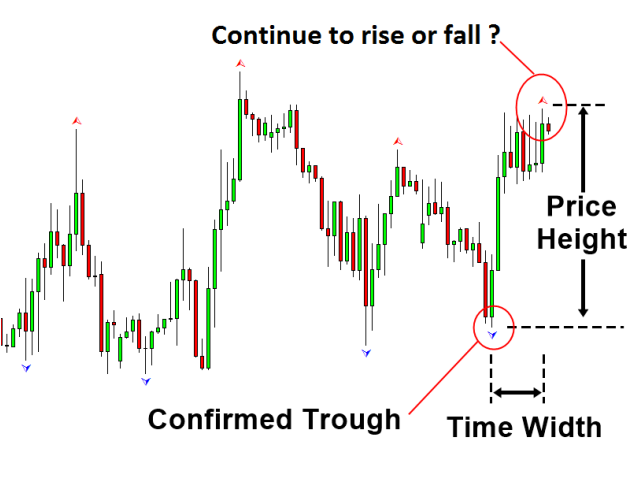
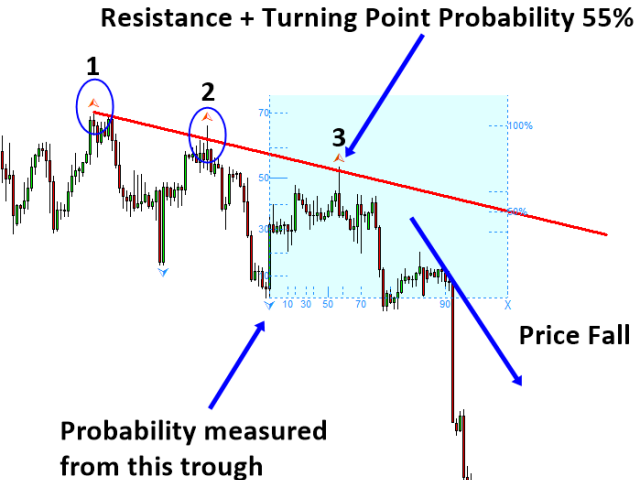
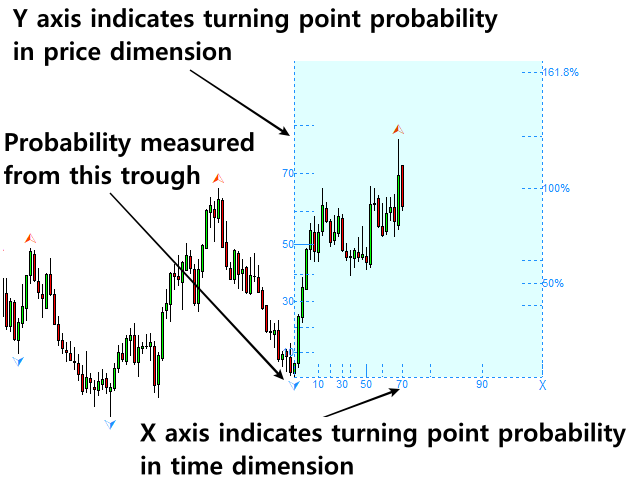
El indicador fractal se refiere al indicador técnico que hace uso de la geometría fractal que se encuentra en el mercado financiero. Fractal Pattern Scanner es un indicador fractal avanzado que incorpora la última tecnología de negociación tras un exhaustivo trabajo de investigación y desarrollo de la geometría fractal en el mercado financiero. La característica más importante de Fractal Pattern Scanner es la capacidad de medir la probabilidad de punto de inflexión, así como la probabilidad de tendencia. Su capacidad para medir la probabilidad de punto de inflexión y la probabilidad de tendencia para cada acción del precio puede aumentar su precisión de negociación marginalmente.
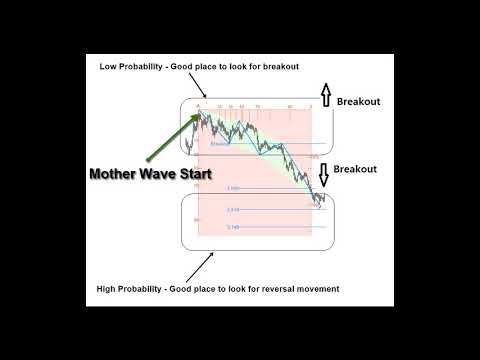
Operaciones de ruptura y de inversión
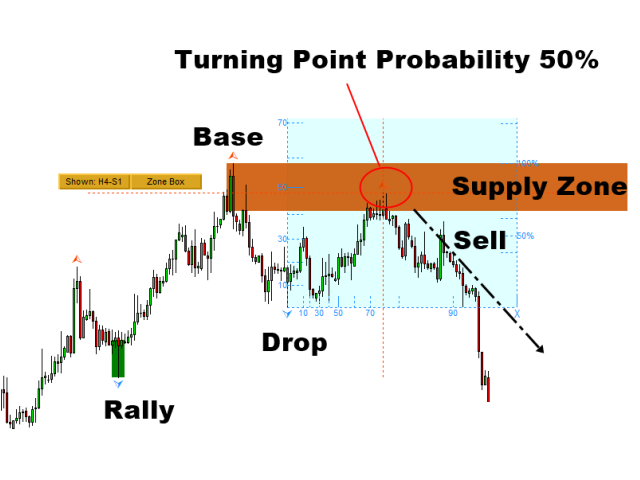
El escáner de patrones fractales puede proporcionarle oportunidades tanto de ruptura como de inversión. En primer lugar, puede utilizar el Fractal Pattern Scanner como máquina de probabilidad pura para medir la probabilidad del punto de inflexión. Esta probabilidad de punto de inflexión cuantifica la acción del precio en cada onda de su gráfico. Mientras utiliza el Fractal Pattern Scanner como máquina de probabilidad pura, puede acceder tanto a las operaciones de reversión como a las de ruptura. Puede buscar la oportunidad de negociación de ruptura cuando la probabilidad del punto de inflexión es relativamente baja, mientras que puede buscar la oportunidad de negociación de inversión cuando la probabilidad del punto de inflexión es relativamente alta. En segundo lugar, puede pedirle al Fractal Pattern Scanner que detecte el patrón de onda madre. La detección del patrón de onda madre puede considerarse como la representación estadística de la Teoría de la Onda de Elliott. Por ejemplo, el patrón de onda madre detecta el patrón dentro de la estructura del patrón, donde los patrones pequeños están dentados dentro del patrón grande como el patrón de onda de Elliott. Con el patrón de onda madre, también puede realizar operaciones de ruptura e inversión.
Características principales
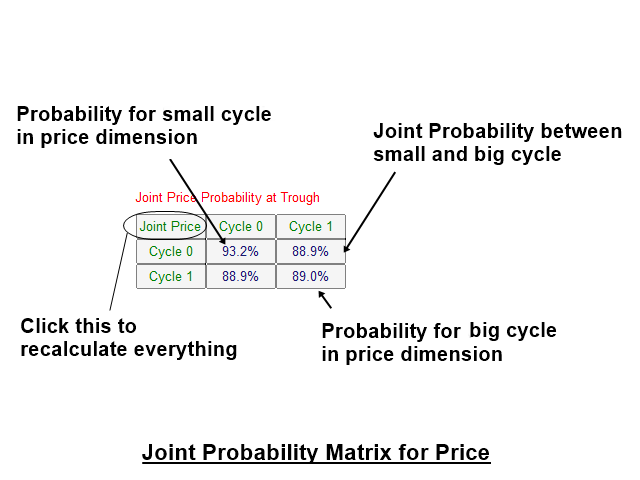
1. 1. Proporcionar la medición automática de la probabilidad de punto de inflexión en múltiples ciclos.
2. Proporcionar el comercio de ruptura y de inversión con la detección de patrón de onda.
3. Proporcionar el panel de múltiples marcos de tiempo para la probabilidad de punto de inflexión.
4. Gráfico de probabilidad de Fibonacci ayuda a detectar la oportunidad de negociación precisa con soporte y resistencia.
5. Ángulos de Gann automatizados (Abanico de Gann), los ángulos de Gann avanzados sintonizados con probabilidad (Bono y característica opcional solamente).
6. 6. Andrew's Pitchfork automatizado (Bono y característica opcional solamente).
Guía de Estrategias de Trading
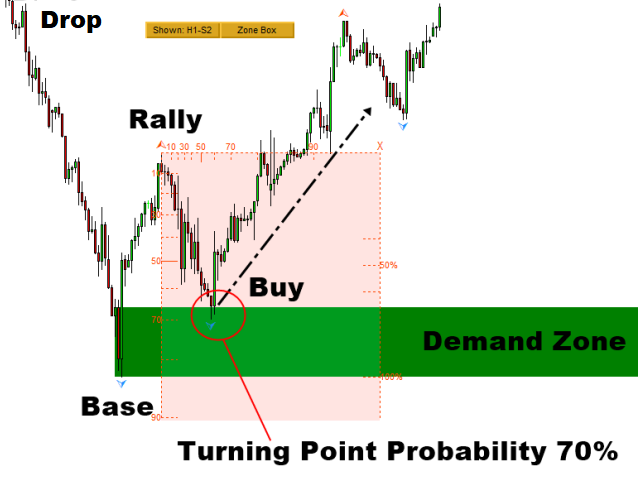
Siempre y cuando usted entienda dónde buscar oportunidades para operar con rupturas y retrocesos, puede combinar el Fractal Pattern Scanner con cualquier otro análisis técnico para operar con retrocesos y rupturas. Especialmente, puede utilizar cualquier soporte y resistencia horizontal con la probabilidad de punto de inflexión y la probabilidad de tendencia. Aunque es posible utilizar el Fractal Pattern Scanner con resistencias diagonales de soporte, así como con patrones de triángulo, cuña ascendente y cuña descendente, recomendamos comenzar con las resistencias horizontales de soporte. Simplemente, es fácil comenzar con la resistencia de soporte horizontal. Por ejemplo, puede utilizar cualquier resistencia de soporte horizontal con Fractal Pattern Scanner.
- resistencia de soporte horizontal
- análisis de oferta y demanda
- análisis fibonacci
- análisis de punto pivote
- número redondo
- etc.
Con un poco de experiencia práctica, pronto aprenderá a controlar su tasa de éxito y hacer la gestión de riesgos con la probabilidad de punto de inflexión. En otras palabras, usted está transformando su comercio en el comercio cuantitativo como lo hace el experto.
Guía de estrategias de trading: https: //www.mql5.com/en/blogs/post/750345
Sistema de Trading Buit-in Breakout
En la guía de estrategias de negociación anterior, hemos proporcionado las formas de mejorar la precisión del análisis de soporte y resistencia con el Fractal Pattern Scanner. Sin embargo, el Fractal Pattern Scanner también proporciona su propia señal de ruptura. Lo hace detectando la onda madre y las ondas hijas. Especialmente, proporcionamos esta señal a través de múltiples marcos temporales. Por lo tanto, usted necesita tener un Fractal Pattern Scanner para cada símbolo. Por lo tanto, hay múltiples maneras de utilizar el Fractal Pattern Scanner para sus operaciones.
Nota Importante
Este es un producto listo para usar. Por lo tanto, no aceptamos ninguna solicitud de modificación o personalización de este producto. Además, no proporcionamos ninguna biblioteca de códigos ni soporte para la codificación de este producto.


Awesome indicator! Really tells you the strength of the move so that you can be prepared for a reversal or a breakout. That was the bit I was missing, and now, I found my trading to have reached the next level! Use over 65% trigger for a reversal, before/after resistance/support repectively: this is a killer strategy!