Di Napoli Squat MT5
- Indicadores
- Versión: 1.1
- Actualizado: 1 mayo 2023
- Activaciones: 15

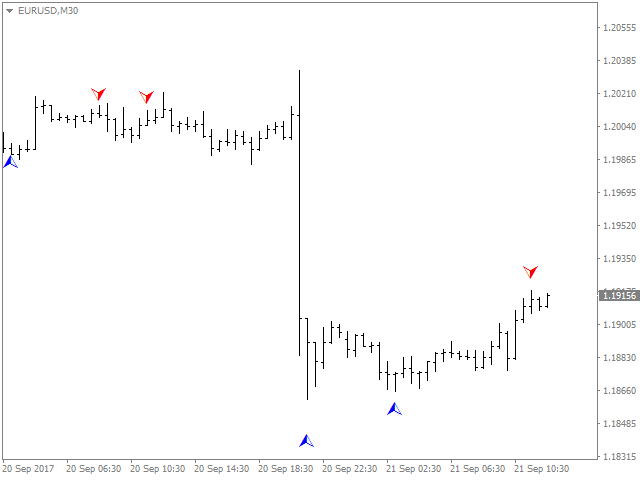
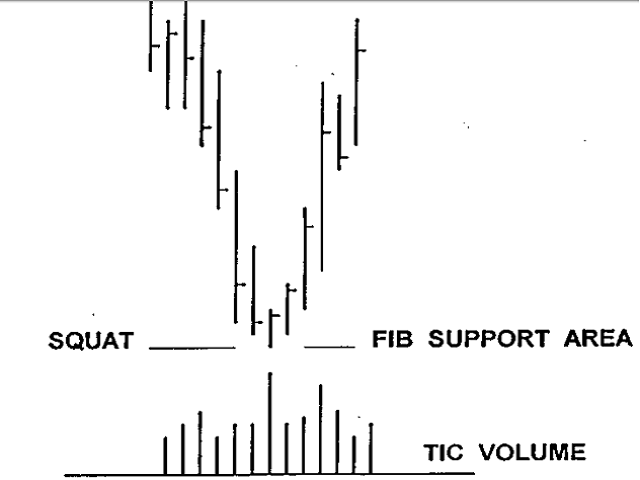
El Squat es una función del rango de una barra de precios determinada y el volumen, o volumen TIC, que se produce mientras se crea ese rango. La idea básica es que un alto volumen y poco movimiento del precio indican un soporte o resistencia sustancial. La idea detrás del enfoque de este indicador es buscar primero un probable soporte y resistencia de Fibonacci y luego ver si el Squat se manifiesta cuando se alcanza ese punto. El indicador determina uno de los patrones de alta probabilidad de DiNapoli. No repinta.
SQUAT: mayor volumen y un IMF menor que el que tiene la barra anterior.
- IMF: rb/v
- rb: Rango de la barra en tics o puntos
- v: Volumen
Técnicas de entrada/salida del mercado tras la señal
- Entrada: En primer lugar, un retroceso poco profundo en los plazos inferiores y, a continuación, el plazo de la señal de Squat (a elección del operador).
- Stop: Parte inferior de la barra en la que se produjo la señal de Squat (a elección del operador)
- Toma de beneficios: Depende de las técnicas de gestión del dinero del operador (depende del operador)
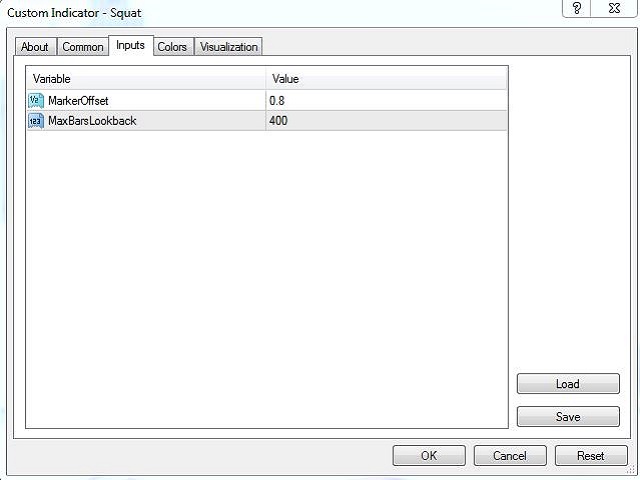
Parámetros
- Desplazamiento del marcador: Ajuste la ubicación de la señal en el gráfico
- Max Bars Lookback: Ajuste el número de barras para que el indicador mire hacia atrás.
Para la versión MT4, visite ► https://www.mql5.com/en/market/product/52777

El usuario no ha dejado ningún comentario para su valoración