MA Multicurrencies Multi timeframes Histogram
- Indicadores
- Versión: 2.2
- Actualizado: 25 junio 2020
- Activaciones: 5

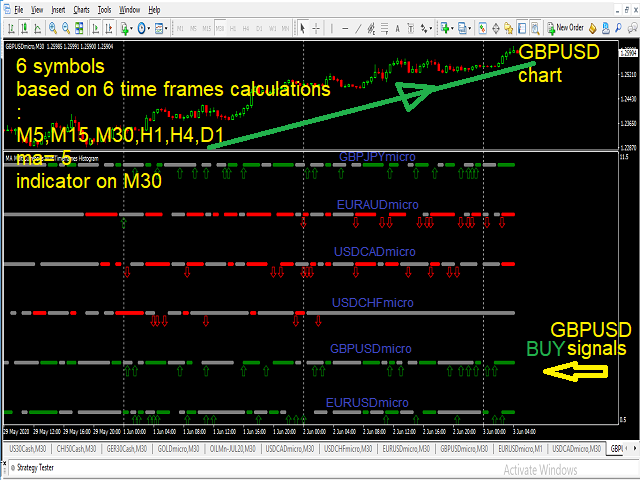
MA Multi-Divisas Multi-Tiempos Histograma Indicador COMPRA/VENTA
hasta 6 divisas a la vez
cálculos basados en 6 marcos temporales : M5, M15, M30, H1, H4, D1
Estrategias de Trading:
**La tendencia cambia a alcista cuando el punto verde aparece después de los puntos rojo y gris -> Cierre las posiciones de VENTA y luego añada nuevas posiciones de COMPRA en los nuevos puntos verdes.
**La tendencia cambia a BAJA cuando el punto rojo aparece después de los puntos verde y gris -> Cierre las posiciones de COMPRA y añada nuevas posiciones de VENTA en los nuevos puntos rojos.
** Cerrar posiciones de COMPRA en tendencia ALTA cuando el punto Gris aparece después de los puntos Verdes y las posiciones son rentables.
** Cierre posiciones de VENTA en tendencia BAJA cuando el punto Gris aparezca después de los puntos Rojos y las Posiciones sean rentables.
Pulsando sobre cualquier símbolo del indicador se abrirá su gráfico para operar.
Opciones de activación/desactivación de alertas en nuevas señales de compra/venta
puede inicializarlo en cualquier marco de tiempo de símbolo inferior a H4
entrada principal : índice ma = yo uso 5
-> Valor alto significa señales a largo plazo
-> Un valor bajo significa señales a corto plazo
(puede probar diferentes valores) en la prueba de demostración
Disfrute de la prueba de demostración y dar retroalimentación