RBCI hist
- Indicadores
- Versión: 1.1
- Actualizado: 21 noviembre 2021
- Activaciones: 5

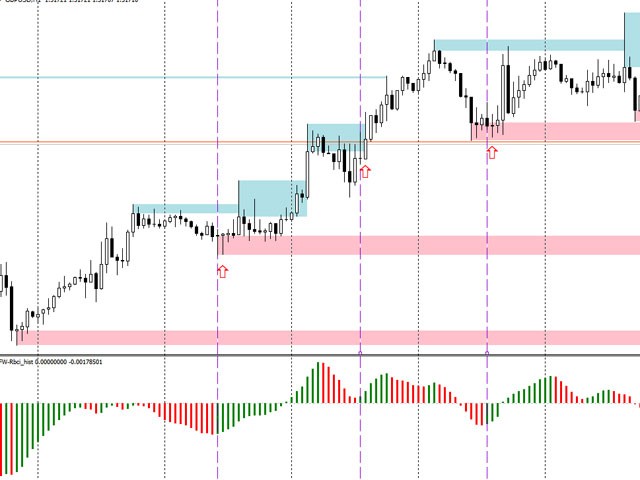
El indicador RBCI hist es un histograma de tendencia adaptativo, que elimina el ruido utilizando un filtro de paso bajo, que pasa las frecuencias más bajas y corta las frecuencias altas de las fluctuaciones de precios.
La señal (dependiendo de la estrategia elegida por el operador) es la intersección de la línea cero por el indicador, así como el cambio en el color del histograma. El cambio en el color del histograma sirve como una señal temprana para la apertura de posiciones hacia la tendencia. La posición del indicador con respecto al nivel cero muestra la fuerza de la tendencia actual. La disponibilidad de una ventana de información, que muestra la información sobre el indicador en otros marcos de tiempo, es una buena adición durante el comercio de opciones o el comercio por scalping. La primera línea informa sobre la tendencia actual, la segunda - sobre su fuerza.
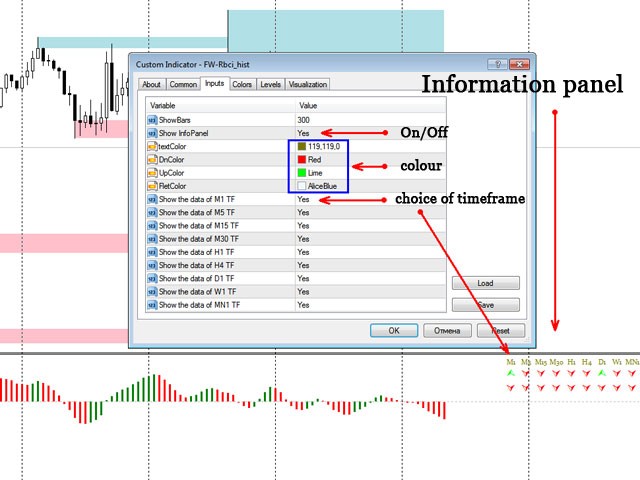
Parámetros ajustables:
- ShowBars = 300 - Profundidad de la historia para la visualización del indicador en el gráfico;
- ShowInfoPanel = YES - mostrar el panel de información;
- textColor - color del período de la ventana de información;
- DnColor - color de la señal de tendencia bajista del indicador;
- UpColor - color de la señal de tendencia alcista del indicador;
- FletColor - color de la señal de igualdad de tendencia alcista y bajista del indicador;
- use_M1-use_MN1 = YES - mostrar información en el marco de tiempo actual;