SFT Fibo Volatility Channel
- Indicadores
-
Artem Kuzmin
 ALL PRODUCTS ▶️ https://www.mql5.com/ru/users/zombiezorrofx/seller
🔥 Maximum commission discounts:
💠 Binance 35% (trading bypassing sanctions) - Versión: 1.0
- Activaciones: 5
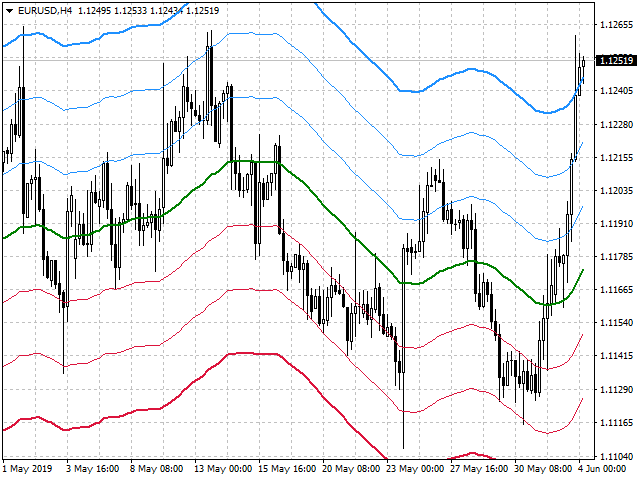
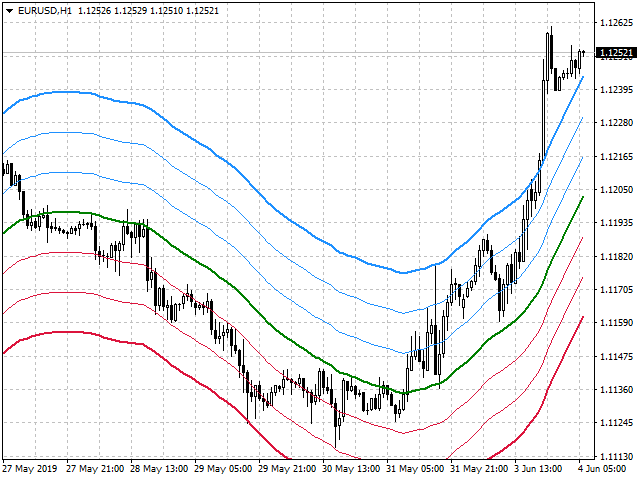
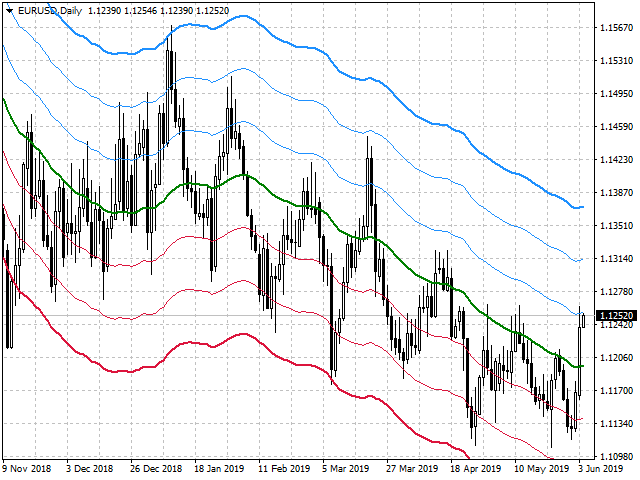
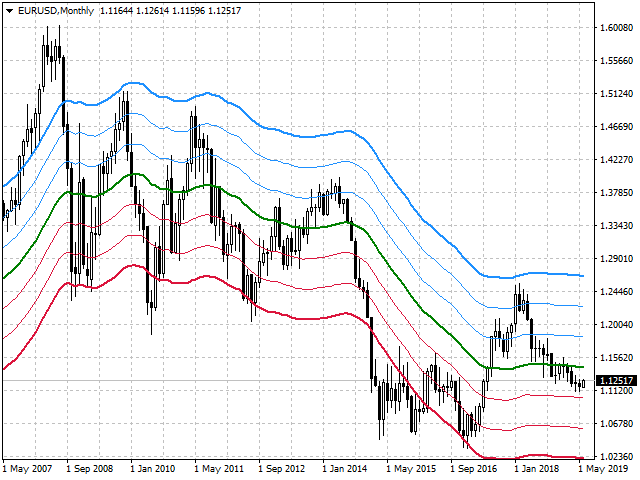
El indicador muestra el canal en el que se mueve el precio
El algoritmo de cálculo del indicador se basa en los números de Fibonacci y también depende de la volatilidad del instrumento.
Las correcciones e inversiones de precios son más probables cerca de los bordes del canal.
Le permite realizar operaciones de tendencia y contra tendencia dentro del canal
Funciona en todos los marcos temporales, en cualquier par de divisas, metales y criptodivisas
Se puede utilizar cuando se trabaja con opciones binarias
Características distintivas
- Muestra límites claros del movimiento de los precios
- Adecuado para el comercio de mercado y órdenes pendientes;
- Basado en el valor dorado de Fibonacci y la volatilidad del instrumento
- Tiene una configuración sencilla y clara;
- Funciona en todos los marcos temporales y en todos los símbolos;
- Adecuado para el comercio de divisas, metales, opciones y cryptocurrency (Bitcoin, Litecoin, Ethereum, etc.)
- Adecuado para el comercio manual y para el desarrollo de asesores;
Para obtener entradas más precisas y señales de confirmación adicionales se puede utilizar junto con otros indicadores.
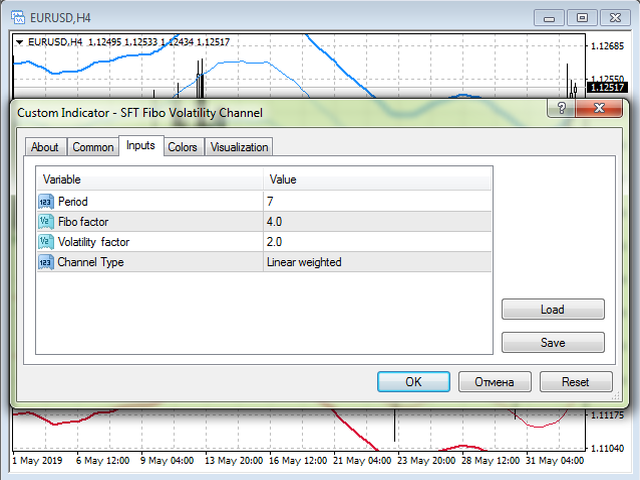
Configuración del indicador
- Período - período de cálculo del indicador;
- Factor de Fibo - coeficiente del algoritmo de Fibonacci;
- Factor de volatilidad - coeficiente de volatilidad del instrumento;
- Tipo de canal - tipo de algoritmo de construcción del canal;
Recomendaciones de negociación
- La dirección de la operación debe corresponder a la pendiente del propio canal.
- Cuando el precio se acerque al borde rojo, abra Sell o Put (para opciones)
- Cuando el precio se acerque al borde azul, abra la opción de compra o call (para opciones).
- Salga de la operación en la línea media (verde) o de acuerdo con el SL y TP establecidos.
- Cuando se utiliza SL y TP, es aconsejable establecer el SL para el extremo más cercano, TP = 1..2 SL o en una de las líneas de color opuesto.
Bien probado en colaboración con el indicador libre SFT Bullet Arrow
Para obtener más información y una visión más detallada de los métodos de negociación ver aquí:
Estrategia de trading con SFT Fibo Volatility Channel
Le deseamos un comercio estable y rentable.
Gracias por utilizar nuestro software.
Si le gusta, haga una buena acción y comparta el enlace con sus amigos.
Para no perderse el lanzamiento de nuevos programas útiles para el comercio - añadir como amigo:SURE FOREX TRADING


El usuario no ha dejado ningún comentario para su valoración