AguiaTraders F12 PRO
- Indicadores
-
Renato Fiche Junior
 I am a trader and software developer (C#, Java, MQL 4 and 5 etc).
 - Versión: 4.10
- Actualizado: 16 noviembre 2025
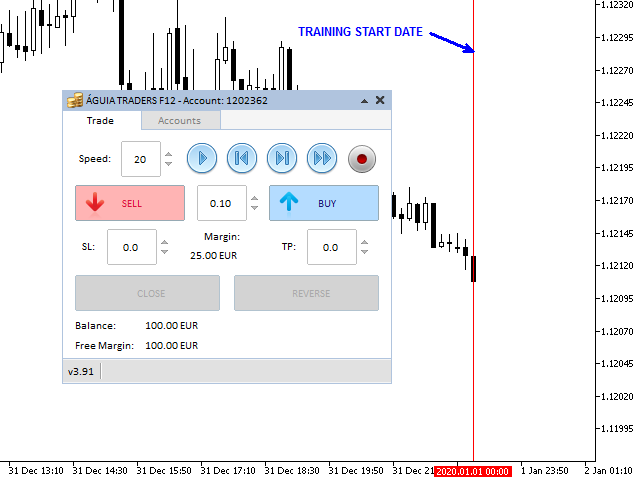
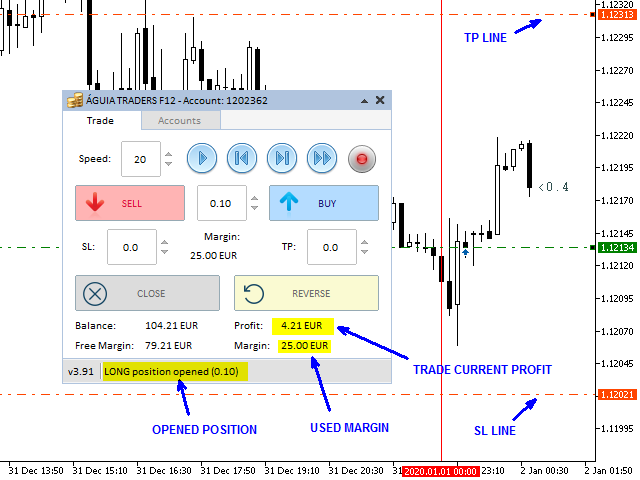
Esta herramienta fue desarrollada para ayudar a los operadores en el entrenamiento vela por vela y repetición. En la configuración del indicador, el usuario puede establecer la fecha de inicio del entrenamiento. El indicador ocultará automáticamente todas las velas después de esta fecha. Así el usuario puede hacer estudios antes de comenzar el entrenamiento. Al iniciar el entrenamiento, el usuario puede simular sus operaciones de forma rápida y sencilla.
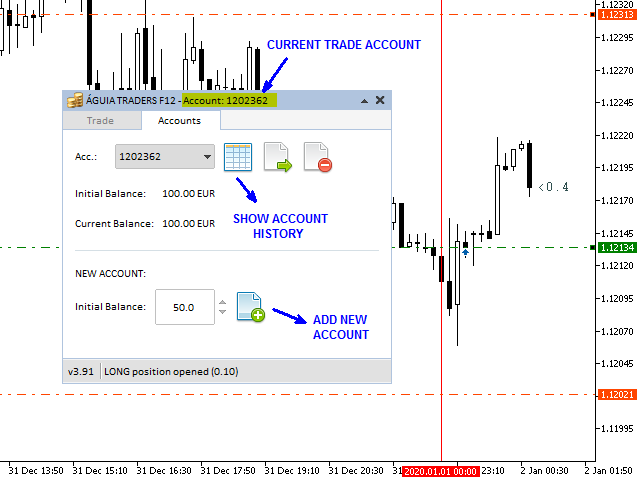
¡Este es un producto desarrollado por Renato Fiche Junior y disponible para todos los usuarios de MetaTrader 5!
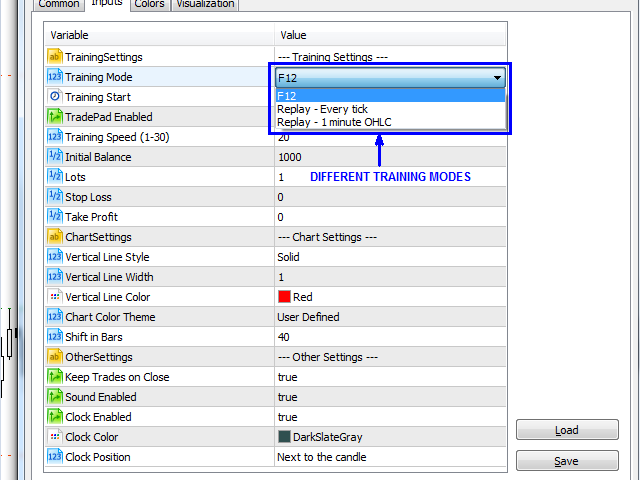
Parámetros de entrada
- Inicio del entrenamiento - fecha de inicio del entrenamiento (El indicador ocultará automáticamente todas las velas después de esta fecha)
- Vertical Line Style - estilo de la línea vertical de la fecha de inicio de la formación
- Vertical Line Width - ancho de la línea vertical de la fecha de inicio del entrenamiento
- Color de la línea vertical - color de la línea vertical de la fecha de inicio del entrenamiento
Teclas de acceso rápido
- Letra "x" - Reinicia el entrenamiento (oculta todas las velas después de la fecha de inicio del entrenamiento)
- Letra "i" - Mover el gráfico a la fecha de inicio del entrenamiento
- Letra "t" - Mueve el gráfico a la última vela visible (estado actual del entrenamiento)
- Letra "f" - Mueve el gráfico a la última vela del día (muestra todas las velas hasta el final del día)
****** Limitaciones
- La herramienta sólo soporta medias móviles a través del indicador Custom MA F12 Replay(https://www.mql5.com/en/market/product/53550). No soporta otros indicadores. Para evitar esta limitación, debe utilizar el parámetro "Shift In Bars" igual a 0 (CERO) para que el gráfico esté siempre desplazado a la derecha.


Excelente ferramenta!