MTF Candles PRO
- Indicadores
-
Renato Fiche Junior
 I am a trader and software developer (C#, Java, MQL 4 and 5 etc).
 - Versión: 1.0
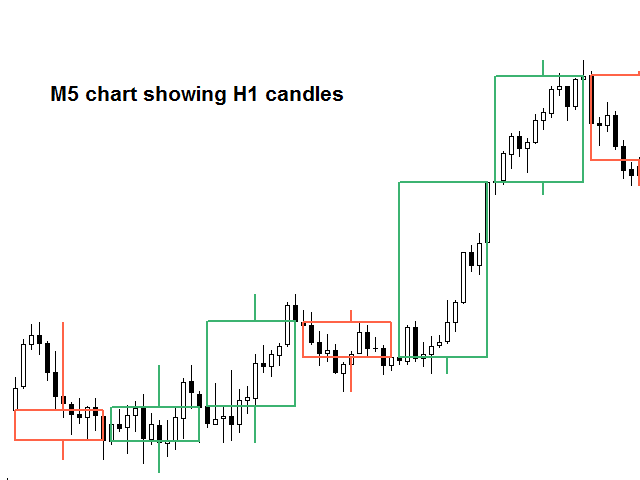
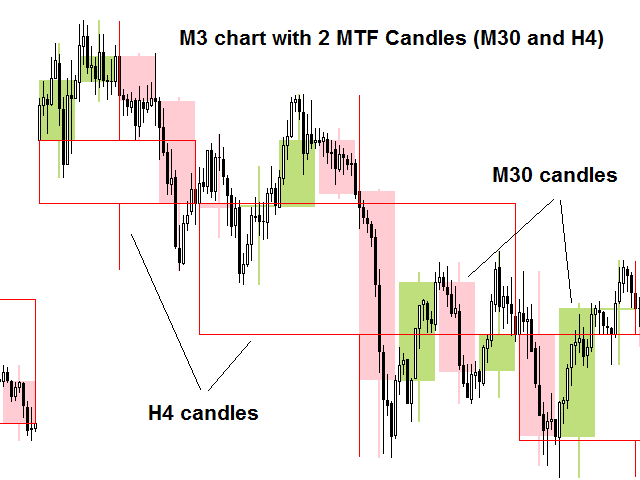
Herramienta que permite ver velas en múltiples marcos temporales. De esta forma, ayuda al análisis en múltiples timeframes.
¡Este es otro producto desarrollado por Renato Fiche Junior y disponible para todos los usuarios de MetaTrader 5!
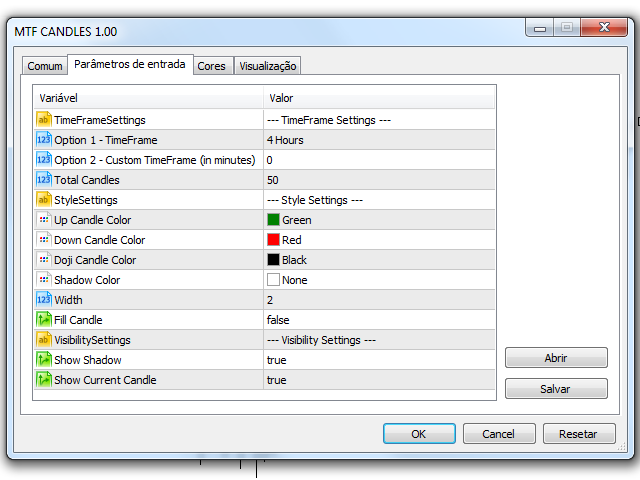
Parámetros de entrada
- Opción 1 - TimeFrame: MT5 marco de tiempo estándar
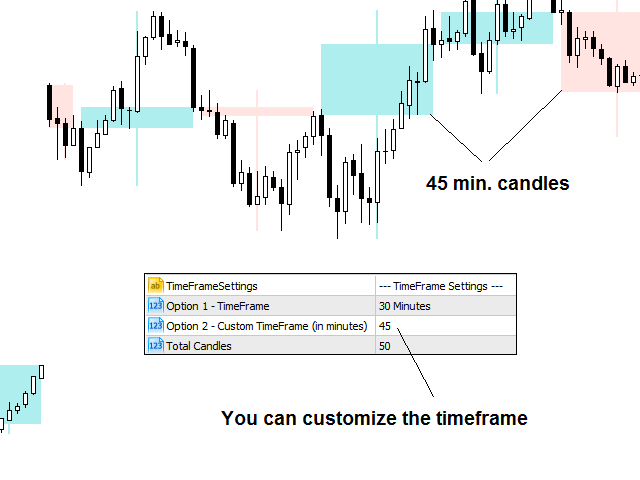
- Opción 2 - Custom TimeFrame (en minutos): O, si este valor es diferente de cero, el timeframe será personalizado. Esto le permite elegir un timeframe diferente al estándar de MT5.
- Total Velas: Número de velas.
- Up Candle Color: Color de las velas altas.
- Down Candle Color: Color de las velas bajas.
- Doji Candle Color: Color de las velas doji.
- Shadow Color: Color de las sombras de las velas
- Anchura: Grosor de la línea de contorno de la vela y las sombras
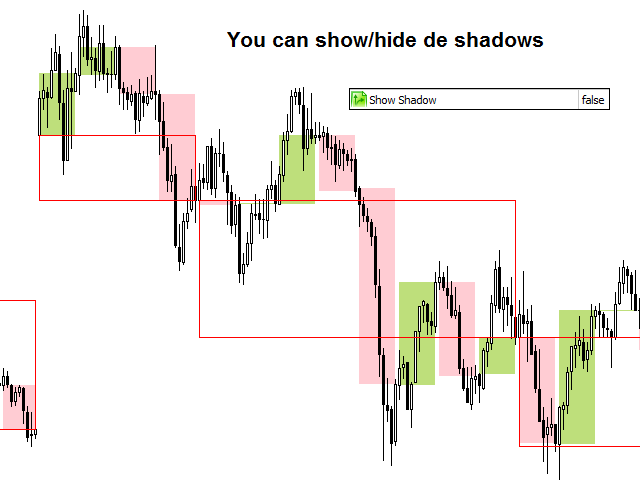
- Rellenar Vela (verdadero / falso): Rellenar o no las velas
- Mostrar Sombra (true / false): Mostrar o no las sombras de las velas
- Mostrar vela actual (verdadero / falso): Mostrar o no la vela actual


This indicator does not work. My first purchase on MQL5 has been such a bad experience. I am asking for a refund as it simply does not work. If an indicator does not work on MT5 simulator then how do you want traders to use it? It does not work on the MT5 terminal, and I was expecting a better support.