AguiaTraders F12 PRO
- 지표
- 버전: 4.10
- 업데이트됨: 16 11월 2025

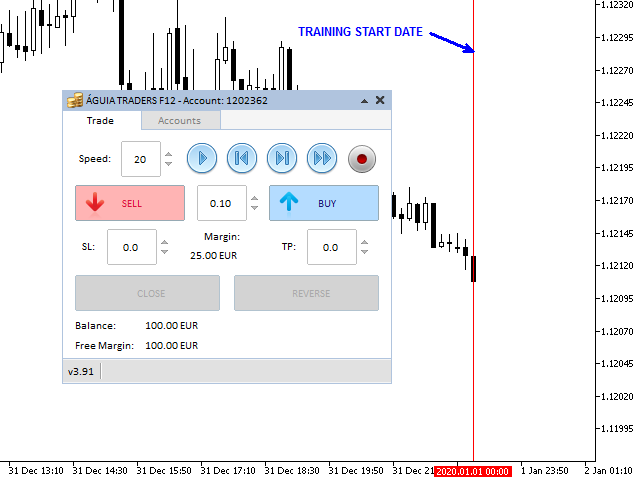
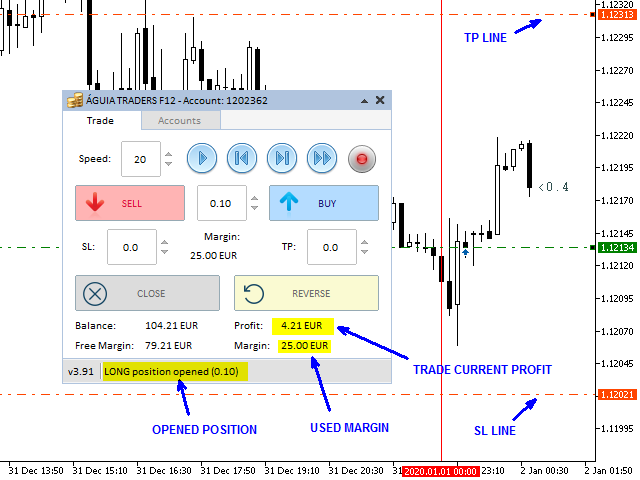
This tool was developed to help traders on candle by candle and replay training. In the indicator settings, the user can set the training start datetime. The indicator will autommatically hide all candles after this datetime. So the user can make studies before starting the training. Starting the training, the user can simulate your trades quickly and easily!
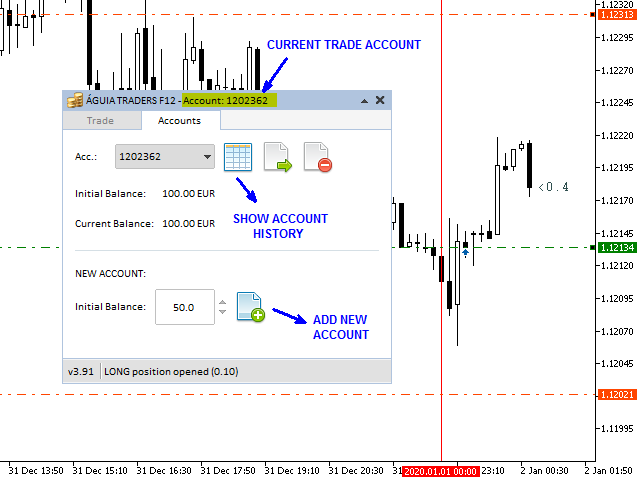
This is a product developed by Renato Fiche Junior and available to all MetaTrader 5 users!
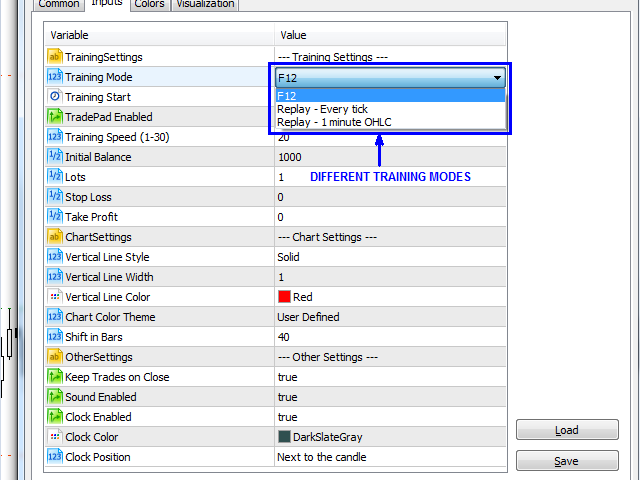
Input Parameters
- Training Start - training start datetime (The indicator will autommatically hide all candles after this datetime)
- Vertical Line Style - style of training start datetime vertical line
- Vertical Line Width - width of training start datetime vertical line
- Vertical Line Color - color of training start datetime vertical line
Hotkeys
- Letter "x" - Restart the training (hides all candles after training start datetime)
- Letter "i" - Move the chart to the training start datetime
- Letter "t" - Move the chart to the last visible candle (training current status)
- Letter "f" - Move the chart to the last candle fo the day (shows all candles until the end of the day)
****** Limitations
- The tool supports only moving averages through the Custom MA F12 Replay indicator (https://www.mql5.com/en/market/product/53550). It does not support other indicators. To get around this limitation, you must use the parameter "Shift In Bars" equal to 0 (ZERO) for the chart to be always shifted to the right.


Excelente ferramenta!