Elliott Wave Trend MT5
- Indicadores
-
Young Ho Seo
 Harmonic Pattern Indicator - Repainting + Japanese Candlestick Pattern Scanner + Automatic Channel + Many more
https://www.mql5.com/en/market/product/4488 - Versión: 11.5
- Actualizado: 2 marzo 2022
- Activaciones: 6
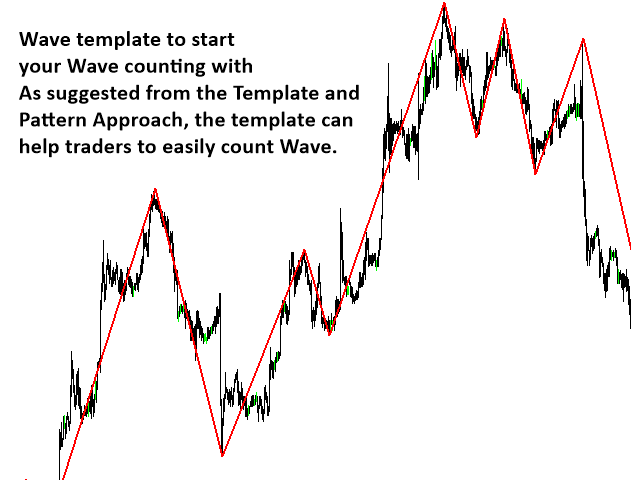
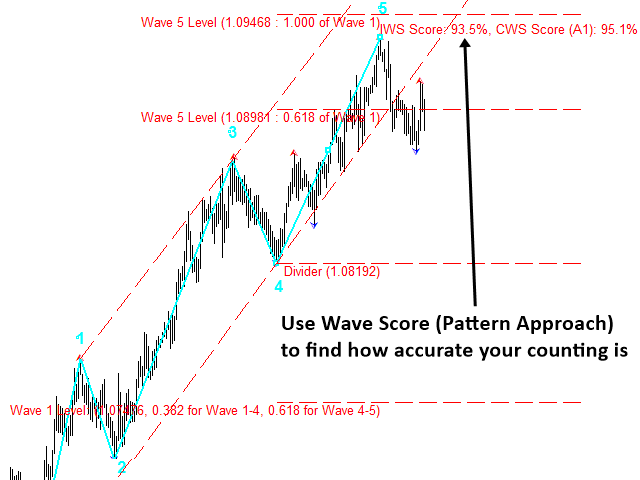
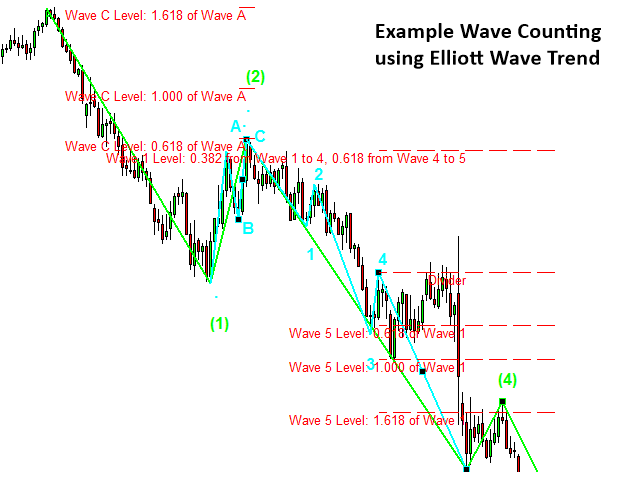
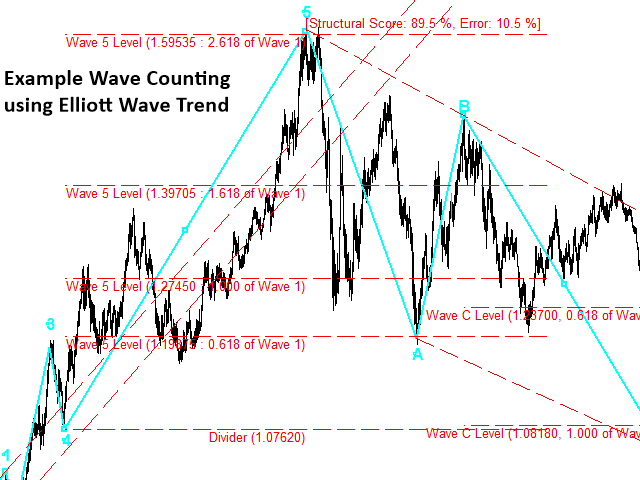
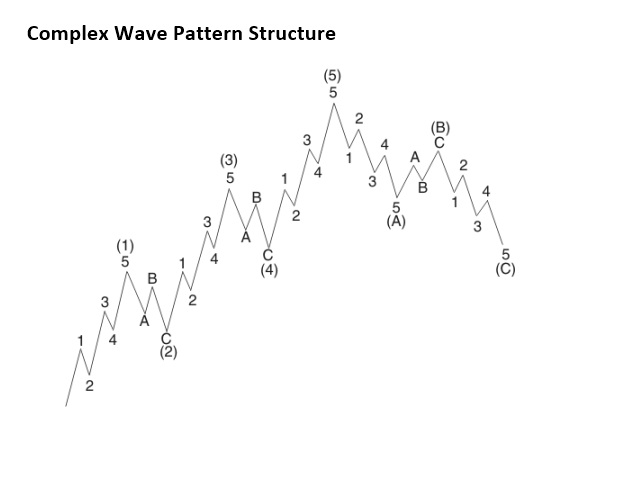
Elliott Wave Trend fue diseñado para el conteo científico de ondas. Esta herramienta se centra en deshacerse de la vaguedad de la clásica Elliott Wave Counting utilizando la pauta de la plantilla y el enfoque patrón. Para ello, en primer lugar, Elliott Wave Trend ofrece la plantilla para el recuento de ondas. En segundo lugar, ofrece la puntuación estructural de la onda para ayudar a identificar la formación de la onda precisa. Ofrece tanto la puntuación estructural de la onda impulsiva como la puntuación estructural de la onda correctiva. La puntuación estructural es la calificación para mostrar lo bueno que es su patrón de onda de Elliott. 100% significa que es un buen patrón de onda. La puntuación por debajo del 80% o valores negativos significa que puede tener algunos errores en su análisis. Elliott Wave Trend corregirá algún error obvio en su recuento de ondas si el recuento va en contra de las tres reglas de onda propuestas por Ralph Elliott.
Debe Leer
Tenga en cuenta que aunque hay muchas funciones automáticas dentro de Elliott Wave Trend. Sin embargo, todavía se requiere alguna operación manual para el conteo de Ondas de Elliott. Además, necesitará cierta disciplina y conocimiento en el conteo de ondas de Elliott para utilizar esta herramienta.
Nuestro Elliott Wave Trend funciona principalmente con botones y clics del ratón.
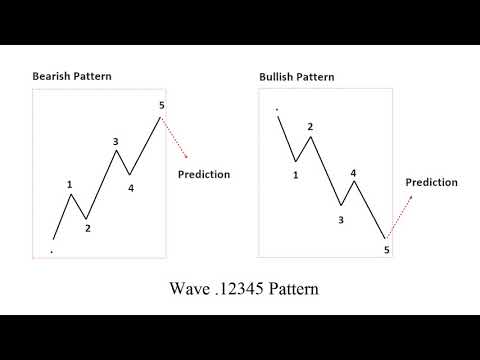
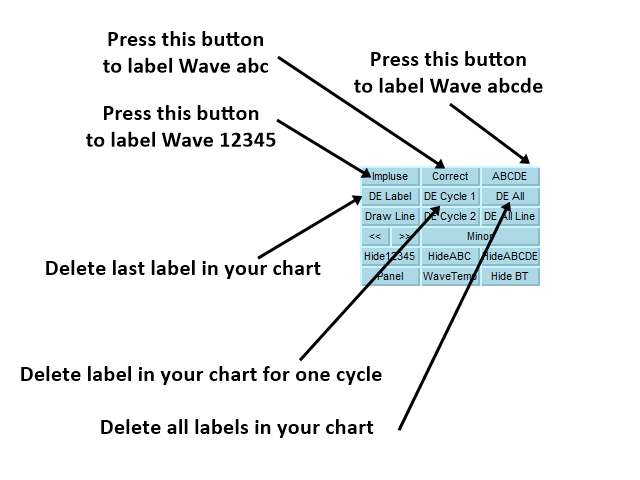
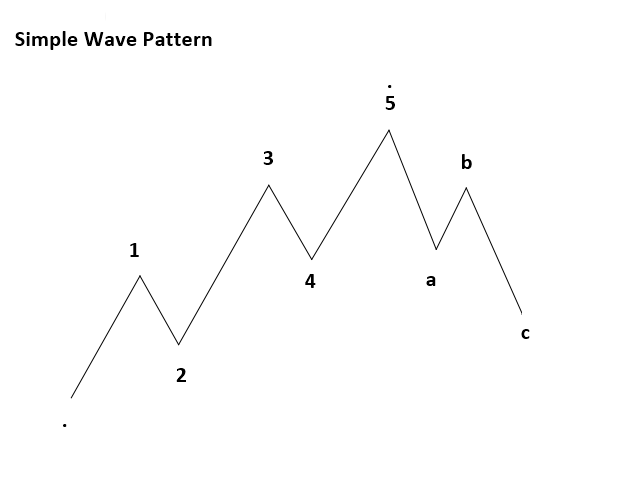
- Impulso: Presione este botón primero para comenzar a etiquetar ondas de impulso en su gráfico. Cuando este botón está desactivado, no puede etiquetar ninguna onda de impulso en su gráfico. Una vez pulsado este botón, haga doble clic en su gráfico para etiquetar cada onda de impulso (es decir, onda 1, 2, 3, 4 y 5). Cuando termine de etiquetar cada onda de impulso, suelte de nuevo este botón. Tenga en cuenta que en su primer doble clic, se marcará el origen (.) de su onda. Después seguirán las etiquetas 1, 2, 3, 4 y 5.
- Corregir: Pulse este botón primero para empezar a etiquetar ondas correctivas en su gráfico. Cuando este botón está ofrecido, no puede etiquetar ninguna onda correctiva en su gráfico. Una vez pulsado este botón, haga doble clic en su gráfico para etiquetar cada onda correctiva (es decir, onda A, B y C). Cuando termine de etiquetar la onda de impulso, suelte este botón de nuevo. Tenga en cuenta que en su primer doble clic, se marcará el origen (.) de su onda. Después seguirán las etiquetas A, B y C.
- Etiqueta DE: Etiqueta DE es la abreviatura de borrar etiqueta. Cuando presione este botón, la última etiqueta será borrada de su gráfico.
- DE Ciclo 1: DE Ciclo 1 es la abreviatura de Borrar Ciclo 1. Al pulsar este botón, se borrarán todas las etiquetas del ciclo de onda actual. Mientras esté pulsado el botón de impulso, al pulsar DE Ciclo 1 se eliminarán todas las etiquetas de la onda de impulso en el ciclo actual, dejando sólo las etiquetas de la onda correctiva. Si se pulsa el botón de corrección, al pulsar el botón DE Ciclo 1 se eliminarán todas las etiquetas de la onda correctiva del ciclo actual.
- DE ALL: DE ALL es la abreviatura de borrar todo. Al pulsar este botón, se eliminarán todas las etiquetas independientemente de su ciclo.
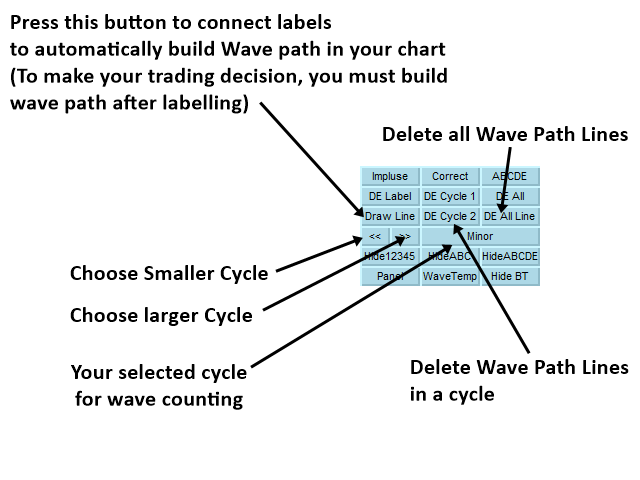
- Dibujar Línea: Debe utilizar este botón después de haber realizado el etiquetado en su gráfico. Cuando pulse este botón, Elliott Wave Trend conectará cada etiqueta con líneas automáticamente.
- DE Ciclo 2: DE Ciclo 2 es la abreviatura de Borrar Ciclo 2. Al pulsar este botón, se borrarán todas las líneas del ciclo de onda actual. Mientras esté pulsado el botón de impulso, al pulsar DE Ciclo 2 se eliminarán todas las líneas de la onda de impulso en el ciclo actual dejando sólo las líneas de la onda correctiva. Si se pulsa el botón de corrección, al pulsar el botón DE Ciclo 2 se eliminarán todas las líneas de la onda correctiva del ciclo actual.
- DE Todas las Líneas: DE All Line es la abreviatura de Delete All Lines. Al pulsar este botón, se eliminarán todas las líneas independientemente de su ciclo.
- Panel: Pulse este botón para mostrar y ocultar el panel de información. El panel de información le proporciona las tres reglas de conteo de las Ondas de Elliott.
- Tendencia de la onda: Pulse este botón para mostrar y ocultar el indicador de tendencia en su gráfico. Puede utilizar este indicador de tendencia para ayudarle en sus operaciones.
- << : disminuir Ciclo
- >> : aumentar Ciclo
Guía de estrategias de negociación
Usted encontrará la línea de guía detallada utilizando la Teoría de las Ondas de Elliott y el Patrón de las Ondas de Elliott desde el siguiente enlace:
https://www.mql5.com/en/blogs/post/750343
Nota importante
Este es el producto de la plataforma. Por lo tanto, no aceptamos ninguna solicitud de modificación o personalización de este producto. Además, no proporcionamos ninguna biblioteca de código o cualquier soporte para su codificación para este producto.


Ein super Indikator, kann ich nur empfehlen. Für die gerne mit Elliot Wellen Traden.