Fibonacci Volatility Indicator MT5
- Indicadores
-
Young Ho Seo
 Harmonic Pattern Indicator - Repainting + Japanese Candlestick Pattern Scanner + Automatic Channel + Many more
https://www.mql5.com/en/market/product/4488 - Versión: 6.8
- Actualizado: 30 julio 2020
- Activaciones: 5
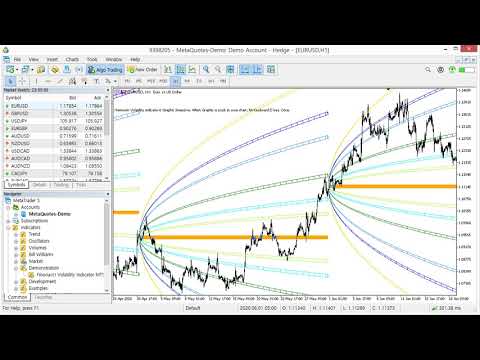
Introducción al indicador de volatilidad de Fibonacci
El indicador de volatilidad puede ayudarle a detectar cualquier ventaja estadística para sus operaciones. Especialmente, si usted está operando con la acción del precio y los patrones de precios, entonces le recomendamos que utilice el indicador de volatilidad junto con su estrategia. Especialmente, el indicador de volatilidad de Fibonacci combina la volatilidad del mercado con el análisis de Fibonacci para proporcionarle un indicador de volatilidad más avanzado.
Características principales
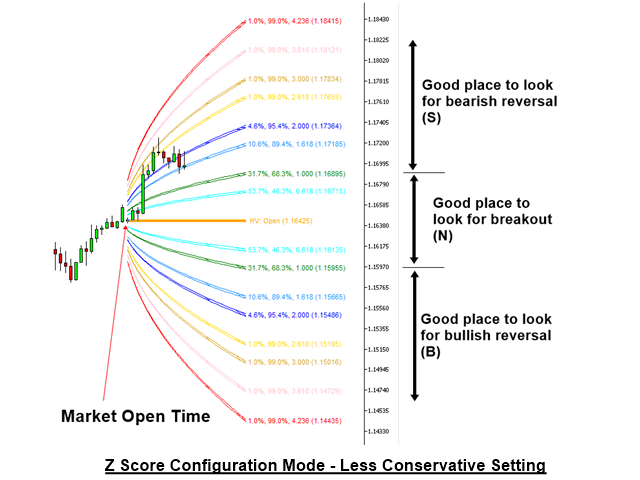
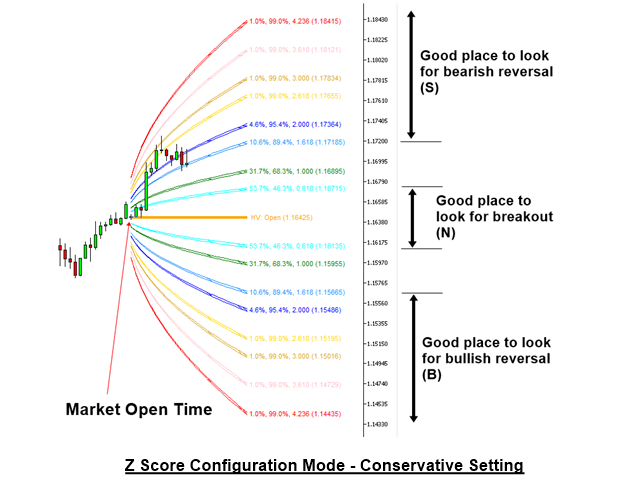
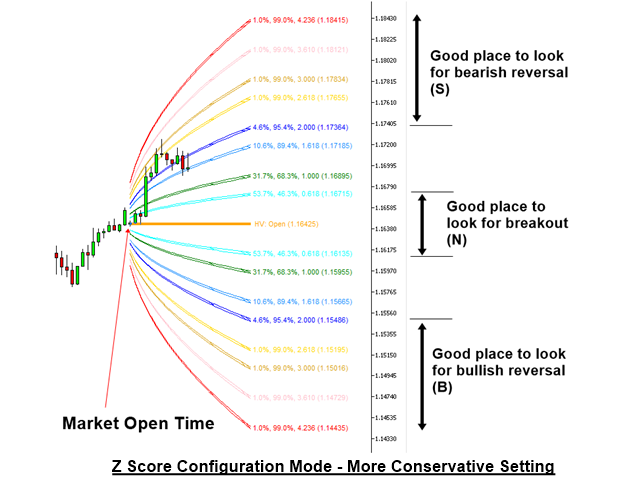
- Volatilidad Fibonacci en modo de configuración de puntuación Z
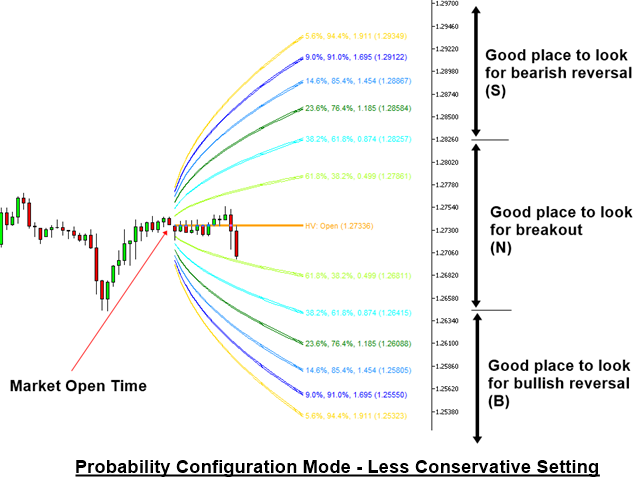
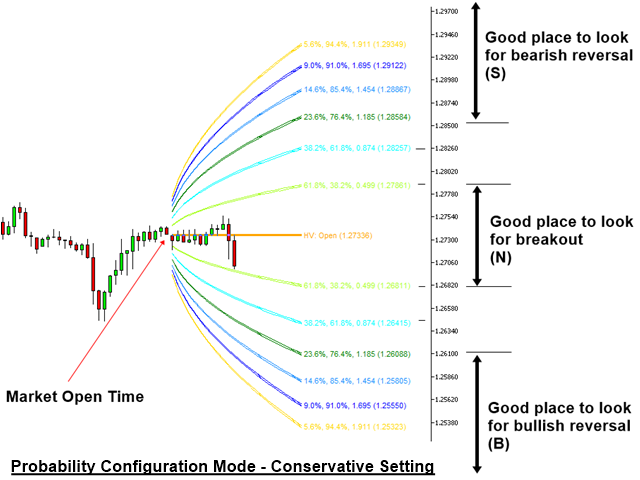
- Volatilidad de Fibonacci en Modo de Configuración de Probabilidad
- Modo de Volatilidad Diaria, Semanal, Mensual y Anual
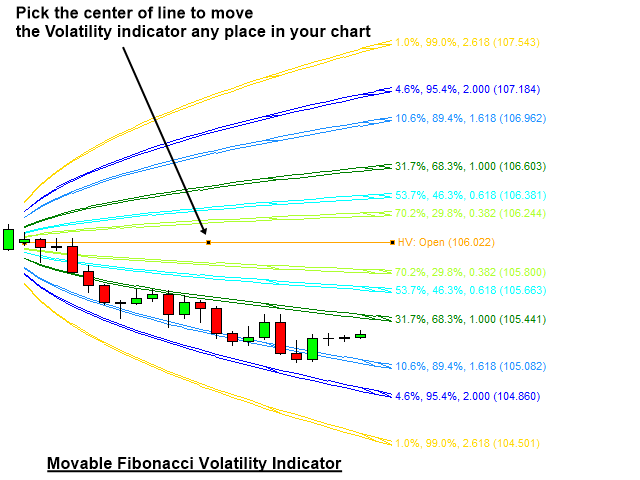
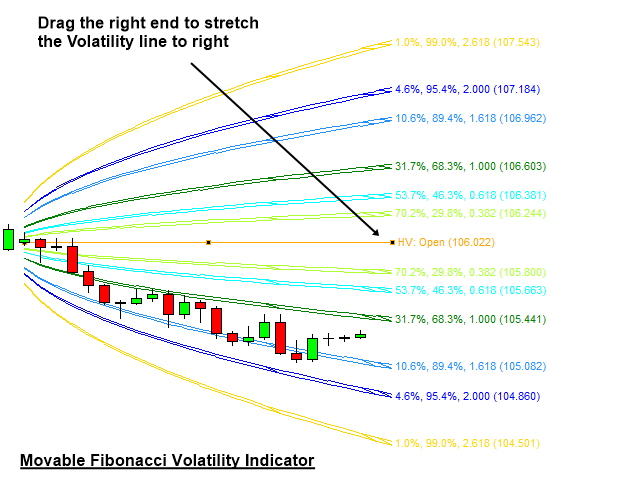
- Volatilidad Móvil - Útil para el análisis de patrones geométricos
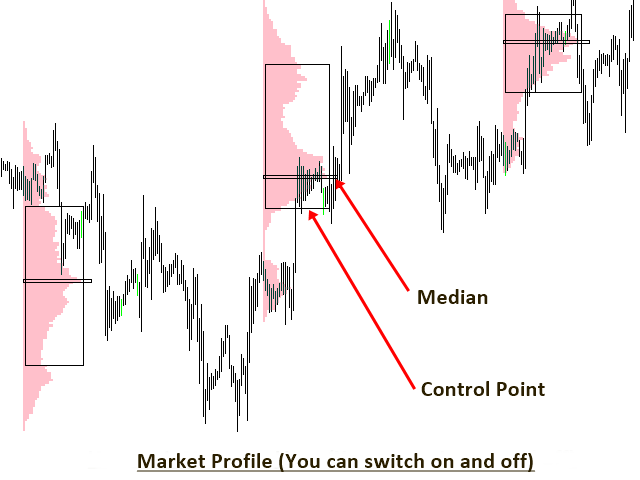
- Análisis de Perfiles de Mercado
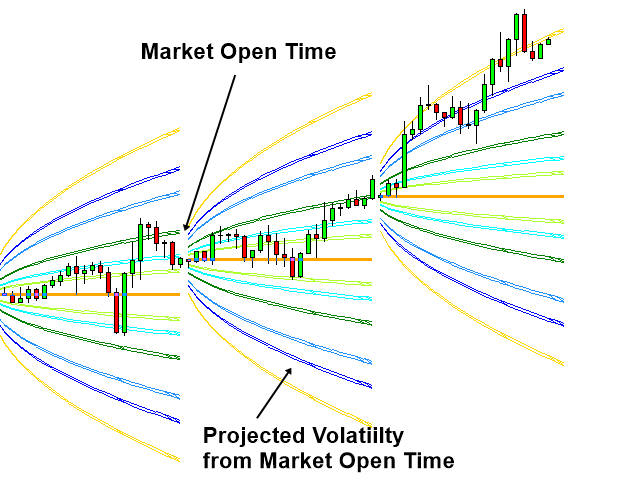
- Soporte y Resistencia utilizando la proyección de Volatilidad
- Alerta de zona de baja volatilidad
- Alerta de zona de alta volatilidad
Guía de estrategias de negociación
Puede encontrar la guía detallada de estrategia de trading sobre cómo utilizar el indicador de volatilidad en el siguiente enlace. Le recomendamos que lea este artículo antes de utilizar este indicador de volatilidad en sus operaciones.
https://www.mql5.com/en/blogs/post/750389
Configuración
Para utilizar el modo de configuración de puntuación Z, establezca "Usar configuración de puntuación Z" = true. Si establece "Use Z Score Configuration" = false, entonces el indicador utilizará el modo de configuración de probabilidad. El modo de configuración de probabilidad es el mismo que el indicador de volatilidad armónica. Las siguientes entradas controlan la configuración global del indicador.
- Número de Sesión Diaria: 0 significa que el indicador no dibujará ninguna línea de volatilidad diaria. 1 significa que el indicador dibujará un conjunto de líneas de volatilidad diaria. Puede crear múltiples sesiones de líneas de volatilidad diarias. Sin embargo, demasiadas sesiones pueden ralentizar su MetaTrader. Así que utilice el número correcto para su equipo.
- Número de Sesión Semanal: Es igual que la entrada de sesión diaria.
- Número de sesiones mensuales: Es el mismo que el de la sesión diaria.
- Índice inicial: 0 es el valor por defecto. Para 0, el indicador empezará a dibujar desde la sesión 0.
- Usar Gráfico Blanco: Verdadero significa que utilizará un gráfico con fondo blanco.
- Usar Color de Línea Individual: Si es falso, entonces usará el esquema de color global. Si es verdadero, entonces puede usar un esquema de color individual.
- Color Línea Diaria: Color de la línea diaria
- Color Línea Semanal: Color de la línea semanal
- Color Línea Mensual: Color de la línea mensual
- Mostrar líneas de probabilidad: Activar y desactivar la línea curva de probabilidad
- Mostrar proyección final: Activar y desactivar el cuadro de la zona de negociación
- Margen Proyección Final: Tamaño del recuadro
Ajustes de entrada para cada línea de probabilidad
Cada línea de probabilidad puede activarse y desactivarse según sus preferencias. Dispone de la misma configuración para nueve líneas.
- Utilice la Línea 1: Puede activar y desactivar la línea
- Probabilidad de la Línea 1: esta entrada sólo está activa cuando se fija el indicador para el Modo de Configuración de Probabilidad
- Puntuación Z de la línea 1: esta entrada sólo está activa cuando se establece el indicador para el modo de configuración de puntuación Z.
- Probabilidad Línea 1 Color: Color de la línea
- Anchura Línea Probabilidad 1: Anchura de la línea
- Probabilidad Línea 1 Estilo: Estilo de la línea
Atajo de teclado
Pulsar Teclado D: Redibujar el indicador de Volatilidad de su gráfico.
Elección del marco temporal
Cuando la sesión de Perfil de Mercado Diario está activada, no puede utilizar los marcos temporales H4, D1, W1 y MN.
Nota Importante
Este es un producto "off the shelf". Por lo tanto, no aceptamos ninguna solicitud de modificación o personalización de este producto. Además, no proporcionamos ninguna biblioteca de códigos ni soporte para la codificación de este producto.


This Fibo Volatility is really a hidden gem, try it and you know how accurate price reacted to the zone, Author is reaally a Genius very talented developer and very helpful responsive to customer query and supportive with video tutorial, best buy for 2023!