Mean Reversion Supply Demand MT5
- Indicadores
-
Young Ho Seo
 Harmonic Pattern Indicator - Repainting + Japanese Candlestick Pattern Scanner + Automatic Channel + Many more
https://www.mql5.com/en/market/product/4488 - Versión: 5.8
- Actualizado: 5 noviembre 2020
- Activaciones: 5
Indicador de Reversión Media Oferta Demanda
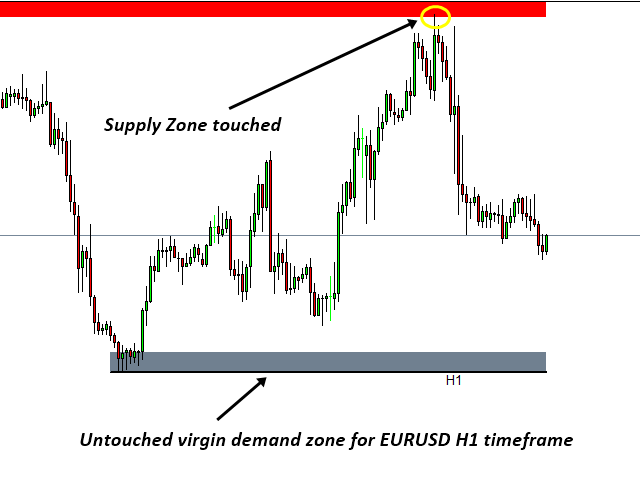
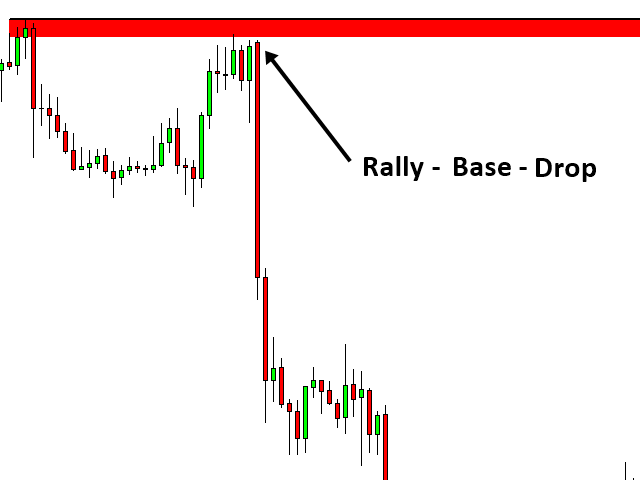
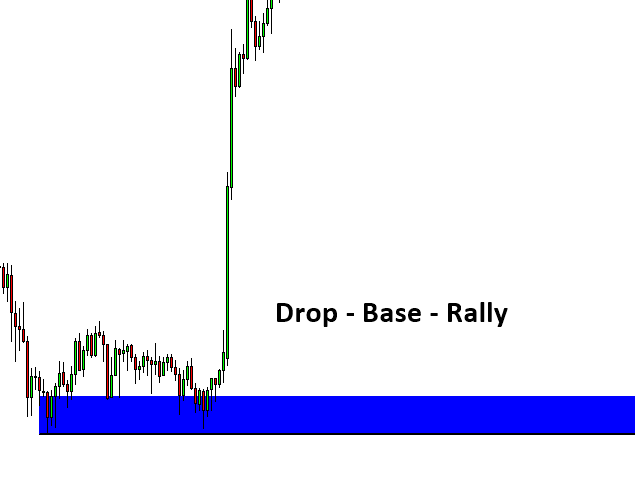
Mean Reversion Supply Demand es el indicador para detectar la zona importante de oferta y demanda en su gráfico. El concepto de negociación de oferta y demanda se basa en el desajuste cuantitativo entre los volúmenes de compra y venta en el mercado financiero. Normalmente, la zona de oferta y demanda sirve para predecir el punto de inflexión. El patrón de onda, para que cualquier zona de oferta y demanda funcione como una operación exitosa, parece que el precio debe tocar la zona base, alejarse y luego volver a la zona de nuevo. En este punto, nuestra operación será colocada y el precio necesitará alejarse de la zona nuevamente para obtener ganancias. Para el éxito de las operaciones de oferta y demanda, el movimiento en zigzag del precio es esencial. Este tipo de movimiento en zigzag es también la típica reversión media o característica de onda fractal.
Características de la reversión a la media de la oferta y la demanda
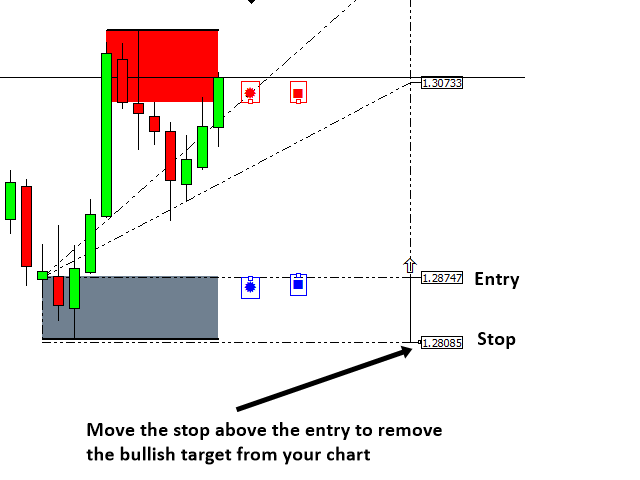
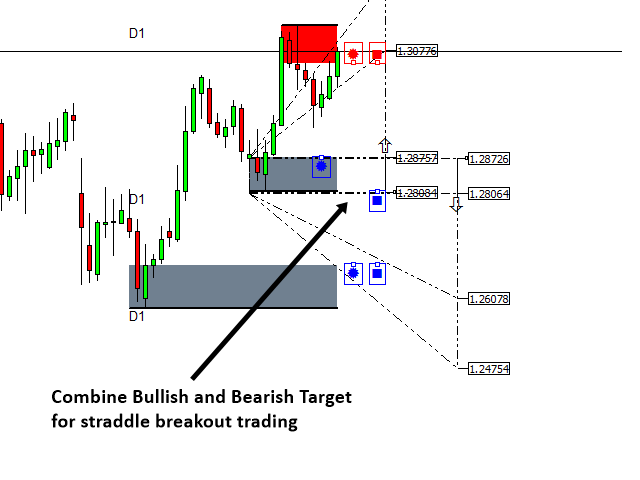
- Detección automática de objetivos de beneficios y stop loss para cualquier zona de oferta y demanda
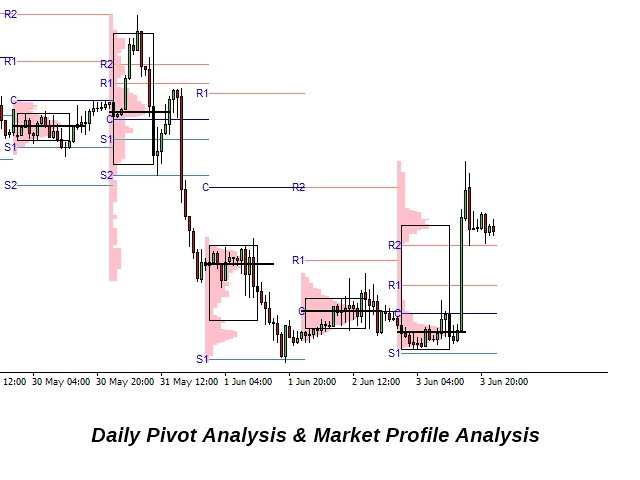
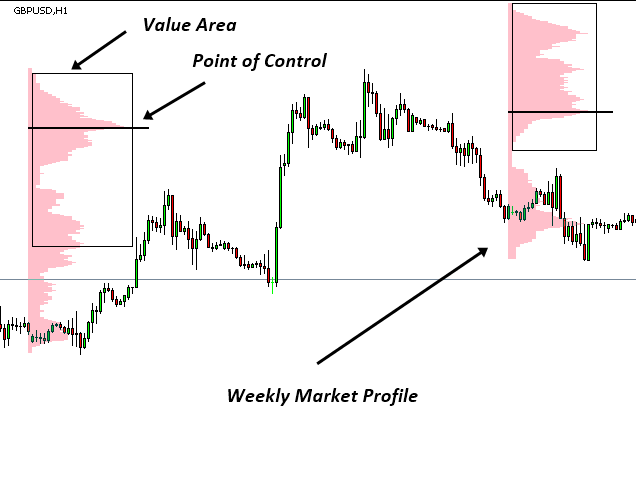
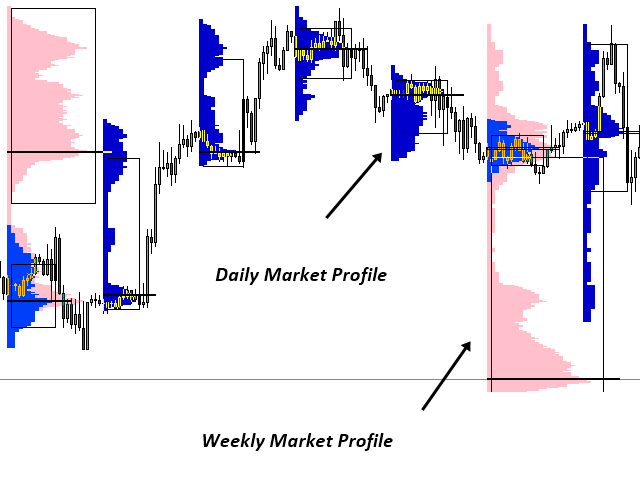
- Análisis diario, semanal y mensual del perfil del mercado para calibrar mejor las características de reversión a la media del mercado (se incluye el cálculo del área de valor y del punto de control).
- Análisis de pivote diario, semanal y mensual para mejorar el análisis de reversión a la media.
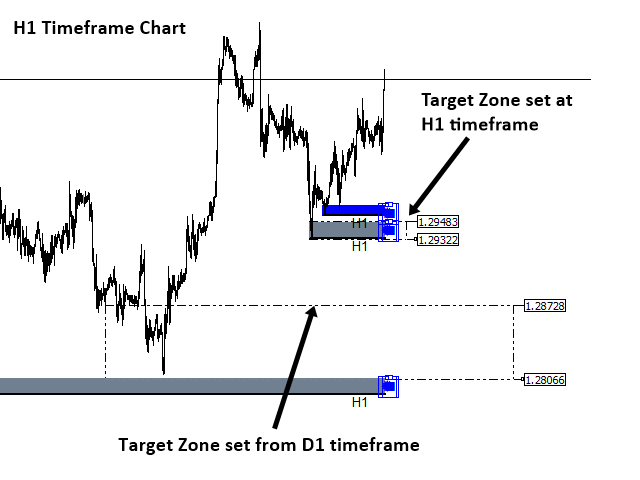
- Capacidad para realizar análisis de múltiples marcos temporales en el mismo gráfico. (Es posible el uso simultáneo de zonas de oferta y demanda horarias, cuatrimestrales y diarias).
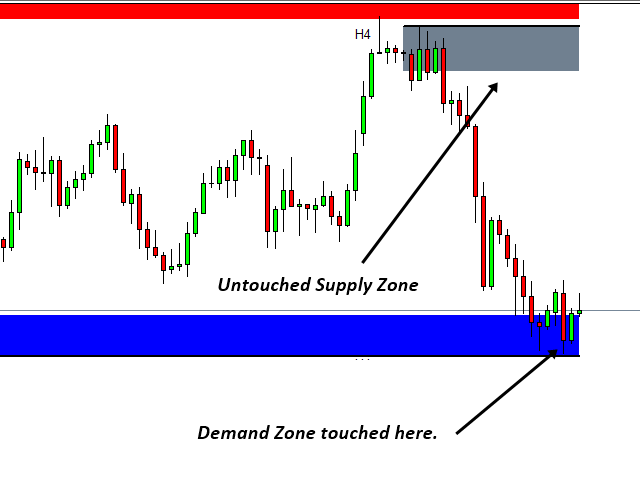
- Detección automática de retoques en cada zona de oferta y demanda. (Fácil de identificar qué zona es virgen y cuáles no).
- Sonido, Email, notificación Push es posible cuando cualquier zona de demanda de suministro es tocada o sólo para la zona seleccionada (modo recomendado).
Cómo utilizar Mean Reversion Oferta Demanda
Nuestra herramienta ofrece un Perfil de Mercado diario, semanal y mensual para medir las probabilidades de reversión a la media del mercado. Para construir el perfil de mercado, el marco temporal para el gráfico debe ser cuidadosamente elegido para el cálculo adecuado del Perfil de Mercado. Normalmente es importante reconocer el movimiento del precio fuera del área de valor. El perfil de mercado diario puede ofrecerle una oportunidad de reversión a la media a corto plazo en comparación con el semanal y el mensual.
- Perfil de Mercado Diario: Pueden utilizarse los marcos temporales M5 a H1. Se recomienda M30.
- Perfil de mercado semanal: Se pueden utilizar los marcos temporales M30 a H4. Se recomienda H1.
- Perfil de mercado mensual: Pueden utilizarse los marcos temporales H1 a D1. Se recomienda H4.
Además del análisis de perfil de mercado, también puede añadir análisis de pivote diario, semanal y mensual para mejorar su precisión. Para detectar una zona válida de oferta y demanda, recomendamos utilizar dos o tres marcos temporales al mismo tiempo en un gráfico para detectar una zona válida. Por ejemplo, puede abrir un gráfico por hora y aplicar nuestro análisis de reversión media de la oferta y la demanda para detectar una zona de oferta y demanda por hora y 4 horas en el mismo gráfico. La zona de oferta y demanda confirmada en múltiples marcos temporales normalmente ofrece mejores probabilidades para sus operaciones. Cuando haya encontrado una buena zona de oferta y demanda para operar, haga clic en el recuadro de la zona de oferta o demanda para ver la configuración de su operación, incluido el objetivo de beneficios y el nivel de stop loss (totalmente automático).
Guía de estrategias de negociación
Una buena guía de estrategia para operar con la oferta y la demanda se puede encontrar en el Análisis Técnico en Forex y en el Mercado de Valores (Análisis de la Oferta y la Demanda y Soporte y Resistencia, 2021). Además, también puede utilizar el libro: Science Of Support, Resistance, Fibonacci Analysis, Harmonic Pattern, Elliott Wave and X3 Chart Pattern (In Forex and Stock Market Trading, 2021) para encontrar la explicación del soporte y la resistencia, así como otros análisis técnicos avanzados. Por favor, visite el siguiente enlace para obtener más detalles acerca de la guía de estrategia de negociación con la oferta y la demanda de la zona de comercio.
Guía de la zona de oferta y demanda: https: //www.mql5.com/en/blogs/post/750386
Entradas
- Usar zona de oferta y demanda: use esta opción para activar o desactivar la detección de zonas de oferta y demanda.
- Plazo para el cálculo: Configure esto como marco temporal para el análisis de múltiples marcos temporales
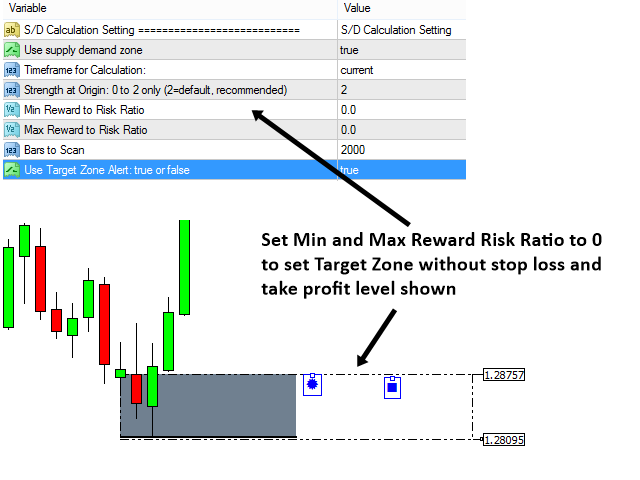
- Fuerza en origen: sólo de 0 a 10
- Barras a escanear: cantidad de barras a computar para el cálculo de la oferta y la demanda
- Max Reward to Risk Ratio: Su recompensa/riesgo máximo preferido
- Ratio de riesgo mínimo: Su recompensa/riesgo mínimo preferido
Nota Importante
Este es un producto estándar. Por lo tanto, no aceptamos ninguna solicitud de modificación o personalización de este producto. Además, no proporcionamos ninguna biblioteca de código o cualquier soporte para su codificación para este producto.

I would like to put a great review for Mr. Young and his work, but I just cant do this for this indicator. I have had it over two years and it just does not do well with the Forex pairs that I trade. I realize Mr. Young puts a lot of thought into what he reads and designs, but Supply/Demand, support resistance, harmonics and trends do not work on assets that are manipulated by the Brokers. In other words, this indicator may work well on assets that are in harmony with technical analysis, but when man interferes with TA, it does not work as it should. It is very possible this indicator would work better on Stocks and Futures, but with Forex having no centralized pricing, it does not do well on them. At least for me and what I trade. -------------------
Many of his indicators ask you to add additional indicators in order to help support the one, but nobody can do this when the additional run 98, 100, 100 and 200 dollars a pop. I have had two years to master this indicator.
He says; "Additionally, you can use following products to yield excellent trading performance, too. However, adding these tools are optional. You must do so only after you are familiar with Precision Support Resistance tool.
Harmonic Pattern Plus MT5
Harmonic Pattern Scenario Planner MT5
Price breakout Pattern Scanner MT5
Sideways Market Statistical Analyzer MT5