Young Ho Seo / Vendedor
Productos publicados

Elliott Wave Trend fue diseñado para el conteo científico de ondas. Esta herramienta se centra en deshacerse de la vaguedad de la clásica Elliott Wave Counting utilizando la pauta de la plantilla y el enfoque patrón. Para ello, en primer lugar, Elliott Wave Trend ofrece la plantilla para el recuento de ondas. En segundo lugar, ofrece la puntuación estructural de la onda para ayudar a identificar la formación de la onda precisa. Ofrece tanto la puntuación estructural de la onda impulsiva como la

Peak Trough Analysis es una gran herramienta para detectar picos y valles en su gráfico. La herramienta Peak Trough Analysis puede utilizar tres algoritmos diferentes de detección de picos y valles. Los tres algoritmos incluyen el Indicador de Fractales original de Bill Williams, el Indicador de Fractales Modificado y el Indicador ZigZag. Puede utilizar esta herramienta de análisis de picos y valles para detectar el patrón de precios formado por el proceso de ondas fractales de equilibrio. Para
FREE

Introducción a Fractal Pattern Scanner El indicador fractal se refiere al indicador técnico que hace uso de la geometría fractal que se encuentra en el mercado financiero. Fractal Pattern Scanner es un indicador fractal avanzado que incorpora la última tecnología de negociación tras un exhaustivo trabajo de investigación y desarrollo de la geometría fractal en el mercado financiero. La característica más importante de Fractal Pattern Scanner es la capacidad de medir la probabilidad de punto de

Elliott Wave Trend fue diseñado para el conteo científico de ondas. Esta herramienta se centra en deshacerse de la vaguedad de la clásica Elliott Wave Counting utilizando la pauta de la plantilla y el enfoque patrón. Para ello, en primer lugar, Elliott Wave Trend ofrece la plantilla para el recuento de ondas. En segundo lugar, ofrece la puntuación estructural de la onda para ayudar a identificar la formación de la onda precisa. Ofrece tanto la puntuación estructural de la onda impulsiva como la

Introducción a Fractal Pattern Scanner El indicador fractal se refiere al indicador técnico que hace uso de la geometría fractal que se encuentra en el mercado financiero. Fractal Pattern Scanner es un indicador fractal avanzado que incorpora la última tecnología de negociación tras un exhaustivo trabajo de investigación y desarrollo de la geometría fractal en el mercado financiero. La característica más importante de Fractal Pattern Scanner es la capacidad de medir la probabilidad de punto de i

Introducción Este indicador detecta patrones de dispersión de volumen para oportunidades de compra y venta. Los patrones incluyen patrones de demanda y de oferta. Puede utilizar cada patrón para operar. Sin embargo, estos patrones se utilizan mejor para detectar la zona de demanda (=zona de acumulación) y la zona de oferta (=zona de distribución). La pauta de demanda indica, por lo general, una posible oportunidad de compra. El patrón de oferta indica, por lo general, una posible oportunidad de
FREE

Peak Trough Analysis es una gran herramienta para detectar picos y valles en su gráfico. La herramienta Peak Trough Analysis puede utilizar tres algoritmos diferentes de detección de picos y valles. Los tres algoritmos incluyen el Indicador de Fractales original de Bill Williams, el Indicador de Fractales Modificado y el Indicador ZigZag. Puede utilizar esta herramienta de análisis de picos y valles para detectar el patrón de precios formado por el proceso de ondas fractales de equilibrio. Para
FREE

Introducción
Auto Chart Alert es una práctica herramienta para establecer alertas para sus operaciones en su gráfico. Con Auto Chart Alert, puede establecer la línea de alerta en el lugar que desee del gráfico con un solo clic. Incluso puede establecer alertas sobre las líneas inclinadas de su gráfico. Auto Chart Alert es una gran herramienta cuando tiene que vigilar niveles de soporte y resistencia importantes para su operativa. Puede recibir una alerta sonora, un correo electrónico y una noti
FREE

Introducción al indicador de volatilidad de Fibonacci El indicador de volatilidad puede ayudarle a detectar cualquier ventaja estadística para sus operaciones. Especialmente, si usted está operando con la acción del precio y los patrones de precios, entonces le recomendamos que utilice el indicador de volatilidad junto con su estrategia. Especialmente, el indicador de volatilidad de Fibonacci combina la volatilidad del mercado con el análisis de Fibonacci para proporcionarle un indicador de vola

Introducción Los patrones armónicos se utilizan para predecir posibles puntos de inflexión. Tradicionalmente, los patrones armónicos se identificaban manualmente conectando puntos máximos y mínimos en el gráfico. La detección manual de patrones armónicos es dolorosamente tediosa y no es adecuada para todo el mundo. A menudo se está expuesto a la identificación subjetiva de patrones con la detección manual de patrones. Para evitar estas limitaciones, Harmonic Pattern Plus ha sido diseñado para au

Introducción al indicador de caja de tiempo Time Box Indicator es un indicador imprescindible para cualquier operador. Mostrará un cuadro diario, semanal y mensual de acuerdo a sus preferencias. Sin embargo, puede extender cualquier nivel de precios importantes en su gráfico de forma automática. Puede utilizarlos como niveles de soporte y resistencia significativos. Es una herramienta muy simple pero efectiva para sus operaciones.
Configuración gráfica Usar Gráfico Blanco Estilo de línea para e
FREE

Introducción Este indicador detecta patrones de dispersión de volumen para oportunidades de compra y venta. Los patrones incluyen patrones de demanda y oferta. Puede utilizar cada patrón para operar. Sin embargo, estos patrones se utilizan mejor para detectar la zona de demanda (=zona de acumulación) y la zona de oferta (=zona de distribución). La pauta de demanda indica, por lo general, una posible oportunidad de compra. El patrón de oferta indica, por lo general, una posible oportunidad de ven

Introducción al X3 Chart Pattern Scanner X3 Cherart Pattern Scanner es el indicador no repintado y no rezagado que detecta patrones de gráficos X3, incluyendo patrones armónicos, patrones de ondas de Elliott, patrones X3 y patrones de velas japonesas. Los patrones históricos coinciden con los patrones de señal. Por lo tanto, usted puede desarrollar fácilmente la estrategia de negociación sólida en su gráfico. Y lo que es más importante, este magnífico escáner de patrones puede detectar el patrón

Introducción al indicador de caja de tiempo Time Box Indicator es un indicador imprescindible para cualquier operador. Mostrará un cuadro diario, semanal y mensual de acuerdo a sus preferencias. Sin embargo, puede extender cualquier nivel de precios importantes en su gráfico de forma automática. Puede utilizarlos como niveles de soporte y resistencia significativos. Es una herramienta muy simple pero efectiva para sus operaciones.
Configuración gráfica Usar Gráfico Blanco Estilo de línea para e
FREE

Introducción a la media móvil fractal El indicador Media Móvil Fractal fue diseñado como parte de Fractal Pattern Scanner. Dentro de Fractal Pattern Scanner, el Indicador de Media Móvil Fractal fue implementado como múltiples objetos gráficos. Con más de miles de objetos gráficos, encontramos que no era la mejor y eficiente manera de operar el indicador. Era demasiado pesado computacionalmente para el indicador. Por lo tanto, decidimos implementar la versión del indicador de la Media Móvil Fract
FREE

Introducción Los patrones armónicos se utilizan para predecir posibles puntos de inflexión. Tradicionalmente, los patrones armónicos se identificaban manualmente conectando los puntos máximos y mínimos del gráfico. La detección manual de patrones armónicos es dolorosamente tediosa y no es adecuada para todo el mundo. A menudo se está expuesto a la identificación subjetiva de patrones con la detección manual de patrones. Para evitar estas limitaciones, Harmonic Pattern Plus ha sido diseñado para

Introducción Este indicador detecta patrones de dispersión de volumen para oportunidades de compra y venta. Los patrones incluyen patrones de demanda y oferta. Puede utilizar cada patrón para operar. Sin embargo, estos patrones se utilizan mejor para detectar la zona de demanda (=zona de acumulación) y la zona de oferta (=zona de distribución). La pauta de demanda indica, por lo general, una posible oportunidad de compra. El patrón de oferta indica, por lo general, una posible oportunidad de ven
FREE

Introducción
Auto Chart Alert es una práctica herramienta para establecer alertas para sus operaciones en su gráfico. Con Auto Chart Alert, puede establecer la línea de alerta en el lugar que desee del gráfico con un solo clic. Incluso puede establecer alertas sobre las líneas inclinadas de su gráfico. Auto Chart Alert es una gran herramienta cuando tiene que vigilar importantes niveles de soporte y resistencia para sus operaciones. Puede recibir una alerta sonora, un correo electrónico y una n
FREE

Introducción a la media móvil fractal El indicador Media Móvil Fractal fue diseñado como parte de Fractal Pattern Scanner. Dentro de Fractal Pattern Scanner, el Indicador de Media Móvil Fractal fue implementado como múltiples objetos gráficos. Con más de miles de objetos gráficos, encontramos que no era la mejor y eficiente manera de operar el indicador. Era demasiado pesado computacionalmente para el indicador. Por lo tanto, decidimos implementar la versión del indicador de la Media Móvil Frac
FREE

Cómo utilizar Pair Trading Station La Estación de Operaciones de Pares se recomienda para el marco temporal H1 y puede utilizarla para cualquier par de divisas. Para generar señales de compra y venta, siga los siguientes pasos para aplicar la Estación de Comercio de Pares a su terminal MetaTrader. Cuando cargue la Estación de Comercio de Pares en su gráfico, la Estación de Comercio de Pares evaluará los datos históricos disponibles en sus plataformas MetaTrader para cada par de divisas. En su gr

Introducción al Planificador de Escenarios de Patrones Armónicos
El estado actual del mercado Forex puede pasar por muchos caminos de precios posibles diferentes para llegar a su destino futuro. El futuro es dinámico. Por lo tanto, la planificación de su comercio con el posible escenario futuro es un paso importante para su éxito. Para cumplir con un concepto tan poderoso, presentamos el Planificador de Escenarios de Patrones Armónicos, la primera herramienta predictiva de patrones armónicos en

Introducción a la Gestión del Riesgo de Pedidos EA ORM EA está especialmente diseñado para la ejecución rápida y precisa de órdenes de mercado para ser utilizado con nuestra Acción del Precio y Estrategias de Trading Econométrico que se enumeran a continuación. ORM EA es totalmente automático y ORM EA es también muy fácil de usar. ORM EA es totalmente gratuito. También puede utilizar esta robusta función de ejecución de órdenes de este ORM EA para cualquier otra estrategia de trading propia.
Gu
FREE

Introducción al indicador GARCH GARCH es la abreviatura de Generalized Autoregressive Conditional Heteroskedasticity (heteroscedasticidad condicional autorregresiva generalizada) y es el modelo de predicción de la volatilidad más utilizado en el sector financiero. El modelo GARCH apareció por primera vez en la obra del economista danés Tim Peter Bollerslev en 1986. El ganador del Premio Nobel 2003, Robert F. Engle, también contribuyó en gran medida al perfeccionamiento del modelo GARCH con el tr
FREE

Introducción El Indicador de Momento Excesivo es un indicador de momento para medir el momento excesivo directamente de las series de precios en bruto. El Indicador de Momento Excesivo fue desarrollado originalmente por Young Ho Seo. Este indicador demuestra el concepto de Onda Fractal de Equilibrio y Aplicación Práctica al mismo tiempo. El Momento Excesivo detecta las anomalías del mercado y nos da muchas pistas sobre posibles oportunidades de reversión y ruptura. La gran ventaja del Momento Ex

Introducción al indicador GARCH GARCH es la abreviatura de Generalized Autoregressive Conditional Heteroskedasticity (heteroscedasticidad condicional autorregresiva generalizada) y es el modelo de predicción de la volatilidad más utilizado en el sector financiero. El modelo GARCH apareció por primera vez en la obra del economista danés Tim Peter Bollerslev en 1986. El ganador del Premio Nobel 2003, Robert F. Engle, también contribuyó en gran medida al perfeccionamiento del modelo GARCH con el tr
FREE

Introducción a la Gestión del Riesgo de Pedidos EA ORM EA está especialmente diseñado para la ejecución rápida y precisa de órdenes de mercado para ser utilizado con nuestra Acción del Precio y Estrategias de Trading Econométrico que se enumeran a continuación. ORM EA es totalmente automático y ORM EA es también muy fácil de usar. ORM EA es totalmente gratuito. También puede utilizar esta robusta función de ejecución de órdenes de este ORM EA para cualquier otra estrategia de trading propia.
Gu
FREE

Price Breakout pattern Scanner es el escáner automático para operadores e inversores. Puede detectar patrones siguientes automáticamente de su gráfico. Cabeza y Hombro - Patrón común negociable. Reverse Head and Shoulder - Este patrón es la formación inversa de la cabeza y el hombro. Doble techo - Cuando el precio alcanza el nivel de resistencia dos veces y declina hacia el nivel de soporte, el operador puede anticipar una ruptura bajista repentina a través del nivel de soporte. Doble Fondo - El

Introducción al analizador de mercados laterales Un periodo notable de baja volatilidad y movimientos sin tendencia en el mercado financiero se considera un mercado lateral. Tarde o temprano, la baja volatilidad aumentará y el precio retomará una tendencia después del mercado lateral. Desde el punto de vista de las operaciones, el mercado lateral puede ser un buen momento de entrada para los operadores. El mercado lateral es también a menudo la representación de la acumulación de grandes órdenes

Introducción al Planificador de Escenarios de Patrones Armónicos
El estado actual del mercado Forex puede pasar por muchos caminos posibles de precios diferentes para llegar a su destino futuro. El futuro es dinámico. Por lo tanto, la planificación de su comercio con el posible escenario futuro es un paso importante para su éxito. Para cumplir con un concepto tan poderoso, presentamos el Planificador de Escenarios de Patrones Armónicos, la primera herramienta predictiva de patrones armónicos e

Introducción a Smart Renko Las principales características de los gráficos Renko se refieren al movimiento del precio. Para darle una idea de su principio de funcionamiento, el gráfico Renko se construye colocando un ladrillo por encima o por debajo cuando el precio hace el movimiento más allá de un rango predefinido, llamado altura del ladrillo. Por lo tanto, naturalmente se puede ver claramente el movimiento del precio con menos ruido que otros tipos de gráficos. El gráfico Renko puede proporc
Introducción al indicador de soporte y resistencia El soporte y la resistencia son los niveles de precios importantes a tener en cuenta durante el mercado intradía. Estos niveles de precios a menudo se prueban antes del desarrollo de una nueva tendencia o a menudo detienen la tendencia existente causando un cambio de tendencia en este punto. Un soporte y una resistencia muy precisos son indispensables para los operadores experimentados. Muchas estrategias típicas de trading, como la ruptura o la

Este innovador indicador técnico fue creado para detectar el periodo de mercado tranquilo antes del comienzo del mercado de alta volatilidad. Como muchos buenos indicadores técnicos, este Índice de Actividad del Mercado es muy estable y es ampliamente aplicable a muchos instrumentos financieros y no financieros sin demasiadas restricciones. El Índice de Actividad del Mercado se puede utilizar mejor para visualizar la forma alternante de mercado de baja y alta volatilidad. Es una herramienta muy

Indicador de Reversión Media Oferta Demanda Mean Reversion Supply Demand es el indicador para detectar la zona importante de oferta y demanda en su gráfico. El concepto de negociación de oferta y demanda se basa en el desajuste cuantitativo entre los volúmenes de compra y venta en el mercado financiero. Normalmente, la zona de oferta y demanda sirve para predecir el punto de inflexión. El patrón de onda, para que cualquier zona de oferta y demanda funcione como una operación exitosa, parece que
Introducción al indicador de punto de inflexión Las trayectorias del movimiento del mercado financiero se parecen mucho a las curvaturas polinómicas con la presencia de fluctuaciones aleatorias. Es bastante común leer que los científicos pueden descomponer los datos financieros en muchos componentes cíclicos diferentes. Si el mercado financiero posee al menos un ciclo, entonces el punto de inflexión debe estar presente en los datos del mercado financiero. Con esta suposición, la mayoría de los d

Introducción al Order Risk Panel Pro EA Order Risk Panel Pro EA es la versión profesional del sencillo Order Risk Management EA. El EA Order Risk Panel Pro incorpora tres potentes funciones en una. Las tres potentes funciones incluyen la gestión visual de operaciones y riesgos, el indicador de línea de volatilidad armónica y el panel de estadísticas de operaciones. Para todas estas tres características, se obtiene el precio de uno. En primer lugar, Order Risk Panel Pro proporciona la función de
Introducción al indicador de volatilidad de doble armónico El uso del análisis de Fibonacci para el trading financiero puede remontarse casi a 85 años desde el nacimiento de la Teoría de las Ondas de Elliott por R. N. Elliott. Hasta ahora, los operadores utilizan el análisis de Fibonacci para identificar los patrones en las series de precios. Sin embargo, no pudimos encontrar ningún intento de utilizar el análisis de Fibonacci para la Volatilidad. El indicador de volatilidad armónica fue el prim

Introducción a EFW Analytics EFW Analytics se diseñó para cumplir la afirmación "Operamos porque existen regularidades en el mercado financiero". EFW Analytics es un conjunto de herramientas diseñadas para maximizar el rendimiento de sus operaciones mediante la captura de la geometría fractal repetitiva, conocida como la quinta regularidad del mercado financiero. La funcionalidad de EFW Analytics consta de tres partes. En primer lugar, Equilibrium Fractal Wave Index es una herramienta explorator

EFW Pattern Trader es un potente escáner de patrones para operar en Forex y Bolsa. La detección de patrones en EFW Pattern Trader utiliza la Teoría de la Onda Fractal, que captura el interminable movimiento ascendente y descendente del mercado. Por lo tanto, EFW Pattern Trader puede ser considerado como un robusto indicador de la acción del precio. Cualquier patrón en EFW Pattern Trader puede ser backtested visualmente en su probador de estrategia. El backtesting visual con el patrón le mostrará

Introducción al indicador de volatilidad armónica El indicador de volatilidad armónica es el primer análisis técnico que aplica el análisis de Fibonacci a la volatilidad financiera. El indicador de volatilidad armónica es otro nivel de la herramienta de negociación de la acción del precio, que combina sólidos ratios de Fibonacci (0,618, 0,382, etc.) con la volatilidad. Originalmente, el indicador de volatilidad armónica se desarrolló para superar la limitación y la debilidad del ángulo de Gann,

Introducción El Indicador de Momento Excesivo es un indicador de momento para medir el momento excesivo directamente de las series de precios en bruto. El Indicador de Momento Excesivo fue desarrollado originalmente por Young Ho Seo. Este indicador demuestra el concepto de Onda Fractal de Equilibrio y Aplicación Práctica al mismo tiempo. El Momento Excesivo detecta las anomalías del mercado y nos da muchas pistas sobre posibles oportunidades de reversión y ruptura. La gran ventaja del Momento Ex

Indicador Ace de la zona de oferta y demanda El concepto de oferta y demanda se basa en el desajuste cuantitativo entre los volúmenes de compra y venta en el mercado financiero. La zona de oferta y demanda puede proporcionar una buena entrada y salida. Una zona es más fácil de operar que una línea. La zona de oferta y demanda puede proporcionar el plan de negociación detallado y la gestión de riesgos. Su capacidad para predecir la dirección del mercado es alta. Hay dos puntos distintivos sobre A

Introducción al indicador de volatilidad de Fibonacci El indicador de volatilidad puede ayudarle a detectar cualquier ventaja estadística para sus operaciones. Especialmente, si usted está operando con la acción del precio y los patrones de precios, entonces le recomendamos que utilice el indicador de volatilidad junto con su estrategia. Especialmente, el indicador de volatilidad de Fibonacci combina la volatilidad del mercado con el análisis de Fibonacci para proporcionarle un indicador de vola
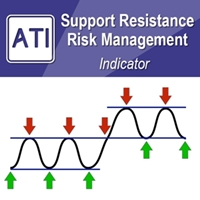
Introducción a la gestión del riesgo de resistencia al soporte El soporte-resistencia es el análisis técnico en el que más se confía. Sin embargo, la gestión del riesgo para el soporte y la resistencia no se practica a menudo. Por lo tanto, proporcionamos un método eficaz de gestión de riesgos para el trader de soporte y resistencia. En el libro: Scientific Guide To Price Action and Pattern Trading (Wisdom of Trend, Cycle, and Fractal Wave), se describe cómo utilizar la Resistencia de Soporte, a

Introducción a Chart Pattern MT Chart Pattern MT es un escáner de patrones gráficos para detectar patrones de triángulo, cuña descendente, cuña ascendente, canal, etc. Chart Pattern MT utiliza un sofisticado algoritmo de detección de patrones gráficos. Sin embargo, lo hemos diseñado con una interfaz de usuario intuitiva y fácil de usar. Chart Pattern MT le mostrará todos los patrones de su gráfico en el formato más eficiente para su operativa. Ya no tendrás que realizar tediosas operaciones manu

Cómo utilizar Pair Trading Station La Estación de Operaciones de Pares se recomienda para el marco temporal H1 y puede utilizarla para cualquier par de divisas. Para generar señales de compra y venta, siga los siguientes pasos para aplicar la Estación de Comercio de Pares a su terminal MetaTrader. Cuando cargue la estación de comercio de pares en su gráfico, la estación de comercio de pares evaluará los datos históricos disponibles en sus plataformas MetaTrader para cada par de divisas. En su gr

Price Breakout pattern Scanner es el escáner automático para operadores e inversores. Puede detectar patrones siguientes automáticamente de su gráfico. Cabeza y Hombro - Patrón común negociable. Reverse Head and Shoulder - Este patrón es la formación inversa de la cabeza y el hombro. Doble techo - Cuando el precio alcanza el nivel de resistencia dos veces y declina hacia el nivel de soporte, el operador puede anticipar una ruptura bajista repentina a través del nivel de soporte. Doble Fondo - El

Introducción al analizador de mercados laterales Un periodo notable de baja volatilidad y movimientos sin tendencia en el mercado financiero se considera un mercado lateral. Tarde o temprano, la baja volatilidad aumentará y el precio retomará una tendencia después del mercado lateral. Desde el punto de vista de las operaciones, el mercado lateral puede ser un buen momento de entrada para los operadores. El mercado lateral es también a menudo la representación de la acumulación de grandes órdenes

Introducción a Smart Renko Las principales características de los gráficos Renko se refieren al movimiento del precio. Para darle una idea de su principio de funcionamiento, el gráfico Renko se construye colocando un ladrillo por encima o por debajo cuando el precio hace el movimiento más allá de un rango predefinido, llamado altura del ladrillo. Por lo tanto, naturalmente se puede ver claramente el movimiento del precio con menos ruido que otros tipos de gráficos. El gráfico Renko puede proporc

Introducción al indicador de soporte y resistencia El soporte y la resistencia son los niveles de precios importantes a tener en cuenta durante el mercado intradiario. Estos niveles de precios a menudo se prueban antes del desarrollo de una nueva tendencia o a menudo detienen la tendencia existente causando un cambio de tendencia en este punto. Un soporte y una resistencia muy precisos son indispensables para los operadores experimentados. Muchas estrategias típicas de trading, como la ruptura o
Este innovador indicador técnico fue creado para detectar el periodo de mercado tranquilo antes del comienzo del mercado de alta volatilidad. Como muchos buenos indicadores técnicos, este Índice de Actividad del Mercado es muy estable y es ampliamente aplicable a muchos instrumentos financieros y no financieros sin demasiadas restricciones. El Índice de Actividad del Mercado se puede utilizar mejor para visualizar la forma alternante de mercado de baja y alta volatilidad. Es una herramienta muy

Indicador de Reversión Media Oferta Demanda Mean Reversion Supply Demand es el indicador para detectar la zona importante de oferta y demanda en su gráfico. El concepto de negociación de oferta y demanda se basa en el desajuste cuantitativo entre los volúmenes de compra y venta en el mercado financiero. Normalmente, la zona de oferta y demanda sirve para predecir el punto de inflexión. El patrón de onda, para que cualquier zona de oferta y demanda funcione como una operación exitosa, parece que

Introducción al indicador de punto de inflexión Las trayectorias del movimiento del mercado financiero se parecen mucho a las curvaturas polinómicas con la presencia de fluctuaciones aleatorias. Es bastante común leer que los científicos pueden descomponer los datos financieros en muchos componentes cíclicos diferentes. Si el mercado financiero posee al menos un ciclo, entonces el punto de inflexión debe estar presente en los datos del mercado financiero. Con esta suposición, la mayoría de los d

Introducción al Order Risk Panel Pro EA Order Risk Panel Pro EA es la versión profesional del sencillo Order Risk Management EA. El EA Order Risk Panel Pro incorpora tres potentes funciones en una. Las tres potentes funciones incluyen la gestión visual de operaciones y riesgos, el indicador de línea de volatilidad armónica y el panel de estadísticas de operaciones. Para todas estas tres características, se obtiene el precio de uno. En primer lugar, Order Risk Panel Pro proporciona la función de

Introducción al indicador de volatilidad de doble armónico El uso del análisis de Fibonacci para el trading financiero puede remontarse casi a 85 años desde el nacimiento de la Teoría de las Ondas de Elliott por R. N. Elliott. Hasta ahora, los operadores utilizan el análisis de Fibonacci para identificar los patrones en las series de precios. Sin embargo, no pudimos encontrar ningún intento de utilizar el análisis de Fibonacci para la Volatilidad. El indicador de volatilidad armónica fue el prim
Introducción a EFW Analytics EFW Analytics se diseñó para cumplir la afirmación "Operamos porque existen regularidades en el mercado financiero". EFW Analytics es un conjunto de herramientas diseñadas para maximizar el rendimiento de sus operaciones mediante la captura de la geometría fractal repetitiva, conocida como la quinta regularidad del mercado financiero. La funcionalidad de EFW Analytics consta de tres partes. En primer lugar, Equilibrium Fractal Wave Index es una herramienta explorator

EFW Pattern Trader es un potente escáner de patrones para operar en Forex y Bolsa. La detección de patrones en EFW Pattern Trader utiliza la Teoría de la Onda Fractal, que captura el interminable movimiento ascendente y descendente del mercado. Por lo tanto, EFW Pattern Trader puede ser considerado como un robusto indicador de la acción del precio. Cualquier patrón en EFW Pattern Trader puede ser backtested visualmente en su probador de estrategia. El backtesting visual con el patrón le mostrará

Introducción al indicador de volatilidad armónica El indicador de volatilidad armónica es el primer análisis técnico que aplica el análisis de Fibonacci a la volatilidad financiera. El indicador de volatilidad armónica es otro nivel de la herramienta de negociación de la acción del precio, que combina sólidos ratios de Fibonacci (0,618, 0,382, etc.) con la volatilidad. Originalmente, el indicador de volatilidad armónica se desarrolló para superar la limitación y la debilidad del ángulo de Gann,

Introducción Este indicador detecta patrones de dispersión de volumen para oportunidades de compra y venta. Los patrones incluyen patrones de demanda y oferta. Puede utilizar cada patrón para operar. Sin embargo, estos patrones se utilizan mejor para detectar la zona de demanda (=zona de acumulación) y la zona de oferta (=zona de distribución). La pauta de demanda indica, por lo general, una posible oportunidad de compra. El patrón de oferta indica, por lo general, una posible oportunidad de ven

Ace Indicador de zona de oferta y demanda El concepto de oferta y demanda se basa en el desajuste cuantitativo entre los volúmenes de compra y venta en el mercado financiero. La zona de oferta y demanda puede proporcionar una buena entrada y salida. Una zona es más fácil de operar que una línea. La zona de oferta y demanda puede proporcionar el plan de negociación detallado y la gestión de riesgos. Su capacidad para predecir la dirección del mercado es alta. Hay dos puntos distintivos sobre Ace

Introducción al X3 Chart Pattern Scanner X3 Cherart Pattern Scanner es el indicador sin repintado y sin retardo que detecta patrones de gráficos X3 incluyendo patrones armónicos, patrones de ondas de Elliott, patrones X3 y patrones de velas japonesas. Los patrones históricos coinciden con los patrones de señal. Por lo tanto, usted puede desarrollar fácilmente la estrategia de negociación sólida en su gráfico. Y lo que es más importante, este magnífico escáner de patrones puede detectar el patrón

Introducción a la gestión del riesgo de resistencia al soporte El soporte-resistencia es el análisis técnico en el que más se confía. Sin embargo, la gestión del riesgo para el soporte y la resistencia no se practica a menudo. Por lo tanto, proporcionamos un método eficaz de gestión de riesgos para el trader de soporte y resistencia. En el libro: Scientific Guide To Price Action and Pattern Trading (Wisdom of Trend, Cycle, and Fractal Wave), se describe cómo utilizar la Resistencia de Soporte, a

Introducción a Chart Pattern MT Chart Pattern MT es un escáner de patrones gráficos para detectar patrones de triángulo, cuña descendente, cuña ascendente, canal, etc. Chart Pattern MT utiliza un sofisticado algoritmo de detección de patrones gráficos. Sin embargo, lo hemos diseñado con una interfaz de usuario intuitiva y fácil de usar. Chart Pattern MT le mostrará todos los patrones de su gráfico en el formato más eficiente para su operativa. Ya no tendrás que realizar tediosas operaciones manu