Doji at Range Extremes

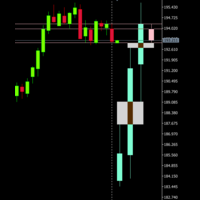
A doji in the middle of nowhere means little. This indicator mainly asks where the candle is, then what price did next.

Candle types
- Doji (body up to 5% of the range), long-legged doji, and spinning top (optional).
- Dragonfly and gravestone dojis (optional). In range mode, a dragonfly counts only at the range low and a gravestone only at the range high.
- Minimum candle size as a multiple of ATR, so tiny candles in quiet hours are ignored.

Location filter (can be switched off)
- The range is the highest high and lowest low of the last 20 candles. It must be at least 2 x ATR wide.
- The candle must be within a tolerance (ATR-based) of one edge.
- That edge must have been reached at least once before, a few candles earlier. A candle at a fresh breakout high is therefore not treated as a range extreme.
- With the filter off, the indicator works as a plain doji-family detector.

Resolution tracking
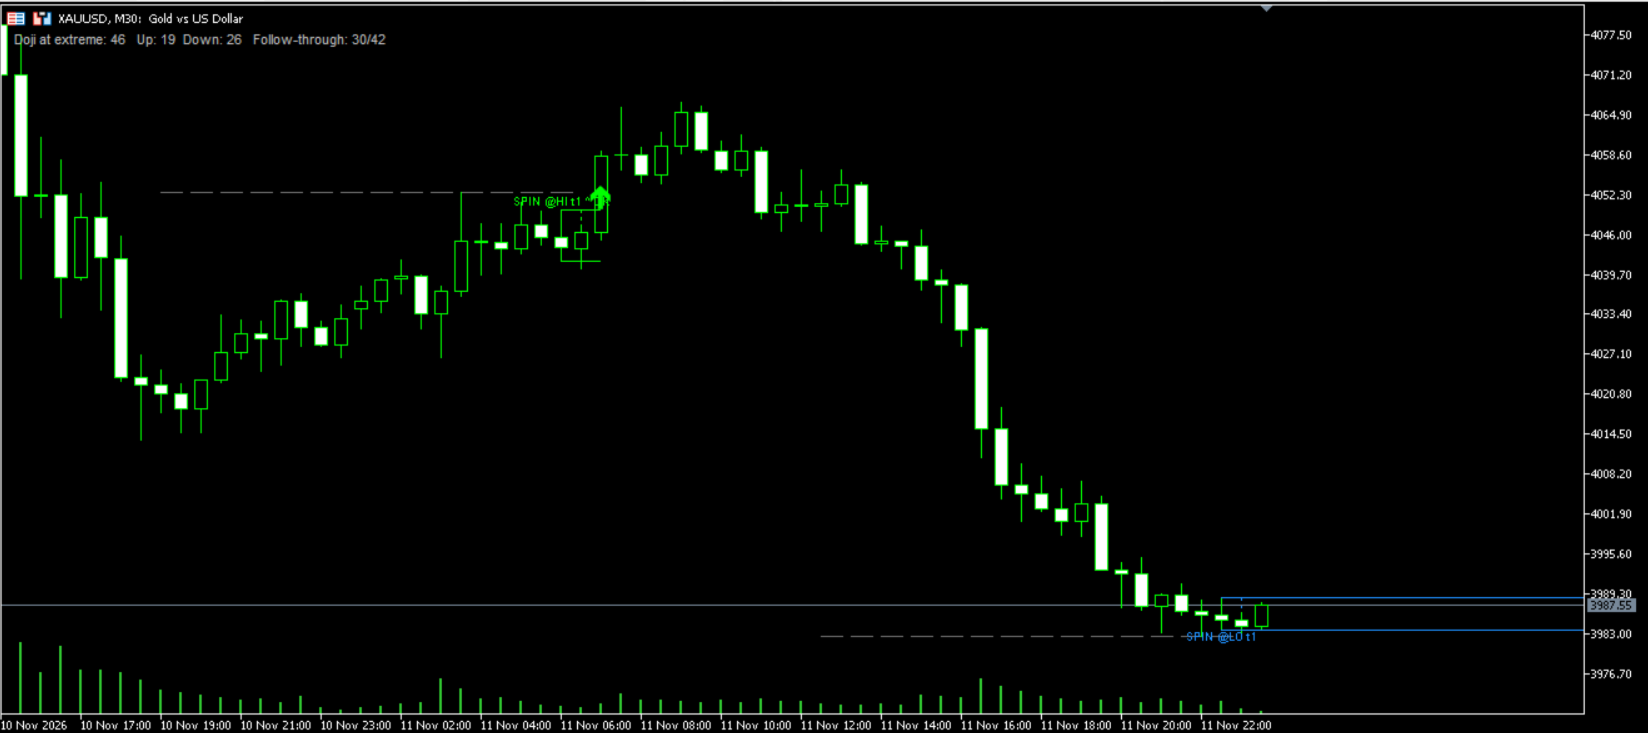
- The first close beyond the candle's own high or low within 5 candles sets the direction.
- The move counts as followed through if it travels 1 x ATR beyond the trigger before closing back through the opposite side of the candle.
- A one-line summary shows the count, up/down resolutions and the follow-through ratio (historical counts on your chart).
- Alerts on new candles and on resolution. Buffers "Doji at high" and "Doji at low" are available to Expert Advisors.

How it calculates
Closed candles only, recalculated once per new candle. A candle's mark does not change after it closes. Resolution and follow-through are added as later candles close.

Forex and gold
All thresholds are ATR multiples, so EURUSD, GBPUSD, USDJPY and XAUUSD work with the defaults. H1 and above give the most meaningful results, especially on gold. Below H1 the summary line shows a note but the indicator still runs.

Inputs
Recommended minimum timeframe and warning, bars scanned, ATR. Candle classification ratios, spinning tops, one-sided dojis, minimum size. Range filter: on/off, lookback, width, tolerance, prior touches, separation. Resolution: window, follow-through distance and window. Display and colours. Alerts.

Notes
- This indicator does not open, modify or close trades. It is an analysis tool and not financial advice. Historical counts do not predict future results.

Questions and suggestions are welcome in the comments section of this product.
Recommended products
Nexus Target Pro Indicator Product Overview Nexus Target Pro is a technical indicator designed for breakout zone analysis. The tool charts a dynamic breakout box based on user-defined time ranges and plots arrow signals when price breaks out of the established zones. Technical Features Signal Generation: Displays non-repainting breakout direction arrows on the chart. Target Levels: Plots up to 5 calculated profit target levels based on the breakout box structure. Risk Levels: Displays a sugges
StretchTurnLevels
Kaustubh Pradeep Deshmukh
Stretch Turn Levels marks turning points on the chart. Instead of arrows, it draws the level that matters for each turn and tints the candles while that turn is still in play. There are no buy or sell calls: it shows the situation, and you decide what to do with it. What you see on the chart Turn level - a line at the extreme of each turn: under an up turn, above a down turn. It runs to the right until a candle closes beyond it, so you can see at a glance whether the turn is still holding. Tinte
An “inside bar” pattern is a two-bar price action trading strategy in which the inside bar is smaller and within the high to low range of the prior bar, i.e. the high is lower than the previous bar’s high, and the low is higher than the previous bar’s low. Its relative position can be at the top, the middle or the bottom of the prior bar. The prior bar, the bar before the inside bar, is often referred to as the “mother bar”. You will sometimes see an inside bar referred to as an “ib” and its m
FREE
The ZigZag Buy Level is a specialized tool for traders who utilize market structure and classic ZigZag patterns to define key support and entry points. It automatically identifies "Main Highs"—significant highs confirmed by the subsequent price action—and then calculates a high-probability "Buy Level" based on a specified percentage pullback from that Main High to the last corrective low. This indicator helps you anticipate deep retracement entries, clearly marking them on the chart with labels
Uncover the true hidden patterns of the market with the PREDATOR AURORA Trading System—the final boss of hybrid trading Indicators. See what others don't! PREDATOR AURORA Trading System a powerhouse designed for those who refuse to cower in the shadows of mediocrity. This isn't just another indicator, it is the cheat code ; it is your unfair advantage , a sophisticated hybrid hunting system that tracks market movements with lethal precision in a jungle where only the strongest survive. Inspir
Time Levels for MT5
Yurij Izyumov
1 (1)
The indicator is designed for displaying the following price levels on the chart: Previous day's high and low. Previous week's high and low. Previous month's high and low. Each of the level types is customizable. In the indicator settings, you set line style, line color, enable or disable separate levels. Configurations ----Day------------------------------------------------- DayLevels   - enable/disable previous day's levels. WidthDayLines   - line width of daily levels. ColorDayLines   - line
FREE
MFOP Market Forecast
Oscar Josue Pin Bacuzoy
Develop this indicator for periods of 30 minutes or more, focus on getting market trends right and making sure they are met. MFOP v8.1 gets straight to the point: it scans the market and tells you exactly when there is enough strength to enter a trade. This indicator doesn't do magic, it uses mathematical algorithms to filter out market noise, not enter into false breakouts and show you clear BUY (blue arrow) and SELL (red arrow) opportunities. It is designed and optimized specifically to take
Pin Bar Color
SMART2TRADER SOLUCOES DE SOFTWARES INTELIGENTES LTDA
Desenvolvido por smart2trader.com Indicador Pin Bar Color detecta e pinta automaticamente padrões de pin bar no gráfico com cores personalizáveis, oferecendo configurações flexíveis para identificação de oportunidades de trading. Além disso, através do nosso indicador Pin Bar , é possível monitorar em tempo real as formações do padrão pin bar , sendo sempre avisado nos ultimos 30 segundos antes do encerramento do candle. Sobre o Padrão Pin Bar O padrão Pin Bar é amplamente utilizado na análise
FREE
Breakout Scanner Pro
Emma-ekong Ben Eshiet
Breakout Scanner Indicator: The Ultimate 4-Candle Harami Breakout Detection System The Market Never Sleeps—But Now Your Scanning Does Imagine having a tireless assistant that watches every single symbol in your Market Watch, across multiple timeframes simultaneously, scanning for one of the most powerful reversal patterns in technical analysis—and delivering the results to you in a clean, actionable dashboard before you've even finished your morning coffee. That's exactly what the Breakout S
TCT SAR PANEL - Parabolic Dashboard SMART TRAILING STOP WITH VISUAL SIGNALS The TCT SAR PANEL monitors the Parabolic SAR—one of the best indicators for trailing stops and trend identification. WHAT YOUR DASHBOARD DISPLAYS Account: Balance, Equity, Profit, Drawdown Positions: Buys, Sells, Total SAR: Position of the dots relative to the price Millipips: Detection, Last Touched, Next
Order Block Breaker Block Zone by RWBTradeLab A strict Order Block, and the Breaker Block that a failed one turns into. Most Order Block indicators mark any candle before a move. This one asks for five things, all mandatory, and shows you the evidence for each — with a full market structure engine built in, so the BOS or CHoCH that confirmed a block is drawn on the chart instead of having to be trusted. All from CLOSED candles only. What Makes an Order Block Here Five things have to happen,
FREE
Functions Analyzes the current market trend Displays a numbering system based on trend structure (see below) Colors the chart background depending on trend direction Displays the ZigZag indicator Display Fibonacci Retracement with custom defined levels at the lates corrective trend movement Display Fibonacci Expansions with custom defined levels at the latest progressive trend movement Buffers for all relevant Trend parameters so EAs can access the trend information Background Information The
Hammer Star
Arkadii Zagorulko
Hammer and Star Bar Formation Indicator for MT5 This powerful MT5 indicator helps traders quickly spot key reversal patterns, including Hammer and Star Bar formations , directly on your charts. With this tool, you can: Identify potential trend reversals as they form. Make well-informed trading decisions. Potentially increase profits by entering trades at optimal points. Customizable Settings Include: Period to find highs/lows : Determines if the bar’s high (for Star) or low (for Hammer) exceeds
FREE
GTI Buy and Sell v1
Rafael Santos Barbosa
One SuperTrend, tuned for patience. Nothing to configure. GTI Buy/Sell marks the bar where the dominant trend turns — and stays quiet the rest of the time. No parameters, no dashboard, no second-guessing. Attach it and read it. What it does A single SuperTrend band built on a 100-period Wilder ATR at 3× width, tracking the median price. That band is deliberately wide. Price has to do something structural to break it, so the indicator ignores the noise that shakes out faster settings. When it fin
FREE
Heikin Ashi Signals - Quick User Guide What It Is A free trend-visualization indicator that transforms standard candles into smooth, noise-filtered Heikin Ashi candles. Perfect for identifying trend direction and reversals at a glance. Key Features Feature Benefit Color-coded candles Green indicates an uptrend, while red indicates a downtrend for quick visual trend recognition. Buy/Sell arrows Automatically displays buy and sell signals when the trend direction changes. Alerts Supports popup, s
FREE
BALOGUN SMC ELITE — Professional Smart Money Concepts Indicator KEY FEATURES: Strict BUY/SELL Alternation — Only 1 BUY followed by 1 SELL (no signal spam) Non-Repainting Signals — Signals confirmed on closed bars only Zone-Limited NO TRADE Markers — Clear visual zones showing when NOT to trade Multi-Factor Confluence Scoring — 0-100% quality score per setup Professional Dashboard — Real-time trend, confluence, and signal status Multi-Channel Alerts — Popup, Push, Email, and S
REW Signal A momentum oscillator for MetaTrader 5 that generates entry signals by detecting crossovers between a Hull Moving Average and a slow weighted MA applied to RSI, with a multi-layer quality filter and a higher-timeframe trend guard. REW Signal is a sub-window indicator for MetaTrader 5. It plots RSI alongside two smoothing layers — a fast Hull Moving Average and a configurable slow MA — and marks buy and sell signals at the moment their crossover conditions are confirmed. The indicator
FREE
VibeFox Squeeze Detector — squeeze compression, momentum and entry points VibeFox Squeeze Detector is a real-time Squeeze Detector indicator for MetaTrader 5. It identifies periods when the market compresses into a tight range and then measures the momentum building beneath the surface, so you can act the moment the market breaks free. The classic squeeze logic and the momentum histogram live in a separate subwindow, while the entry markers land right on the price chart and all controls are gath
Price Action Map MT5
Suvashish Halder
5 (1)
Price Action Map is an advanced trading indicator meticulously designed to provide clear visual insights into market structure by precisely labeling Higher Highs (HH) , Higher Lows (HL) , Lower Highs (LH) , and Lower Lows (LL) . Traders who find it challenging to accurately identify higher highs, lower lows, or understand different market phases will find this tool exceptionally valuable. Price Action Map significantly simplifies the analysis process, enabling traders at all skill levels to conf
TPO Dashboard
Hendra Pri Raditya
TPO Market Profile Levels — Plug & Play by HENDRA PRI RADITYA An on-chart Market Profile (TPO) analysis tool that highlights the most relevant price levels of the current Daily, Weekly and Monthly periods, together with a compact dashboard summarising the current market structure. WHAT IT SHOWS - POC (Point of Control) for the Daily, Weekly and Monthly period. - VAH and VAL (Value Area High / Low) for each period. - A naked POC marker, so a POC that has not yet been revisited stays visible. - Pe
Stop guessing. Start reading the market like a pro. The MBS Indicator is a powerful multi-timeframe trend scoring system designed to give you a clear, data-driven bias using the most trusted tools in trading: EMA • RSI • ATR • Stochastic No more indicator clutter. No more confusion. Just one clean panel that tells you exactly what’s happening. WHAT THIS INDICATOR DOES The MBS Indicator analyzes the market across: D1 (Daily Trend) H4 (Structure Direction) H1 (Entry Momentum) It then combines ev
FREE
【Super Scanner】Indicator Introduction : The color of the Super Scanner which is green and climbing up means that the price trend is going up.The color of the Super Scanner is red and going down means that the price trend is going down. It is very simple to use it to judge the market trend! What's even better is that the open parameters of the indicators allow investors to adjust. You can adjust【Super Scanner】according to your needs. Adjust it faster to be closer to short-term market fluctuatio
Three Candles Pattern
Edson Cavalca Junior
5 (1)
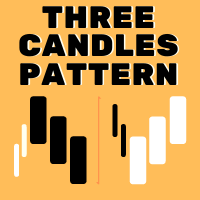
The patterns of 3 (three) Candles: Three White Soldiers; Three Black Crows; These are reversal patterns widely used by traders, as they have a high probability of showing the inversion of the current market movement. For example, if in a bullish trend there are three black crows, there is a high probability of reversing the current bullish movement. The Three White Soldiers have the following characteristics: There are 3 consecutive candles with a good body, that is, the difference between th
CDS SR Fractal Level MT5
CDS FINANSIAL INVESTAMA
5 (1)
CDS SR Fractal Level: Dynamic Fractal Support & Resistance with Breakout Alerts Overview Tired of manually drawing and updating support and resistance lines? The CDS SR Fractal Level  indicator automates this crucial process by intelligently identifying key market levels based on fractals. This lightweight and efficient tool allows you to focus on your trading strategy, not on chart setup, ensuring you never miss an important price level or a potential breakout. This indicator is clean, simple,
FREE
Introduction This indicator detects volume spread patterns for buy and sell opportunity. The patterns include demand and supply patterns. You might use each pattern for trading. However, these patterns are best used to detect the demand zone (=accumulation area) and supply zone (=distribution area). Demand pattern indicates generally potential buying opportunity. Supply pattern indicates generally potential selling opportunity. These are the underlying patterns rather than direct price action. T
If you like this product, please give it a  5 star rating as a token of appreciation. This indicator projects Higher-Timeframe (HTF) candles onto the current chart and optionally shows their OHLC lines and Fair Value Gaps (FVGs) using ICT 3-candle logic. Projects multiple higher timeframe candles. Accurately preserves HTF OHLC on any lower timeframe. Allows spacing adjustment between projected candles. Optionally displays OHLC horizontal reference lines. Automatically detects and draws HTF Fair
FREE
Active Target maps the recent price range, marks a switch zone in the middle of it, and draws two targets beyond the range as soon as price picks a side. A panel on the chart shows how often those targets were actually reached on your symbol and settings. HOW IT WORKS - Range: the highest high and lowest low of the last N candles (default 100; presets "About 1 day" and "About 1 week" use the chart timeframe). - Switch zone: between the 38.2% and 61.8% levels of the range (adjustable). - Up sid
FREE
Product Name: FXmans Pro SMC Structure Description: Navigate the markets with institutional precision. FXmans Pro SMC Structure is an advanced, algorithmically optimized indicator designed to decode Smart Money Concepts (SMC) directly on your chart. Built on a highly secure and lightweight engine, this tool avoids the lag of standard pivot points by utilizing Bill Williams' Fractal logic for laser-accurate market structure mapping. Whether you are a day trader or a swing trader, this indicator f
The Horse Signal
Nirundorn Promphao
The Horse Signal 1.26 – Price Action AI Indicator for Gold & Forex Overview: Start your 2026 trading year with "The Horse Signal," the latest precision tool from the WinWiFi Robot Series. Designed specifically for traders who demand high-accuracy entries, this indicator utilizes advanced Price Action analysis combined with an AI scanning algorithm to identify high-probability reversal and trend continuation points in real-time. Key Features: Dynamic Price Action Scan: Automatically analyzes can
FREE
3 candel indicator in 1 !!! The 3 most important candel indicator in 1 packadge. Help trader in chart visualisation, prevent reversal !!! Doji : Gravestone Doji, Long Legged Doji, Dragonfly Doji. Engulfing : Bullish, Bearish. Hammer : red hammer, green hammer. Fully parametrable indicator icon color config and alarm. Free life time update !!! Just try our demo for free.
Buyers of this product also purchase
Trend Sniper X
Sarvarbek Abduvoxobov
4.86 (44)
Trend Sniper X is a multi-timeframe trend-following indicator for MetaTrader 5 that helps traders identify trend direction and potential reversal points with clarity and precision. for MT4: https://www.mql5.com/en/market/product/193245 Price Information: The current price is promotional and is subject to change as upcoming updates and new features are released. Bonus Offer: To get the FREE Auto-Trade Assistant EA for this indicator, please message the author after purchasing. Code2Profit Channe
A new King in town - Indicator + Order management indications(tp1+tp2+tp3) + Optional Telegram Signal sender   INCLUDED (FREE) + Bonus EA Robot ( FULL TRADING  and SIGNAL SYSTEM ) Our best EA for Gold: Gold Slayer TRY > Reversion Queen  Expert advisor >JOIN Community Channel < NEW Free Automation EA link < click here ( disclaimer: this is new and still on testing and phase , use at your risk on demo) Free Telegram Bridge < click here  This indicator includes an advanced Strategy, a trading sys
Smart Trend Trading System — MetaTrader 5 Message me on MQL5 after purchase to receive Smart Universal Expert Advisor for FREE, plus the online course, PDF manual, and private group access. STTS brings trend direction, entry and exit signals, reversal zones, and important price levels together on your chart. Follow the system manually, or connect a separate compatible EA for automated execution using your chosen settings. ONE SYSTEM. FOUR TRADING APPROACHES. STTS organizes its trading approaches
Zoryk Gold
Reda El Koutbane
4.78 (18)
discount ends SOON next price 69 $ ZORYK — Advanced XAUUSD Signal System for MetaTrader 5 You know the feeling. You spend time analyzing gold. You wait for the entry. You finally open the trade, and price immediately moves against you. You close too early, move the Stop Loss or hesitate for a few seconds. Then the market reaches the exact destination you originally expected without you. The direction was not always the problem. The real problem was uncertainty. You did not know exactly where th
M5 Sniper
MeanFX
5 (4)
Get your trading edge in the line of sight M5 Sniper   is a new indicator by MeanFX. It combines   precise trading signals   with   adaptive TP/SL levels   - creating best possible statistical trades as a result! The price increases every 5 purchases, the next price is 79$ Message me after purchase to receive tips/guide and bonus EA plus trading methodology Auto Optimisation only works on LIVE chart , needs data feed >JOIN Community Channel < What makes it stand out?   Proven statistical per
Entry Points Pro shows you where to enter, where to put the stop and what lot to trade — before you place the order. PRICE Now 199 USD: 10 copies at this price, then 249 USD. The final price is 349 USD. I make my money trading the markets, and I show it, so I don't need to sell this indicator to everyone. It is a tool for traders who think for themselves, not a magic button. The arrow appears when the candle closes and does not repaint. Two settings: your deposit and your risk per trade. Chec
Ultra Indicator
Ihor Otkydach
5 (1)
ULTRA is a technical indicator that operates on an “all-in-one” basis—it independently analyzes the market, generates trading signals, displays levels for setting stop-loss orders, and suggests when to close trades to lock in profits or minimize losses. In other words, it doesn't matter if you don't know how to analyze the market, determine levels—where to set your stop-loss—or struggle with money management. ULTRA will do all of that for you! BUYER BONUS: After purchasing the ULTRA indicator, s
Gann Made Easy   is a professional and easy to use Forex trading system which is based on the best principles of trading using the theory of W.D. Gann. The indicator provides accurate BUY and SELL signals including Stop Loss and Take Profit levels. You can trade even on the go using PUSH notifications. PLEASE CONTACT ME AFTER PURCHASE TO GET TRADING  INSTRUCTIONS   AND GREAT EXTRA INDICATORS  FOR FREE! Probably you already heard about the Gann trading methods before. Usually the Gann theory is a
SuperScalp Pro
Van Minh Nguyen
4.54 (37)
SuperScalp Pro - Professional Multi-Layer Confluence Scalping System SuperScalp Pro is an advanced scalping indicator that upgrades the classic Supertrend with multiple intelligent confirmation filters. It helps you identify higher-probability Buy/Sell opportunities while significantly reducing false signals. Clear Buy and Sell arrows appear directly on the chart, along with automatic ATR-based Stop Loss and Take Profit levels calculated in real time. After purchase, please message me on MQL5 to
GoldenX Entry MT5
VividMind Digital Solutions
5 (17)
Price will increase by $20 every 10 buyers to maintain premium value. After purchase, contact via   MQL5 inbox   to receive your buyer kit and bonus. You have probably tested dozens of indicators before. But we are not here to be “just another signals indicator.” Behind GoldenX Entry is intensive research & development focused on building sophisticated algorithms designed to adapt to the real behavior of every instrument — not generic signals recycled everywhere else. From advanced Auto Optim
Gold Trend Coach MT5
Cristhian Alexander Gaibor Cuasquer
4.27 (11)
Non-repainting buy and sell signals for gold (XAUUSD) on MetaTrader 5. Every signal comes with a stop loss and three take profits. A Smart Money Concepts filter with BOS and CHoCH, so you trade with the structure, not against it. A live Mentor on your panel that guides every step from the entry to TP3. And alerts straight to your phone and your own Telegram channel. That is Gold Trend Coach. Never trade alone again. FREE BUYER KIT with your purchase: 1. Telegram Alert Bridge: your signals go to
SMC Intraday Formula
VividMind Digital Solutions
5 (26)
Secure the Lowest Price Today. After purchase, contact via   MQL5 inbox   to receive your buyer kit and bonus. Let's be honest first. No indicator will make you profitable on its own. If someone tells you otherwise, they're selling you a dream. Every indicator that shows perfect buy/sell arrows can be made to look flawless — just zoom into the right window of history and screenshot the winners. We won't do that. SMC Intraday Formula is a tool. It reads the market structure for you, maps the hig
Boba Analysis Suite
Trade Ready Solutions LLC
5 (2)
Boba Analysis Suite Boba Analysis Suite is an analytical indicator for MetaTrader 5. It brings market structure, relevant price zones and broader market context together in a single chart view. Developed through practical experience as a trader and trading coach, it supports a structured analysis process: assessing market direction, identifying important levels and considering multiple timeframes together. Analysis in Context Individual signals gain meaning through context. Boba Analysis Suite h
Welcome to Entry In The Zone & SMC Multi Timeframe —  COMPLETE SMC ANALYSIS SYSTEM — ALL IN ONE INDICATOR Entry In The Zone & SMC Multi Timeframe  An indicator designed for market analysis based on Smart Money Concepts (SMC), displaying Market Structure, Key Zones (Order Blocks, Supply & Demand Zones, and Fair Value Gaps), Liquidity, and real-time BUY / SELL signals. It supports both Single-Timeframe and Multi-Timeframe analysis, along with the Confluence at Zone feature, which helps you evaluat
FX Power MT5 NG
Daniel Stein
5 (33)
FX Power: Analyze Currency Strength for Smarter Trading Decisions Overview FX Power is your go-to tool for understanding the real strength of currencies and Gold in any market condition. By identifying strong currencies to buy and weak ones to sell, FX Power simplifies trading decisions and uncovers high-probability opportunities. Whether you’re looking to follow trends or anticipate reversals using extreme delta values, this tool adapts seamlessly to your trading style. Don’t just trade—trade
M1 Sniper MT5
Oleg Rodin
5 (7)
M1 SNIPER  is an easy to use trading indicator system. It is an arrow indicator which is designed for M1 time frame. The indicator can be used as a standalone system for scalping on M1 time frame and it can be used as a part of your existing trading system. Though this trading system was designed specifically for short-term trading, it still can be helpful for all traders. This trading system can be used with any forex pair and time frame, though lower time frames are recommended from M1 up to M
FiboSniper Pro
Van Minh Nguyen
5 (4)
FiboSniper Pro - Multi-Filter Fibonacci System with Auto SL/TP and Control Panel FiboSniper Pro is a technical indicator that combines dynamic Fibonacci Envelopes with multiple confirmation filters to generate selective Buy and Sell signals. Fibonacci levels are calculated from Moving Average and ATR, then filtered by ADX, EMA, RSI, ATR, Volume, Time and Candle structure. The indicator displays automatic ATR-based Stop Loss and Take Profit levels directly on the chart, along with an interactive
Auto Optimized SpeedAngle is an institutional-grade momentum vectoring system that eliminates curve-fitting through continuous Walk-Forward Optimization (WFO). Rather than relying on static inputs that degrade when market regimes shift, the indicator dynamically recalibrates its parameters using Out-of-Sample (OOS) validation, ensuring the displayed signals represent genuine statistical edges rather than historical anomalies. By shifting the focus from subjective visual angles to normalized, qua
SQN Max indicator for MT5 by ITC
Renaud Herve Francois Candel
Sqn Max Indicator Sqn Max is an exclusive indicator to trade the market with high effectiveness. The indicator is based on price action, volatility and trend. This indicator is as simple as possible but not too simple. The indicator can generate alerts to ease the trading process. You don't have to stay all day in front of your screen. The indicator can be used with any class of assets and with any time frame. It is possible to achieve better results trading our list of selected assets. We achi
Smc Pro ToolKit
Talal N Z Aljarusha
5 (14)
SMC PRO TOOLKIT — SMART MONEY ANALYSIS & STRUCTURED TRADE PLANNING SMC Pro ToolKit is a professional Smart Money Concepts analysis workspace for MetaTrader 5. It combines market structure, multi-timeframe analysis, institutional price zones, setup evaluation, confirmation tools, volume context, alerts, and risk planning inside one organized chart environment. One workspace. Multiple layers of confirmation. One structured trading plan. OPEN COMPLETE USER GUIDE MULTI-CONDITION SETUP ENGINE At
SIO Oscillator: Self-Optimizing Semivariance Imbalance Oscillator Buy the indicator and get the Expert Advisor based on it for FREE. Most oscillators treat all price movement the same. SIO separates upside and downside market pressure and measures the imbalance between them, showing which side is really in control: buyers or sellers. When the imbalance reaches an extreme, SIO prints a clear signal with entry, Stop Loss and Take Profit levels. What makes SIO different is that it doesn’t rely on f
Power Candles MT5
Daniel Stein
4.58 (12)
Power Candles - Self-Optimizing Strength Indicator Strength usually lives in a sub-window. The line runs below, the candle above, and your eye keeps connecting the two. Power Candles puts the strength into the candle itself, colored from dark red to dark green, so the chart reads at a glance and the sub-window stays closed. The indicator also finds its own settings for the symbol and timeframe in front of you. One click on [ Apply Best ] draws entry, Stop Loss and Take Profit at the exact prices
Atomic Analyst MT5
Issam Kassas
4.51 (65)
Atomic Analyst — MetaTrader 5 Message me on MQL5 after purchase to receive Smart Universal Expert Advisor for FREE, plus the online course, PDF manual, and private group access. Atomic Analyst brings price action, trend direction, entry and exit signals, Stop Loss and multiple Take Profit levels together on your chart. SEE THE SIGNAL. UNDERSTAND THE SETUP. Atomic Analyst organizes its analysis into clear visual information: • Buy and sell arrows to identify potential entries. • Stop Loss and mul
Unix Scalper
Issam Kassas
4 (4)
Unix Scalper — MetaTrader 5 Message me on MQL5 after purchase to receive Smart Universal Expert Advisor for FREE, plus the online course, PDF manual, and private group access. Find the setup. See the plan. Choose how to trade it. UNIX Scalper brings market analysis, BUY/SELL/WAIT decisions and Entry, Stop Loss, TP1 and TP2 levels into one organized panel. SEE THE SIGNAL AND THE PLAN • Clear decisions: BUY, SELL or WAIT. • Defined levels: Entry, Stop Loss, TP1 and TP2. • Multi-timeframe overvie
Tokyo mt5 Indicator
Vasiliy Strukov
5 (15)
Tokyo Indicator provides a clear visual overview of trend direction, potential trading signals, and market conditions. Its colour-coded, stepped trend line distinguishes bullish phases in blue from bearish phases in magenta. Matching directional arrows highlight potential buying and selling opportunities when the displayed trend changes. An integrated dashboard brings together the current signal, market bias, momentum, volatility, and signal quality in one convenient view. This allows traders t
Astral Structure
Ottaviano De Cicco
Astral Structure Assess the setup. See the initial plan. Launch Special - $99. $149 after launch. A structure setup raises several questions at once: does the wider view agree, where is the stop reference, and how are targets defined? Astral Structure brings those questions into one workspace for discretionary traders who build their decisions around market structure. Focus on the relevant setup. Review the latest eligible setup, its direction and qualification together. See the wider agreement.
Crystal Heikin Ashi Signals
Muhammad Jawad Shabir
5 (5)
Crystal Heikin Ashi Signals—Professional Trend & Signal Detection Indicator Advanced Heikin Ashi Visualization with Intelligent Signal System for Manual & Automated Trading Final Price: $149 ---------> Price goes up $10 after every 10 sales . Limited slots available — act fast . Overview User Guide PDF Crystal Heikin Ashi Signals is a professional-grade MetaTrader 5 indicator that combines pure Heikin Ashi candle visualization with an advanced momentum-shift detection system. Designed for both m
Trend Catcher ind mt5
Ramil Minniakhmetov
5 (18)
TREND CATCHER INDICATOR Trend Catcher Indicator analyzes market price movements, using a combination of the author’s proprietary and customized adaptive trend-analysis indicators.  It identifies the true market direction by filtering out short-term noise and focusing on underlying momentum strength, volatility expansion, and price structure behavior.  It also uses a combination of smoothing and trend-filtering customized indicators such as moving averages, RSI, and volatility filters.   Real ope
Multi Currency Strength and Momentum Indicator MT5 Dynamic Forex28 Navigator is the evolution of our long-time, popular indicators, combining the power of five in one: Advanced Currency Strength28 Indicator (700 reviews) Advanced Currency IMPULSE with ALERT (530 reviews) Currency Strength EXOTICS GOLD Impulse with Alert CS28 Combo Signals (recent Bonus) No need to buy four indicators and stack them on your charts. All of it is merged into one powerful indicator: the strength of the 28 Forex pair
Scalper Vault is a powerful, fully-equipped trading system designed for traders who want to achieve consistency in intraday trading . This high-precision indicator serves as a complete, standalone trading system that delivers institutional-grade analysis for both Forex and Binary Options traders. PLEASE CONTACT ME AFTER PURCHASE TO GET MY TRADING TIPS PLUS A GREAT BONUS! By eliminating the guesswork and complex manual analysis, Scalper Vault allows you to focus purely on execution using easy to
More from author
Fibonacci Ribbon and Levels brings the usual Fibonacci tools together on one chart and draws them automatically. EMA ribbon - Up to seven EMAs whose periods are Fibonacci numbers, starting from a chosen index (5-8-13-21-34-55-89 by default). - Choice of applied price. Automatic Fibonacci levels - The latest swing is the highest high and lowest low within a lookback (120 closed candles by default). The leg direction comes from which extreme came first. - Retracement levels 0, 23.6, 38.2, 50, 61.8
FREE
Candlestick Patterns Context labels well-known candle patterns. It also lets you hide the small or out-of-context ones that make most pattern tools noisy. Patterns (each can be switched on or off) - Bullish and bearish engulfing - Hammer and shooting star - Bullish and bearish harami - Piercing line and dark cloud cover - Morning star and evening star - Three white soldiers and three black crows (off by default) - Doji (off by default; labelled with no direction) Filters - Minimum size: the sign
FREE
Session Range and ADR Monitor shows how far price has moved in each trading session and how that compares with what is normal for that session on the symbol you are watching. Many session indicators only shade the session hours. This indicator also measures each session. Every box is labelled with its range in points and a ratio to the average range of the same session over the previous 20 sessions. For example, "London 820 (64%)" means the London session has covered 820 points, which is 64% of
FREE
VWAP Bands and Volume Profile combines two common volume tools in one indicator: an anchored VWAP with deviation bands, and a volume profile with its main levels. What it shows VWAP anchored to a session start time of your choice, the day, the week or the month. Up to three volume-weighted standard-deviation bands (default 1 and 2, with 3 optional), each with its own multiplier. A volume profile of the current VWAP period or of the bars visible on your chart, drawn as horizontal rows. Point of C
FREE
Chart Time Assistant puts three small time helpers in one light indicator. Candle countdown - Time left in the current candle. The format adapts to the timeframe: mm:ss below one hour, h:mm:ss up to a day, and days plus hh:mm on D1, W1 and MN1. - Uses the trade server time, so the countdown keeps moving in quiet markets when no ticks arrive. - Shown in a chosen chart corner, or next to the current price. - Turns a warning colour in the last 10% of the candle. - Optionally shows the current sprea
FREE
SMC Structure and Imbalance Map draws the main Smart Money Concepts elements on your chart from fixed, visible rules, so you can read structure quickly and check exactly why each mark is there. What it shows Swing highs and lows labelled HH, HL, LH and LL. Break of Structure (BOS, dashed line) and Change of Character (CHoCH, solid line) when a candle closes beyond the last swing. Order blocks: for each break, the opposite-colour candle at the origin of the move that broke structure. Fair value g
Killzones and Liquidity Sweeps shows the time windows and price levels that ICT-style traders watch, and marks when price trades through one of those levels and closes back on the other side. What it shows Killzone boxes for Asia (20:00-00:00), London (02:00-05:00), New York AM (07:00-10:00) and optionally London Close (10:00-12:00). Times are in New York local time and can be changed. Previous day high and low (PDH, PDL), previous week high and low (PWH, PWL), and the high and low of the Asia k
Support and Resistance Zones with Touch Count finds price areas where the market has turned more than once and shows how many times each one has been touched. What it shows Zones built from confirmed swing highs and lows. Each new swing either starts a zone or is merged into an existing one nearby. A touch count on each zone (for example "R 4x"): the number of swings that formed inside it. The nearest zones above price (resistance) and below price (support), up to the number you choose, plus any
Session and ADR Scanner shows, for a list of symbols, how far each one has moved today and in each session compared with what is normal for that symbol. What it shows One row per symbol, from Market Watch or your own list (default: the seven forex majors and XAUUSD). ADR: the average daily range over the days you choose (default 14), in pips, points or price. Used: today's range as a percentage of ADR. Daily change in percent. Tokyo, London and New York columns: the latest session range as a per
SMC Entry Models and Liquidity shows where common smart-money setups appear on the chart. It also shows the liquidity they usually target. Our SMC Structure Map shows the whole structure map. This tool shows only the moments a setup completes. Entry models - MSS (market structure shift): the first close beyond the last confirmed swing against the current trend. - Liquidity sweep + break: a wick through a swing high or low that closes back, followed by a structure break in the other direction wit
A structure break on its own is often followed by a pullback. An EMA crossover on its own fires often in ranges. This indicator marks only the candles where both line up within a window you set. Signal sources (choose one or all) - BOS: a close beyond the last confirmed swing in the direction of the current structure. - CHoCH: the first close beyond a swing against the current structure. - Equal highs / lows: two swing highs (or lows) within a tolerance of ATR, with no trading through the level
Session Opening Range measures the first part of each session and follows what price does with it for the rest of the session. What it shows - A box over the opening range of up to three sessions, with high, low and optional midline extended for the session. - The first breakout candle: close or wick beyond the range, with an optional buffer. - T1 and T2 target lines at 1x and 2x the range size (adjustable), and markers when they are reached. - A failed-breakout marker when price closes back thr
Many FVG tools mark every three-candle gap, including the tiny ones that appear in quiet markets. This indicator starts from the candle that caused the gap. A gap is only kept when the middle candle was a real displacement candle: a large body compared with its range, and a range several times ATR. What it shows - Displacement candles outlined, with the ATR multiple printed ("2.1x"). - Bullish and bearish fair value gaps anchored on those candles: a box, an edge line on each side and a dotted 50
Filter:
No reviews
Reply to review