ZigaZaga
- Utilities
- Version: 1.9
- Activations: 8

Ziga-Zaga — Market Structure, Trend Angle and Strength
Market structure as a trader draws it by hand: impulse and correction legs, the angle of every leg in degrees, trend strength, BOS/ChoCH, continuation and reversal levels, and a multi-timeframe panel. Confirmed swings never repaint.
FULL DESCRIPTION
Ziga-Zaga draws market structure the way a trader marks it by hand: highs and lows strictly alternate, every leg runs exactly through the extremes of the move, and minor noise is filtered out. The construction rules were tuned and checked against hand-drawn M5 structure on EURUSD and GBPUSD.
The indicator answers three questions: where the market is going, how strongly, and where the picture changes.
Structure
• The structure level is chosen automatically from the chart timeframe: M1, M5 (on M5–M20), M30, H1, H4, D1, W1, MN.
• The base is higher-timeframe fractals (H1 for M5, W1 for H4, monthly for D1) with swings placed on the real extremes of the lower timeframe; an overly long leg is split at its most significant pullback.
• Weekly and monthly structures follow the lower structure: where D1 goes, W1 goes; where W1 goes, MN goes. A lower-timeframe flat is a higher-timeframe correction, and one higher leg contains several lower legs.
• Thresholds are in ATR, so the structure behaves the same on forex, metals, indices and crypto.
• A leg never skips an extreme: if price goes beyond the start of the leg, that is always a new swing.
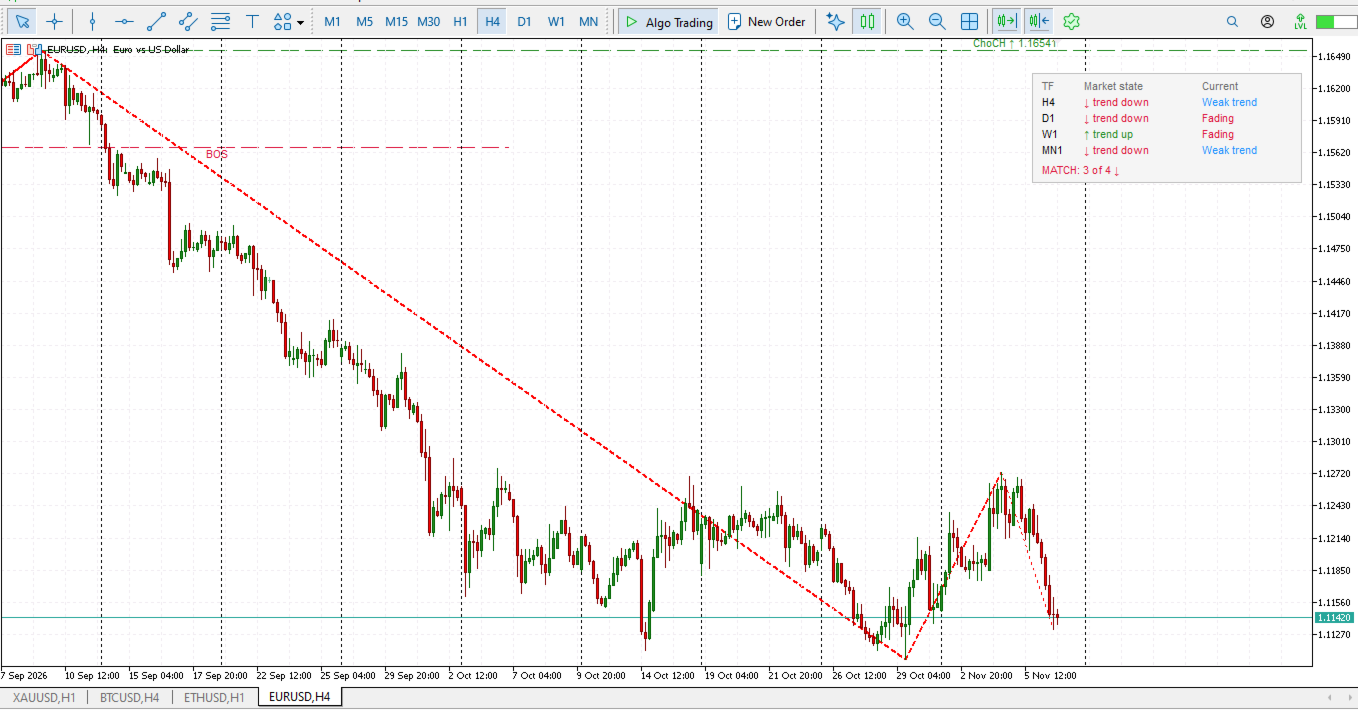
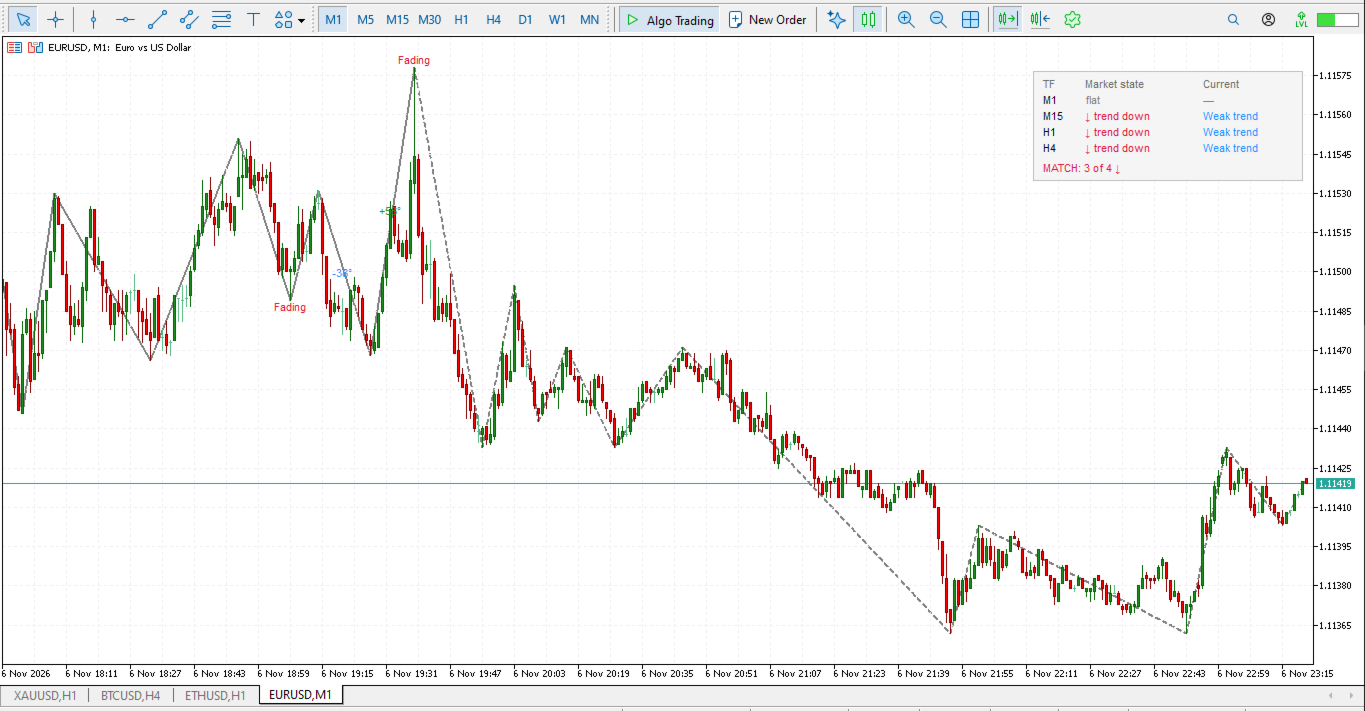
• Confirmed swings never repaint. Until the fractal confirms, the right edge of the structure is drawn dashed directly from the candles, with no waiting; confirmation turns it solid.
• The line color depends on the timeframe, so structures of different levels are never confused.
Angle and trend strength
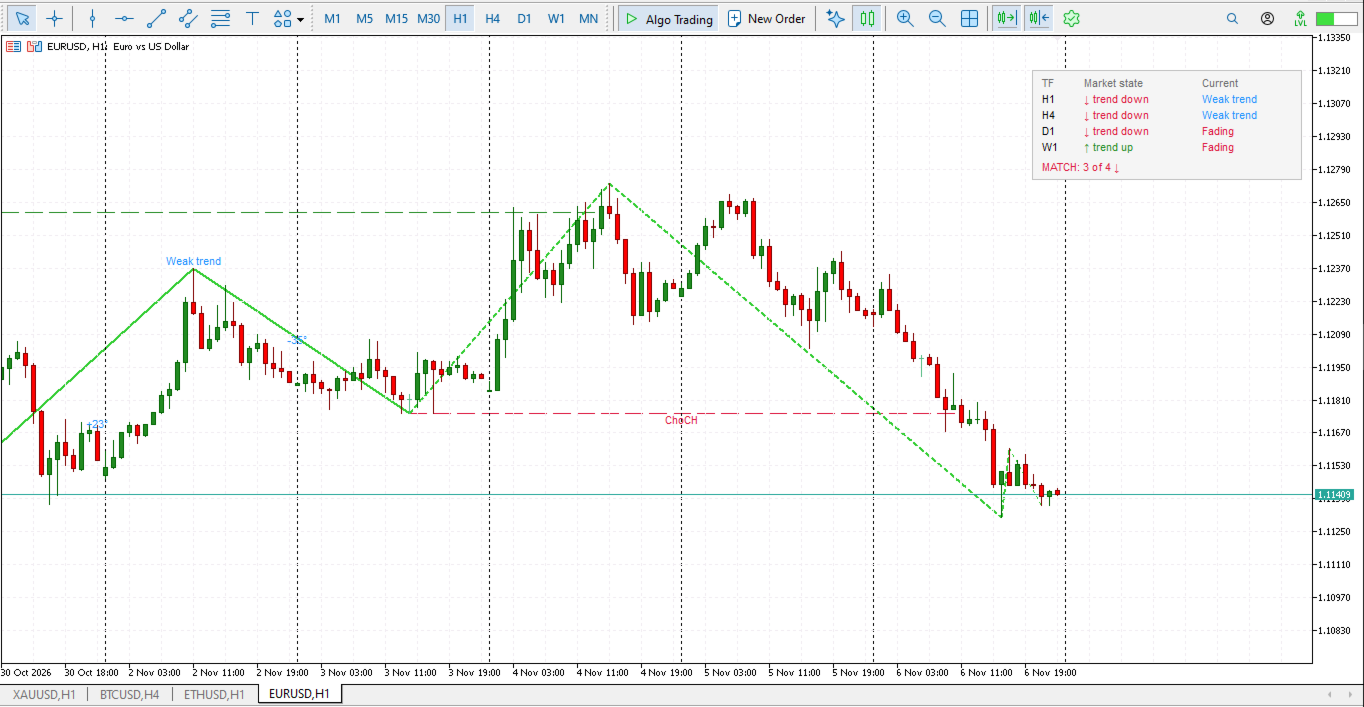
• The angle of every leg in degrees, normalized by ATR, so angles are comparable across symbols and timeframes. Flat / moderate / steep are shown by color.
• Trend strength is evaluated after every correction:
— Strong trend: correction below 38.2% of the impulse;
— Weak trend: deep correction;
— Fading: correction of 100% or more, or an impulse flatter than the previous one.
• Labels are shown only on the last moves (2 by default) to keep the chart clean.
State and breaks
• Trend up / trend down / flat. A flat starts from a correction; a sweep beyond the boundary that returns inside is not an exit.
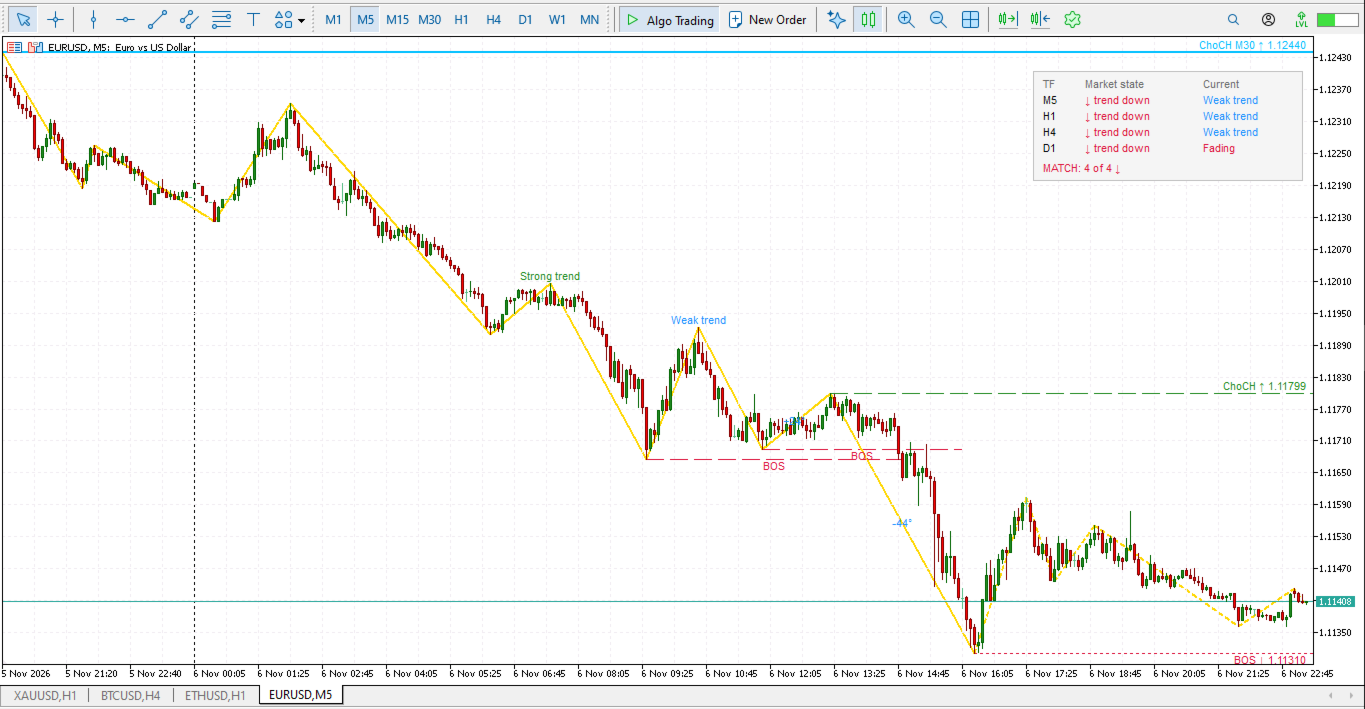
• BOS — break in the direction of the trend (continuation); ChoCH — break against the trend. A ChoCH on a candle close switches the trend immediately.
• Levels projected to the right: where the trend continues (BOS) and where it reverses (ChoCH); in a flat — the flat boundaries.
• Reversal level of the higher structure (for example, on M5 — the level where the M30 trend breaks).
Multi-timeframe panel
• Timeframe / market state / current trend strength for several timeframes.
• The "MATCH: 3 of 4 ↓" row shows timeframe agreement in one number.
• Timeframes are selected automatically (on M5: M5, H1, H4, D1) or set as a list. The panel automatically moves away from labels and buttons of other indicators and Expert Advisors.
Alerts
• Popup, sound, push notification to your phone.
• Events: new trend strength, BOS, ChoCH, higher-structure ChoCH, trend/flat change.
For Expert Advisors
• 7 buffers: angle of the last impulse, angle of the current leg, correction depth, trend strength, state, BOS level, ChoCH level. See the user guide for details.
Interface: English and Russian (follows the terminal language or set manually).
Important
Ziga-Zaga is an analysis tool. It does not open trades and does not guarantee profit. The rightmost, unconfirmed leg may change until price confirms the swing; the history of confirmed swings never changes.