Big Stoch MT4
- Indicators
-
Evgeniy Zhdan
 🚀 Products for MT4 & MT5. Only the best and truly useful tools for traders: https://www.mql5.com/en/users/trendhunter/seller
➖➖➖➖➖➖➖➖➖➖➖➖➖➖➖➖➖➖➖➖➖➖ - Version: 1.0
- Activations: 20
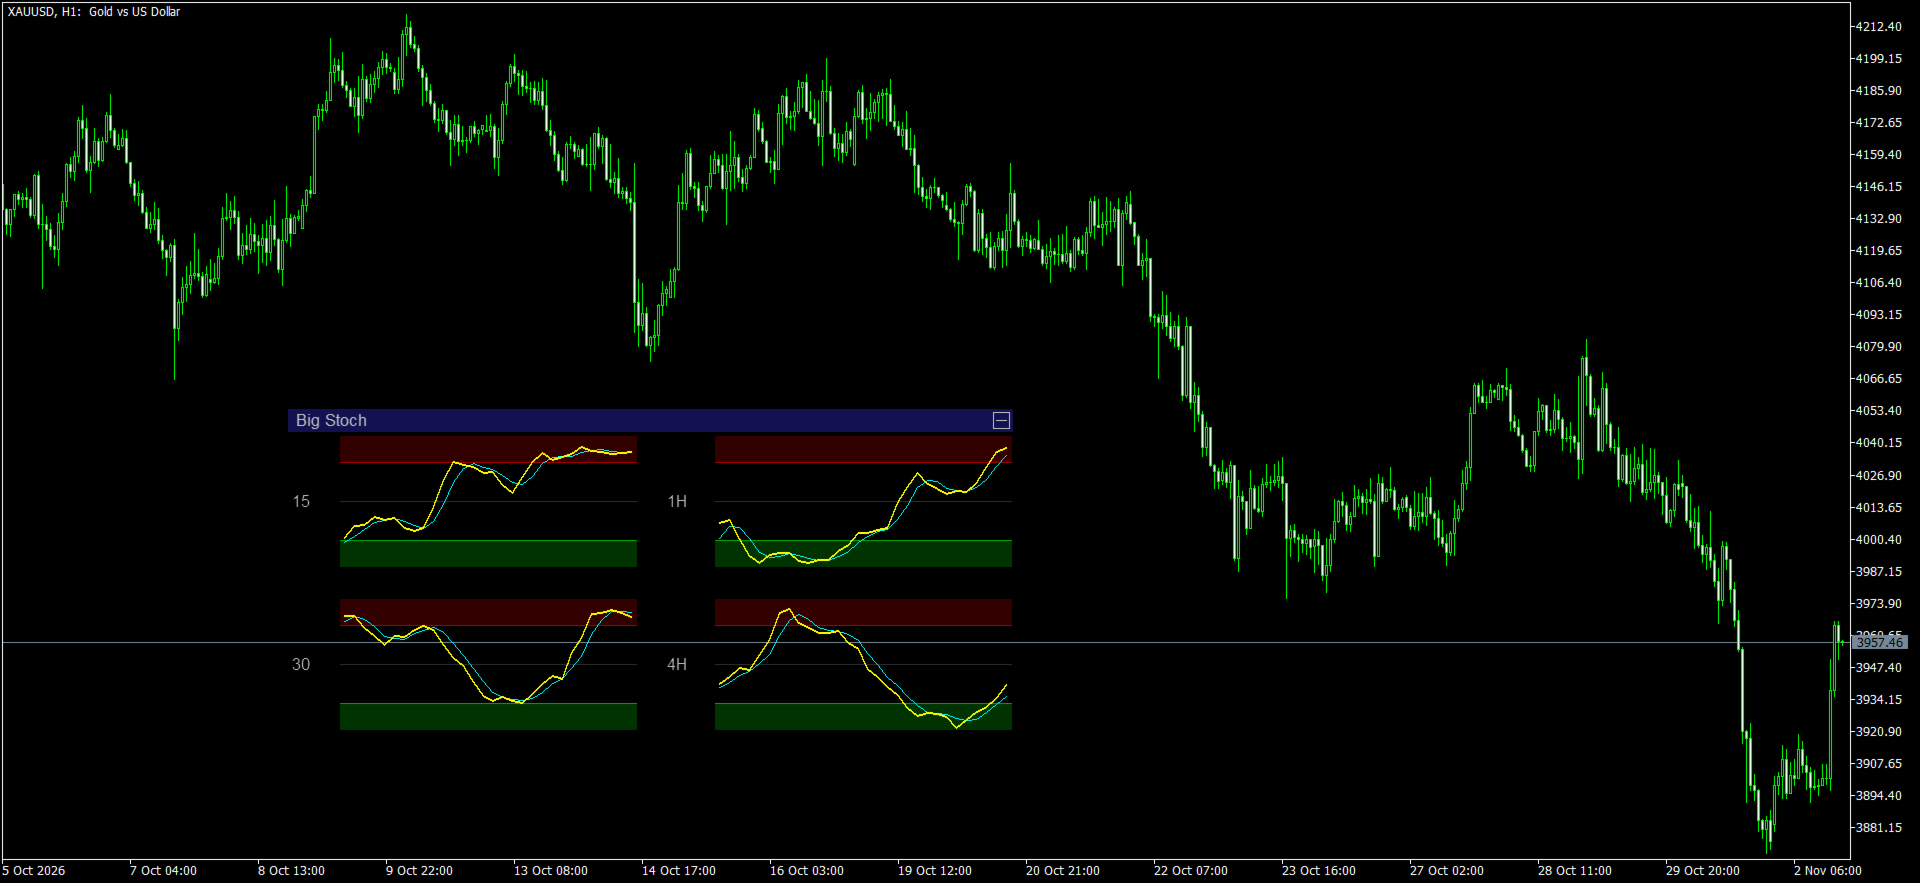
Big Stoch places up to four Stochastic mini-panels directly on the main price chart. Each panel is calculated from the selected timeframe and has its own %K, Slowing and %D parameters. This lets you monitor, for example, M15, M30, H1 and H4 at the same time without switching the main chart. Oscillator values use a 0–100 scale.
MT5-version: https://www.mql5.com/en/market/product/205700
How Traders Can Use It
The indicator is designed to help compare short-term momentum with the broader market context. It displays information; it does not make trading decisions for the trader.
- Higher-timeframe context. Start by checking the H1 or H4 panel to see whether momentum is near the upper, lower or middle part of its range. Then use M15 or M30 to examine shorter-term movement in more detail.
- Line crossovers. %K responds faster, while %D is more heavily smoothed. A %K/%D crossover can suggest a change in short-term momentum. It does not confirm an entry by itself; compare it with the trend, levels and price action.
- Extreme zones. Values above the upper level are commonly described as overbought, while values below the lower level are described as oversold. In a strong trend, the lines may remain in these zones for a long time, so a touch is not automatically a reversal signal.
- Timeframe alignment. If momentum looks similar across several panels, you can check whether the shorter-term move agrees with the higher-timeframe context. Diverging panels show that market momentum differs across time horizons.
What the Panel Shows
Each mini-panel belongs to a separate timeframe. Read the panel as follows:
- Panel title — the timeframe label, such as 15, 30, 1H, 4H, D, W or M.
- %K line — the faster Stochastic line. It represents the close’s position within the high–low range over the %K period, after Slowing smoothing.
- %D line — the signal line calculated by smoothing %K over the %D period. It usually moves more smoothly and reacts later than %K.
- Upper and lower zones — coloured areas shown when overbought/oversold zone display is enabled. The default upper level is 80 and the default lower level is 20. A middle line at 50 is also drawn.
- Candles (optional) — when candle display is enabled, candles from the selected timeframe are also shown. They are normalized to the high–low range of the displayed candles to fit inside the mini-panel; they do not have a separate price scale.
- What is not shown: the indicator does not print current numeric %K or %D readings, scale labels, entry arrows or alerts. Line direction and position must be assessed visually.
Position & size
- Panel size (% of chart width, 0 = auto) — Sets the width of the entire panel block as a percentage of chart width. 0 enables automatic sizing. A non-zero value requests a share of the chart width, subject to layout constraints.
- Initial offset from the right edge — Initial distance in pixels from the chart’s right edge. It is used when no saved position exists for that chart.
- Initial offset from the top — Initial distance in pixels from the chart’s top edge. It is also used for the initial placement.
- Bars per panel — Number of most recent bars shown in each panel. The default is 30; at least 5 bars are used. This controls the visible history, not the Stochastic calculation periods.
Appearance
- Show panel titles — Shows or hides the timeframe labels on the left of the panels.
- Show overbought/oversold zones — Shows or hides the coloured overbought/oversold zones, the upper and lower level lines, and the middle line at 50.
- Overbought level — Upper threshold. Default: 80. Used to draw the upper zone when overbought/oversold zone display is enabled.
- Oversold level — Lower threshold. Default: 20. Used to draw the lower zone when overbought/oversold zone display is enabled.
- Show %K line — Shows or hides the %K line.
- Show %D line — Shows or hides the %D line.
- Show candles in panels — Shows or hides candles from the selected timeframe inside each mini-panel. Disabled by default.
- Candle transparency (%) — Candle transparency in percent: 0 means fully opaque and 100 means fully transparent. Default: 60.
- Bull candle — Colour of bullish candles (close at or above open).
- Bear candle — Colour of bearish candles (close below open).
- %K line color — Colour of the %K line.
- %D line color — Colour of the %D line.
- Overbought zone color — Colour of the zone above the upper threshold — the overbought zone.
- Oversold zone color — Colour of the zone below the lower threshold — the oversold zone.
- Zone transparency (%) — Zone transparency in percent: 0 means fully opaque and 100 means invisible. Default: 80.
- Text color — Colour of timeframe labels and auxiliary lines.
Timeframe 1–4
There are four independent setting groups: Timeframe 1, Timeframe 2, Timeframe 3 and Timeframe 4. Each group controls one panel. Repeated settings use the same labels; the group heading identifies which panel a setting belongs to.
- Show timeframe 1, Show timeframe 2, Show timeframe 3 and Show timeframe 4 — In each group, this control enables or disables the panel identified by that group number.
- Timeframe — The timeframe used to calculate the panel. Select the main chart timeframe to use the same timeframe as the chart.
- %K Period — %K period: the number of bars used to determine the close’s position within the high–low range. Default: 14. A smaller period is more responsive; a larger one generally smooths fluctuations.
- Slowing — Smoothing applied to the raw %K line. Default: 3. Increasing it reduces sharp fluctuations but makes the response slower.
- %D Period — Period of the %D signal line, calculated as an average of smoothed %K values. Default: 3. A larger period generally makes %D smoother and slower.
Default timeframes: Timeframe 1 — M15; Timeframe 2 — M30; Timeframe 3 — H1; Timeframe 4 — H4. All groups start with %K Period = 14, Slowing = 3 and %D Period = 3. These settings affect only the panel in whose group they appear.
Panel Layout and Controls
- With one, two or three panels enabled, they are arranged in a vertical stack. With all four enabled, they are arranged in a 2 × 2 grid.
- When automatic panel sizing is selected, the panel block is sized automatically to fit the chart. The layout is recalculated when the chart window changes size.
- Drag the block by its top bar labelled Big Stoch. The button on the right side of that bar collapses the panels to the title bar or expands them again.
- The position and collapsed state are saved separately for each chart. After you drag the block, it may reopen at the saved position rather than at the initial offset.
Practical Notes
- The current, still-forming bar is included in the calculation. Therefore, the line at the right edge of a panel may change until that bar closes.
- Each panel relies on history for its own timeframe. If the terminal has not loaded the required data yet, the lines may be temporarily absent until the history becomes available.
- The indicator is a visual multi-timeframe comparison tool. It does not open or close trades, send trading alerts or draw ready-made entry arrows.