Big Stoch MT4

Come funziona l’indicatore

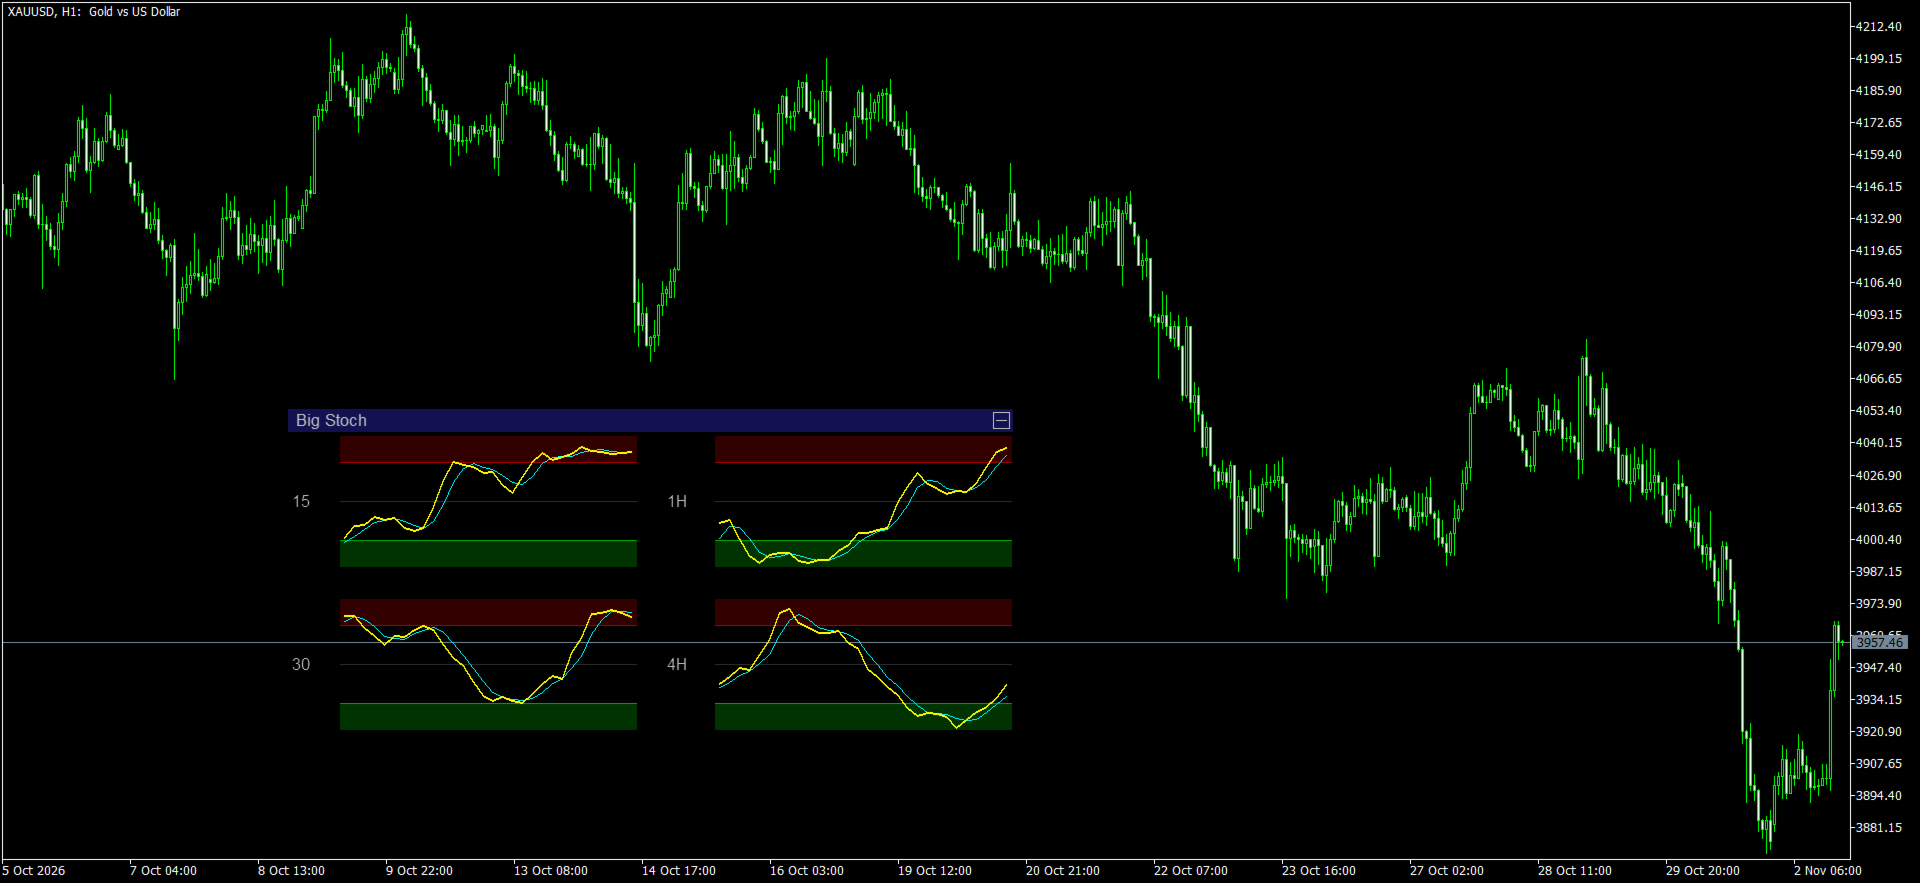
Big Stoch visualizza fino a quattro mini-pannelli dell’oscillatore Stocastico direttamente sul grafico principale dei prezzi. Ogni pannello viene calcolato usando i dati del proprio timeframe e dispone di parametri %K, Slowing e %D indipendenti. È quindi possibile osservare, ad esempio, M15, M30, H1 e H4 nello stesso momento senza cambiare il timeframe del grafico principale. I valori dell’oscillatore vanno da 0 a 100.

Come può usarlo il trader

L’indicatore aiuta a confrontare il momentum di breve periodo con il contesto dei timeframe superiori. Mostra informazioni, ma non prende decisioni operative al posto del trader.

  • Contesto dei timeframe superiori. Iniziate da H1 o H4 per capire se il momentum si trova nella parte alta, bassa o centrale del suo intervallo. Poi usate M15 o M30 per osservare più da vicino il movimento di breve periodo.
  • Incroci delle linee. %K reagisce più rapidamente, mentre %D è maggiormente smussata. Un incrocio tra %K e %D può indicare un cambiamento del momentum a breve termine, ma da solo non conferma un ingresso. Confrontatelo con trend, livelli e andamento del prezzo.
  • Zone estreme. I valori sopra il livello superiore sono spesso definiti ipercomprato, quelli sotto il livello inferiore ipervenduto. In un trend forte le linee possono restare a lungo in queste zone; raggiungerle non significa automaticamente che il mercato invertirà direzione.
  • Allineamento dei timeframe. Se più pannelli mostrano un momentum simile, potete verificare se il movimento di breve periodo è coerente con il quadro dei timeframe superiori. Le differenze indicano che il momentum cambia a seconda dell’orizzonte temporale.

Significato dei dati del pannello

Ogni mini-pannello corrisponde a un timeframe distinto. Gli elementi si leggono così:

  • Titolo del pannello: indica il timeframe, ad esempio 15, 30, 1H, 4H, D, W o M.
  • Linea %K: è la linea più veloce dello Stocastico. Indica la posizione della chiusura nell’intervallo massimo-minimo del periodo %K, dopo lo smussamento Slowing.
  • Linea %D: è la linea di segnale ottenuta smussando %K sul periodo %D. In genere è più regolare e reagisce più lentamente di %K.
  • Zone superiore e inferiore: aree colorate visibili quando è attiva la visualizzazione delle zone di ipercomprato/ipervenduto. Il livello superiore predefinito è 80 e quello inferiore è 20. È presente anche una linea centrale a 50.
  • Candele (opzionale): attivando la visualizzazione delle candele vengono visualizzate anche le candele del timeframe scelto. Sono normalizzate in base all’intervallo massimo-minimo delle candele visibili per adattarsi al mini-pannello; non dispongono di una scala prezzi indipendente.
  • Cosa non viene mostrato: l’indicatore non visualizza i valori numerici correnti di %K e %D, i numeri della scala, frecce di ingresso o avvisi. La posizione e la direzione delle linee vanno valutate visivamente.

Position & size — posizione e dimensioni

  • Panel size (% of chart width, 0 = auto) — Imposta la larghezza dell’intero blocco di pannelli come percentuale della larghezza del grafico. Il valore 0 attiva il dimensionamento automatico. Un valore diverso da zero richiede una determinata proporzione, entro i limiti del layout.
  • Initial offset from the right edge — Distanza iniziale in pixel dal bordo destro del grafico. Viene usata se per quel grafico non è ancora stata salvata una posizione.
  • Initial offset from the top — Distanza iniziale in pixel dal bordo superiore del grafico. Viene usata anche per il posizionamento iniziale.
  • Bars per panel — Numero delle candele più recenti visualizzate in ogni pannello. Il valore predefinito è 30 e vengono usate almeno 5 candele. Definisce la porzione di storico visibile, non i periodi di calcolo dello Stocastico.

Appearance — aspetto

  • Show panel titles — Mostra o nasconde le etichette dei timeframe a sinistra dei pannelli.
  • Show overbought/oversold zones — Mostra o nasconde le zone colorate di ipercomprato/ipervenduto, le linee dei livelli superiore e inferiore e la linea centrale a 50.
  • Overbought level — Soglia superiore. Predefinito: 80. Serve a disegnare la zona superiore quando è attiva la visualizzazione delle zone di ipercomprato/ipervenduto.
  • Oversold level — Soglia inferiore. Predefinito: 20. Serve a disegnare la zona inferiore quando è attiva la visualizzazione delle zone di ipercomprato/ipervenduto.
  • Show %K line — Mostra o nasconde la linea %K.
  • Show %D line — Mostra o nasconde la linea %D.
  • Show candles in panels — Mostra o nasconde le candele del timeframe selezionato all’interno dei mini-pannelli. Disattivato per impostazione predefinita.
  • Candle transparency (%) — Trasparenza delle candele in percentuale: 0 = opache, 100 = completamente trasparenti. Predefinito: 60.
  • Bull candle — Colore delle candele rialziste (chiusura pari o superiore all’apertura).
  • Bear candle — Colore delle candele ribassiste (chiusura inferiore all’apertura).
  • %K line color — Colore della linea %K.
  • %D line color — Colore della linea %D.
  • Overbought zone color — Colore della zona sopra la soglia superiore, cioè la zona di ipercomprato.
  • Oversold zone color — Colore della zona sotto la soglia inferiore, cioè la zona di ipervenduto.
  • Zone transparency (%) — Trasparenza delle zone in percentuale: 0 = opache, 100 = invisibili. Predefinito: 80.
  • Text color — Colore delle etichette dei timeframe e delle linee ausiliarie.

Impostazioni dei timeframe

Sono disponibili quattro gruppi di impostazioni indipendenti: Timeframe 1, Timeframe 2, Timeframe 3 e Timeframe 4. Ogni gruppo controlla un pannello. Le impostazioni ripetute hanno gli stessi nomi; il titolo del gruppo indica a quale pannello si riferiscono.

  • Show timeframe 1, Show timeframe 2, Show timeframe 3 and Show timeframe 4 — In ogni gruppo, questa opzione mostra o nasconde il pannello identificato dal numero del gruppo.
  • Timeframe — Timeframe utilizzato per calcolare il pannello. Seleziona il timeframe del grafico principale per utilizzare lo stesso periodo.
  • %K Period — Periodo %K: numero di candele usato per determinare la posizione della chiusura nell’intervallo massimo-minimo. Predefinito: 14. Un periodo più breve reagisce prima; uno più lungo tende a smussare le oscillazioni.
  • Slowing — Smussamento applicato al %K grezzo. Predefinito: 3. Aumentandolo si riducono le oscillazioni brusche, ma la risposta diventa più lenta.
  • %D Period — Periodo della linea di segnale %D, calcolata come media dei valori smussati di %K. Predefinito: 3. Un valore maggiore tende a rendere %D più regolare e lenta.

Timeframe predefiniti: Timeframe 1 — M15; Timeframe 2 — M30; Timeframe 3 — H1; Timeframe 4 — H4. Tutti i gruppi partono da %K Period = 14, Slowing = 3 e %D Period = 3. Queste impostazioni influiscono solo sul pannello del gruppo in cui compaiono.

Layout e controlli dei pannelli

  • Con uno, due o tre pannelli attivi, questi vengono disposti in colonna. Con tutti e quattro attivi, la disposizione è una griglia 2 × 2.
  • Con il dimensionamento automatico selezionato, il blocco si ridimensiona automaticamente in base all’area del grafico. Il layout viene ricalcolato quando cambia la dimensione della finestra.
  • Trascinate il blocco dalla barra superiore con la scritta Big Stoch. Il pulsante a destra comprime i pannelli lasciando solo la barra del titolo oppure li espande di nuovo.
  • La posizione e lo stato compresso vengono salvati separatamente per ogni grafico. Dopo averlo spostato, il blocco può riapparire nella posizione salvata anziché nell’offset iniziale.

Note pratiche

  • La candela corrente, ancora in formazione, partecipa al calcolo. La linea all’estrema destra può quindi cambiare fino alla chiusura della candela.
  • Ogni pannello richiede lo storico del proprio timeframe. Se il terminale non ha ancora caricato i dati necessari, le linee potrebbero non essere temporaneamente visibili.
  • L’indicatore serve a confrontare visivamente più timeframe. Non apre né chiude operazioni, non invia avvisi di trading e non disegna frecce d’ingresso predefinite.

Altri dall’autore
L'indicatore calcola le aree di arresto/inversione di tendenza più probabili, le aree di movimento di tendenza sicure. Il calcolo considera: il tasso di variazione del prezzo; l'angolo di deviazione relativa del grafico; l'ampiezza media dei movimenti di prezzo; il prezzo che esce dalla sua "zona di comfort"; i valori dell'indicatore ATR. L'indicatore può generare un avviso quando il prezzo entra in un'area di stop/inversione. Impostazioni Disegna l'intera lunghezza? - disegnare le aree fino
Buy and sell zones
Evgeniy Zhdan
5 (2)
L’indicatore mostra in quale stato si trova il mercato in questo momento: trend rialzista, trend ribassista o fase laterale. Lo stato è evidenziato da una zona colorata direttamente sul grafico dei prezzi e riproposto in un pannello informativo. MT5 version:   https://www.mql5.com/en/market/product/70409 Come leggere il grafico Zona turchese — trend rialzista. Zona rossa — trend ribassista. Zona grigio-azzurra — fase laterale. Due linee delimitano la zona. La linea spessa è quella lenta, quella
SuperTrend
Evgeniy Zhdan
2.5 (2)
The Supertrend Expert Advisor The Supertrend Expert Advisor with averaging elements. It has been developed during three months until I finally got good results. It is not a scalper. The minimum balance to start trading - 100 $. Is automatically adjusted to the 4 and 5-digit prices. Has an efficient risk management system. The lot and limit on the maximum lot is automatically calculated based on the settings specified in the EA. As a result, you have a complete automated trading system. Download
Stardust
Evgeniy Zhdan
StarDust searches for divergences in the values of several indicators considering them as signs of flat and enters the market if a relatively steady trend is detected. The Expert Advisor trades "basic" symbols with a low spread. The best results are achieved on М15. The EA automatically adjusts to 4 and 5-digit quote flows. Settings Comment_to_orders – comment to a placed order. The field can be left blank if no comment is required. MM – enable money management with automatic setting of a worki
Top Floor
Evgeniy Zhdan
The EA catches the price when it moves against the trend in an effort to open an order in an opposite direction (direction of the main trend). Screenshots illustrate examples of entries and the strategy gist. The EA uses stop losses depending on values of ATR. Settings: Lot_ - if Risk_ = 0, the EA will trade this lot; Risk_ - risk per one trade. Stop loss is taken into account; koeff_ATR - coefficient multiplied by the ATR value to calculate stop loss (the bigger the value, the bigger stop loss
FastBoom
Evgeniy Zhdan
The FastBoom EA finds the most probable points of price pullback/reverse and places an order. It places averaging orders if the price moves further against take profit. Settings of the EA: Lots - initial lot; LotExponent - multiplier for following orders (Martingale). 1 - no multiplier. TakeProfit - take profit in points; Stochastic Settings InpKPeriod - K Period of Stochastic InpDPeriod - D Period of Stochastic InpSlowing - Stochastic Slowing LevHigh - level for sell positions of Stochastic L
The Expert Advisor calculates the double/triple divergence of volumes, and starts trading. It uses a unique formula of lot calculation, which greatly improves stability of trading. Recommended TF - 1h. Currency pair - EURUSD , but the EA can be used on any trading instruments which are not subject to high volatility. Settings mode - trading direction can be set manually; close - order close level (details on the screenshot); Step between orders - step between orders in points; Maximum orders -
OrderOnLine
Evgeniy Zhdan
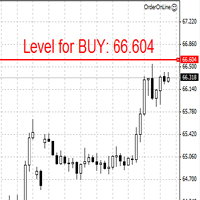
The Expert Advisor opens orders from the horizontal line, the a trader can set on any level by dragging using the mouse or by changing the line properties. For example, when a horizontal line is above the current price, the EA will open a Buy order once the horizontal line is reached. And vice versa: If the line is below the current price, the EA will open a sell order once the line is crossed. A buy crossover of the line is: opening of the current candlestick below the horizontal line; the curr
SellerATR
Evgeniy Zhdan
5 (1)
The Expert Advisor only sells. Recommended currency pairs : EURUSD; GBPUSD; USDCHF; USDJPY; USDCAD; AUDUSD; EURGBP; EURAUD; EURCHF; EURJPY; GBPCHF; CADJPY; GBPJPY; AUDNZD; AUDCAD; AUDCHF; AUDJPY; CHFJPY; EURNZD; EURCAD; CADCHF; NZDJPY; NZDUSD. Timeframe: H1. Percent% manages closing both loss-making and profitable deals based on the account overall status. Using the EA on 23 symbols mentioned above allows the robot to cope with the drawdown in case of a long trend. While positions on some pairs
Illusion
Evgeniy Zhdan
3 (2)
The Illusion EA uses the probability theory - after a series of consecutive virtual losses - i.e. right during a flat the EA already starts trading in the trend. In addition, the EA considers the ratio of bullish/bearish candles on the higher timeframes to determine the greatest probability of the price movement direction. Only 1 order can be opened at a time. In case of a loss the following order will be placed with an increased lot (the multiplication coefficient is set in the parameters). The
The indicator plots a trend line and determines the levels for opening trades, in case the price goes "too far" away from the trend level. More detailed information is available in the screenshots. Settings Away from the trend line - distance from the trend line to the trades level; Arrow Signal for deals - enable displaying an arrow when the price reaches the trades level; Size of Arrow - size of the arrow; Alert Signal for deals - enable generating alerts when the price reaches the trades lev
Turbina
Evgeniy Zhdan
5 (4)
The axiom of the Forex market is that any trend will be broken. The Expert Advisor determines trend direction (the pink line), and calculates levels for opening opposite orders depending on the settings. The value of Away from the trend line for Deal will be different for each pair and timeframe, depending on the volatility of the trading instrument. Next orders can be opened with an increased lot (a static lot is used by default). See the screenshots to understand the idea of the Expert Advisor
Odysseus
Evgeniy Zhdan
The Expert Advisor determines the moments of strong movements and opens a position in the direction of the most probable price movement. The strategy always uses stop loss and take profit. Several independent orders can be in the market (the maximum number is set in parameters). The goal of the EA's underlying trading system is the quantitative excess of the number of profitable deals over the number of losing ones. Recommended: EURUSD 5m; GBPUSD 5m; USDJPY 5m. The Expert Advisor is able to work
Vise
Evgeniy Zhdan
Vise is a trend indicator. The upper and lower lines follow the price showing the prevailing price direction. Frequent breakthroughs of the upper line indicate a bullish trend, while frequent breakthroughs of the lower line indicate a bearish one. Parameters Points for UpLine - initial number of points for the upper line; Points for DownLine - initial number of points for the lower line. During the breakthrough of the upper level (line), this level shifts upwards by Points for UpLine. If the up
Twinkle
Evgeniy Zhdan
Twinkle is a trend-based scalper using stop loss and take profit invisible to the broker. The EA does not look for trend reversals. The EA catches strong market movements and opens orders in the direction of the trend. Your broker will not see the order closing levels. The EA closes orders independently when reaching the take profit or stop loss levels specified in the settings. Recommended trading symbols: EURUSD M5, GBPUSD M5. ECN accounts with 5 digits quotes are recommended. Expert Advisor
Shine
Evgeniy Zhdan
4.75 (4)
This Expert Advisor implements elements of the Martingale system. Orders are opened at a specified distance from the moving average. The Parabolic SAR indicator and certain technical details are used to ensure the most accurate entries. The EA is highly customizable. It is recommended for simultaneous use on 4 currency pairs: EURUSD M15; GBPUSD M15; USDJPY M15; USDCAD M15. Despite good stability, it is advisable to disable the EA operation during the days rich in news releases. Configurations P
LuckyCase
Evgeniy Zhdan
LuckyCase is an Expert Advisor with martingale elements. The EA strategy is based on a significant "deviation" of the price from SAR inadicator and the Bands levels breakthrough point. The money management system is an essential part of the EA. It starts working after a trade is opened. Trades are closed after accumulating specified points of market orders, by deposit % or after an opposite side of the channel is broken through. The default EA settings are meant for: EURUSD M15; USDJPY M15. The
Elize
Evgeniy Zhdan
The Elize Expert Advisor has been designed to work with the EURCHF currency pair. It considers the peculiarities of this trading instrument, its behavior and dependence on the behavior of other currencies. In particular, when the currencies of the European countries (EURUSD, GBPUSD, EURNOK, EURCHF) move in the same direction, the EA starts its operation and opens a deal in the trend direction of the European currencies. In the event of price rollbacks, the EA uses a unique method for making the
AllTrendLines
Evgeniy Zhdan
4 (1)
Brief Description of the All Trend Lines Indicator The indicator analyzes the wave structure of the market. What it displays on the chart: First. Wave pivots (semaphores) • Red markers – wave highs • Yellow markers – wave lows • Yellow-green markers – additional local extremes Second. Trend lines • Purple/blue lines – trends based on highs (resistance/support) • Beige/green lines – trends based on lows • Lines are built automatically by connecting wave pivots of the same type Third. Main trend
FastTraffic
Evgeniy Zhdan
The Expert Advisor has been specifically developed for trading gold (Spot Gold). The strategy is based on Fibo levels calculated from the previous (first) candle High/Low and the width of the current and lower timeframes channel. If important Fibo levels of different orders are located in a single price channel (within a spread), the EA defines this channel as the target for price movement and starts operation. Martingale and averaging are not used. Each order is independent and is accompanied b
Jazz
Evgeniy Zhdan
The algorithm of this Expert Advisor determines the significant price levels, where the trend often turns into a flat or reverses. Stochastic Oscillator serves as an additional filter of overbought/oversold zones. The EA sets stop loss and take profit after opening an order. The underlying trailing strategy applies a trailing stop. The EA is recommended for simultaneously use on three trading instruments: EURUSD M5, GBPUSD M5, EURCHF M5. Settings: Comment to order - comment to orders. MaxRisk -
Panther
Evgeniy Zhdan
The Expert Advisor looks for technical analysis patterns formed on the higher (hourly) timeframe to start working on the 5-minute chart. Technical analysis patterns used: double top/double bottom, head/shoulders, flag, expanding/narrowing triangles. The Relative Vigor Index technical indicator is used as the filter for opening deals. It is based on the idea that on the bull market the closing price is, as a rule, higher, than the opening price. It is the other way round on the bear market. This
Spook
Evgeniy Zhdan
The Expert Advisor calculates the divergence on the current and higher timeframes. In case the divergences coincide, the EA starts its operation. Deals have strict take profit and stop loss levels. Each deal is managed by trailing stop. The strategy involves the use of a tight stop-loss. Therefore, losing deals and/or series of losing deals are not uncommon. This EA is not suitable for those who have difficulties coping with losing deals. The EA is recommended for simultaneous use on the followi
Intensive
Evgeniy Zhdan
The Expert Advisor algorithm determines on daily charts those candlestick patterns, which set the intraday trading direction. The trading EA determines how long the price is moving in overbought/oversold zones and starts working in the direction of the expected trend movement. Each position is accompanied with a tight stop loss and take profit. Only one active position can be open in the market. The EA was developed and tested using 99% quality quotes. The Expert Advisor has a built-in news filt
Slender
Evgeniy Zhdan
The strategy of this Expert Advisor is based on a hedging system, which implies placing opposite orders. The EA algorithm determines trend beginning and opens a position in the trend direction. In case of a wrong entry, the EA tries to neutralize the drawdown through opposite (hedging) orders at a preset interval (Coefficient of counter orders). Orders are closed when one of the two values ​​is reached - profit in percent or profit in points. The EA does not use lot increase. The EA wast tested
Dreamer
Evgeniy Zhdan
Советник работает по принципу хеджирования с периодическими "перекосами" в сторону трендовых направлений. Направления тренда советник определяет на основании стандартного индикатора Parabolic Stop and Reverse system (SAR). Уникальная стратегия установки балансирующих позиций позволяет избегать больших просадок даже при самых не благоприятных рыночных условиях. Параметры по умолчанию рекомендуется использовать на торговом инструменте: GBPJPY 15m. Разработка и оптимизация параметров производились
Snoot
Evgeniy Zhdan
5 (1)
This Expert Advisor works using a grid in the direction of a trend movement with the step between opened positions defined in the settings. The positions are closed by the total take profit. The Parabolic SAR standard indicator is used to filter order opening, which comes in the MetaTrader 4 package. The EA has been developed and tested using 99,9% quality of quotes. Operation of the EA in real time can be viewed in the signals . The best trading results have been achieved on CHFJPY M15. Settin
Solipsism
Evgeniy Zhdan
The Expert Advisor builds channels based on the data obtained using ATR and MA indicators according to the equations: Upper channel border = MA + ATR * (FIBO); Lower channel border = MA - ATR * (FIBO), where FIBO has the following values: Style of Trade - Aggressive = 1.61852; Style of Trade - Average = 3.26704; Style of Trade - Calm = 4.85556. Trades are opened inside the channel with the intervals defined in the settings. Long and short positions are opened independently. Positions are closed
The trading statistics indicator notifies the trader of the aggregate income of the trading account for different time intervals. The indicator has wide display settings on the graph. There is a choice of one of the two display languages on the chart- English and Russian. Settings Indicator language (ENG, RUS) - Select the language to display on the chart; To control the magic (-1: any magic) - Entering the Magic for control (-1: any Magic); Angle of indicator tie - Selecting the angle of the c
Vegor
Evgeniy Zhdan
The advisor works on the basis of a strategy for determining the calm and volatile market conditions, as well as the phases of redistribution of trading activity. In moments of increased volatility, the adviser analyzes similar price behavior (patterns) in the recent past, and if matches are found (the number of matches is configured by the user in the Strategy Accuracy parameter), the advisor decides to start trading. Advisor does not use dangerous trading strategies based on lot increase and
Filtro:
Nessuna recensione
Rispondi alla recensione