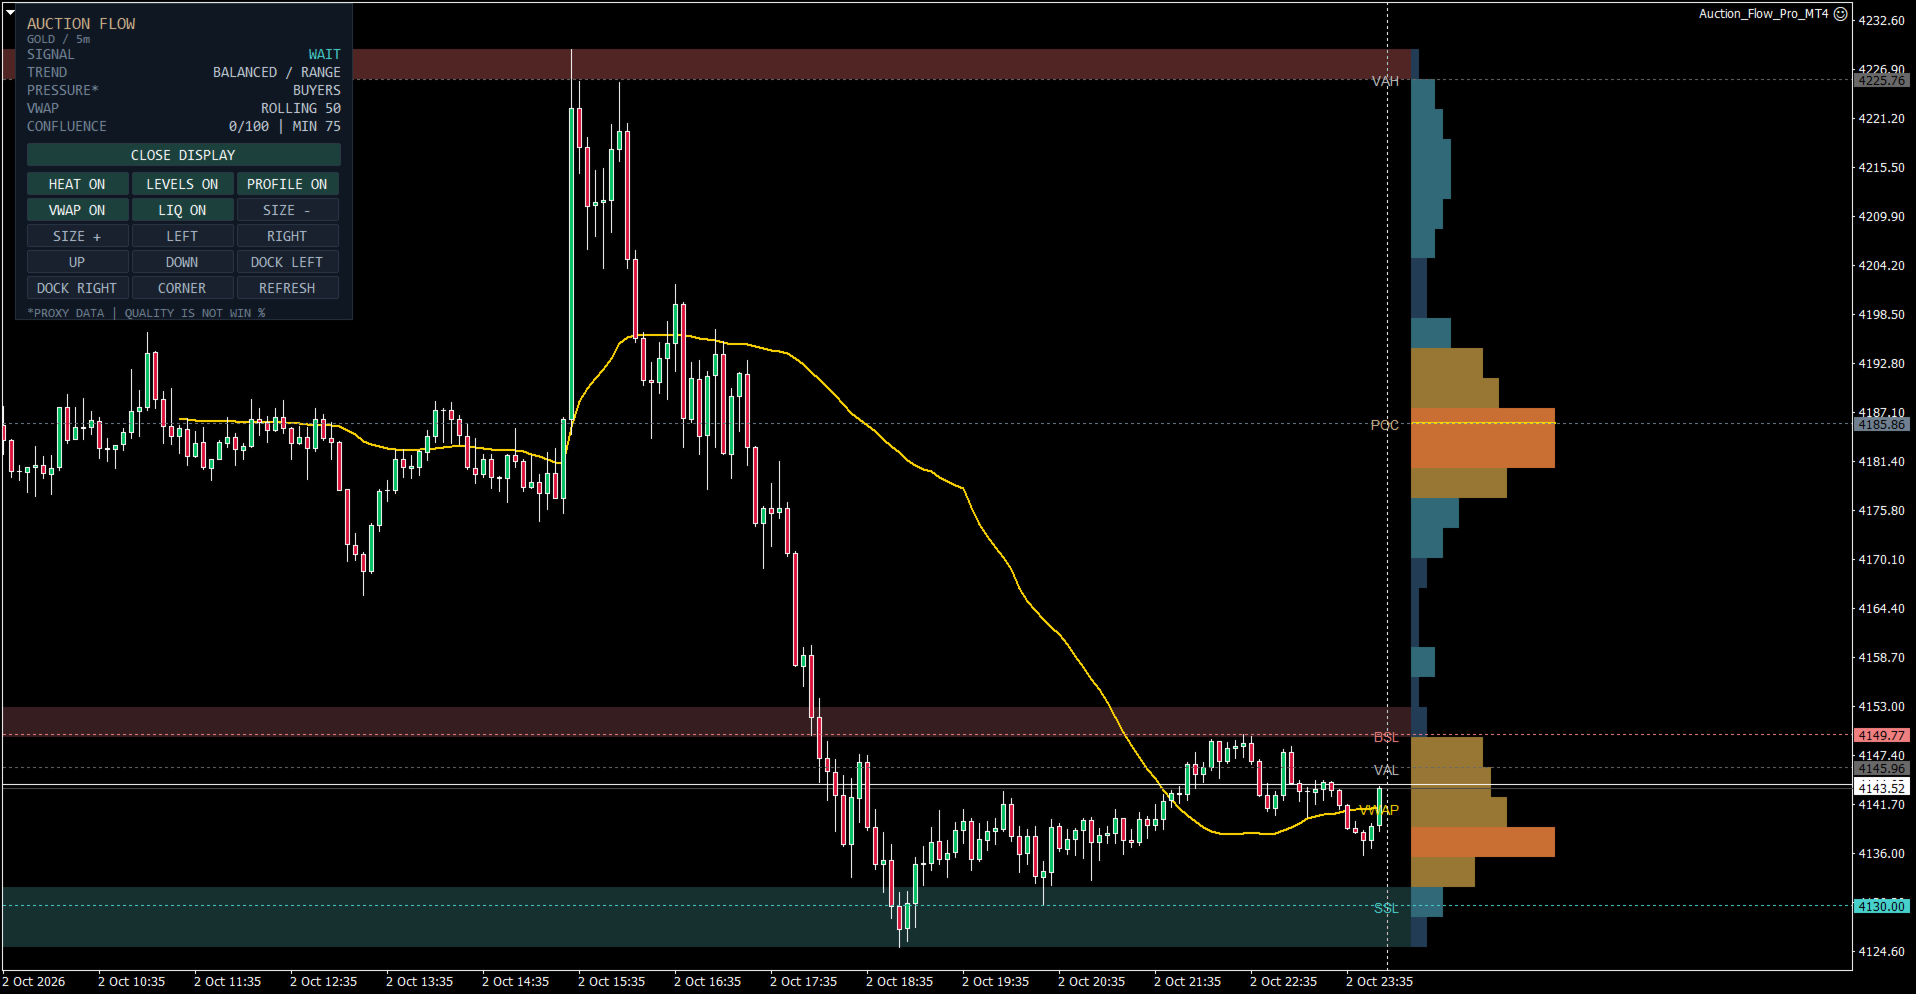
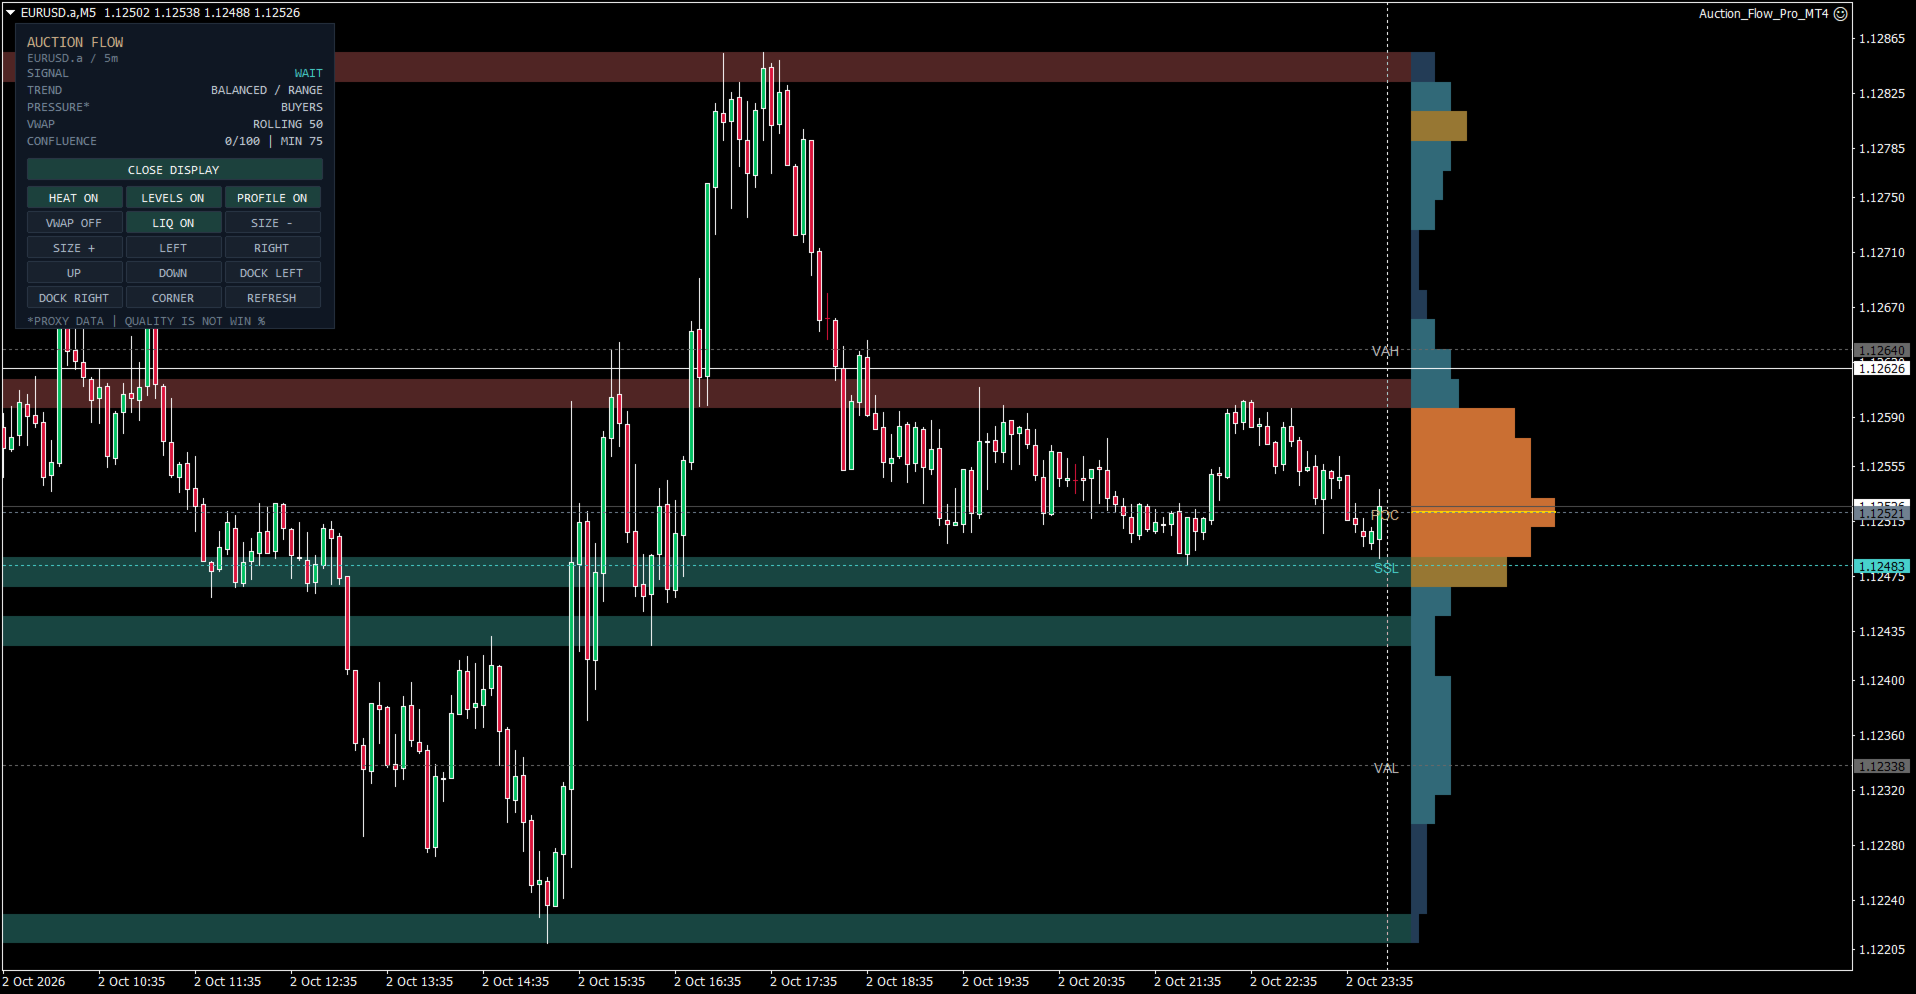
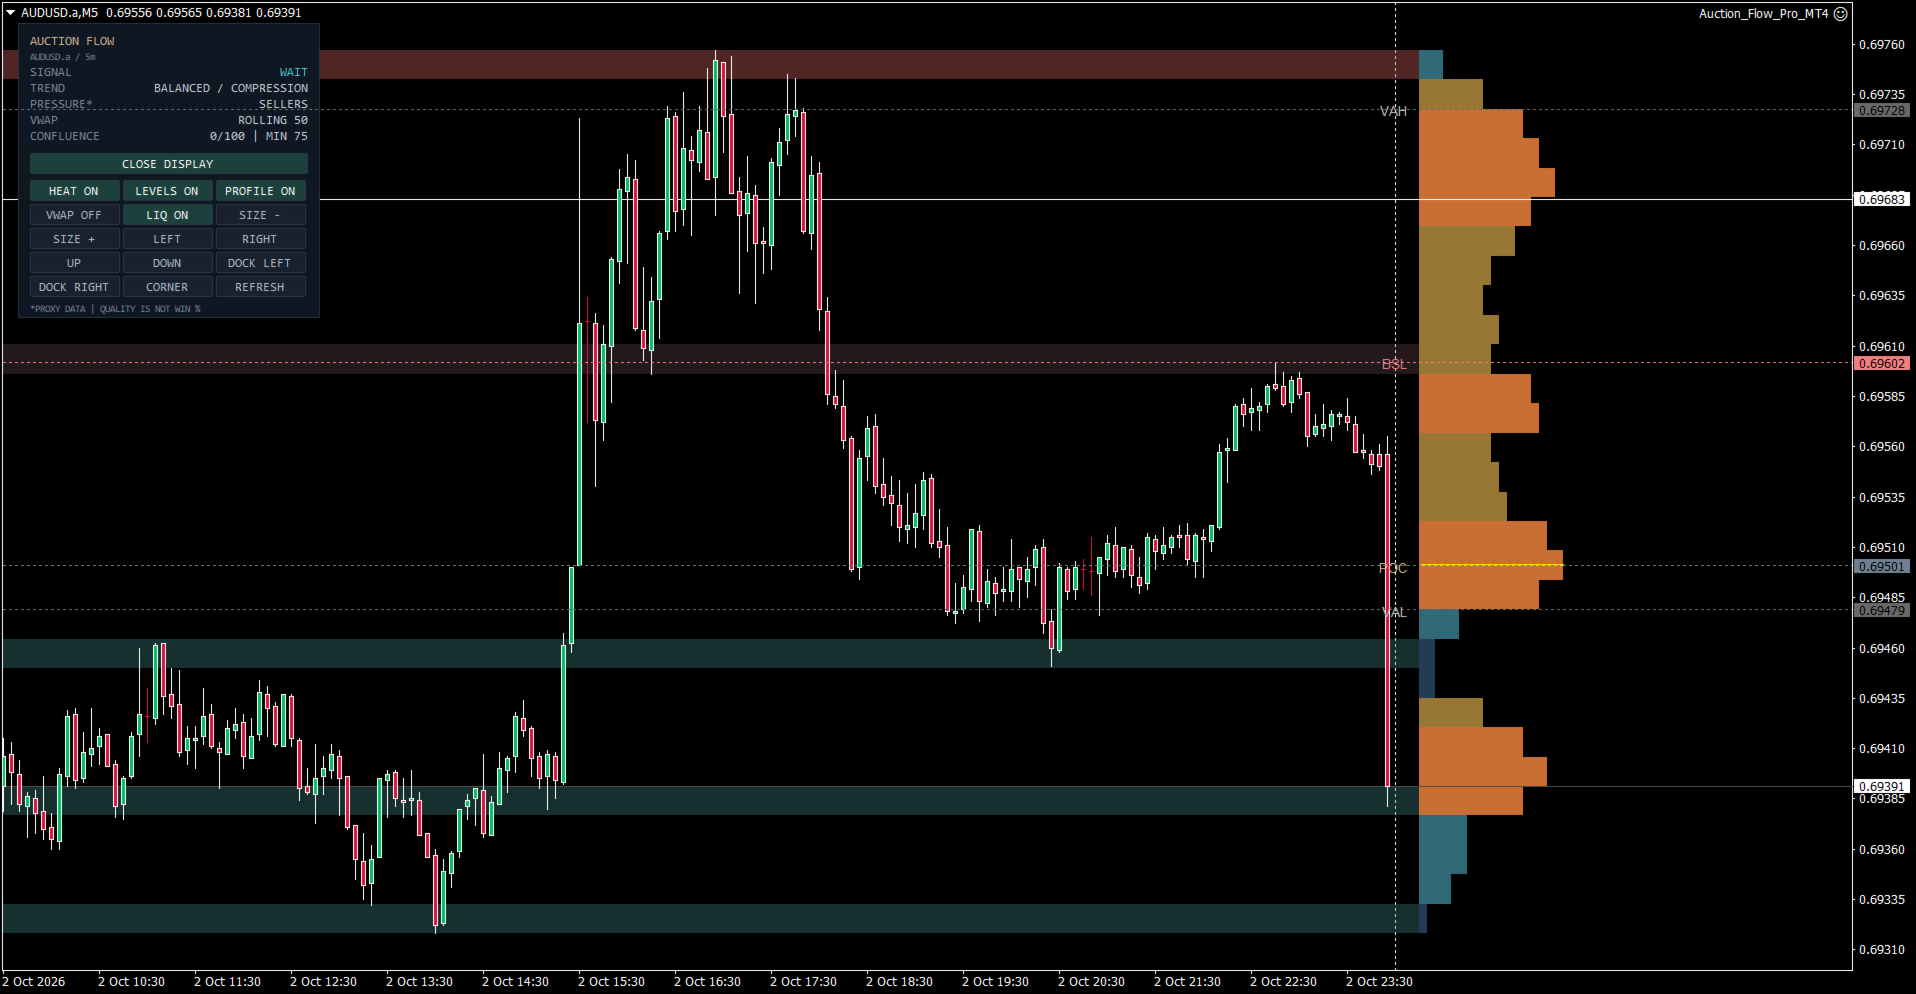
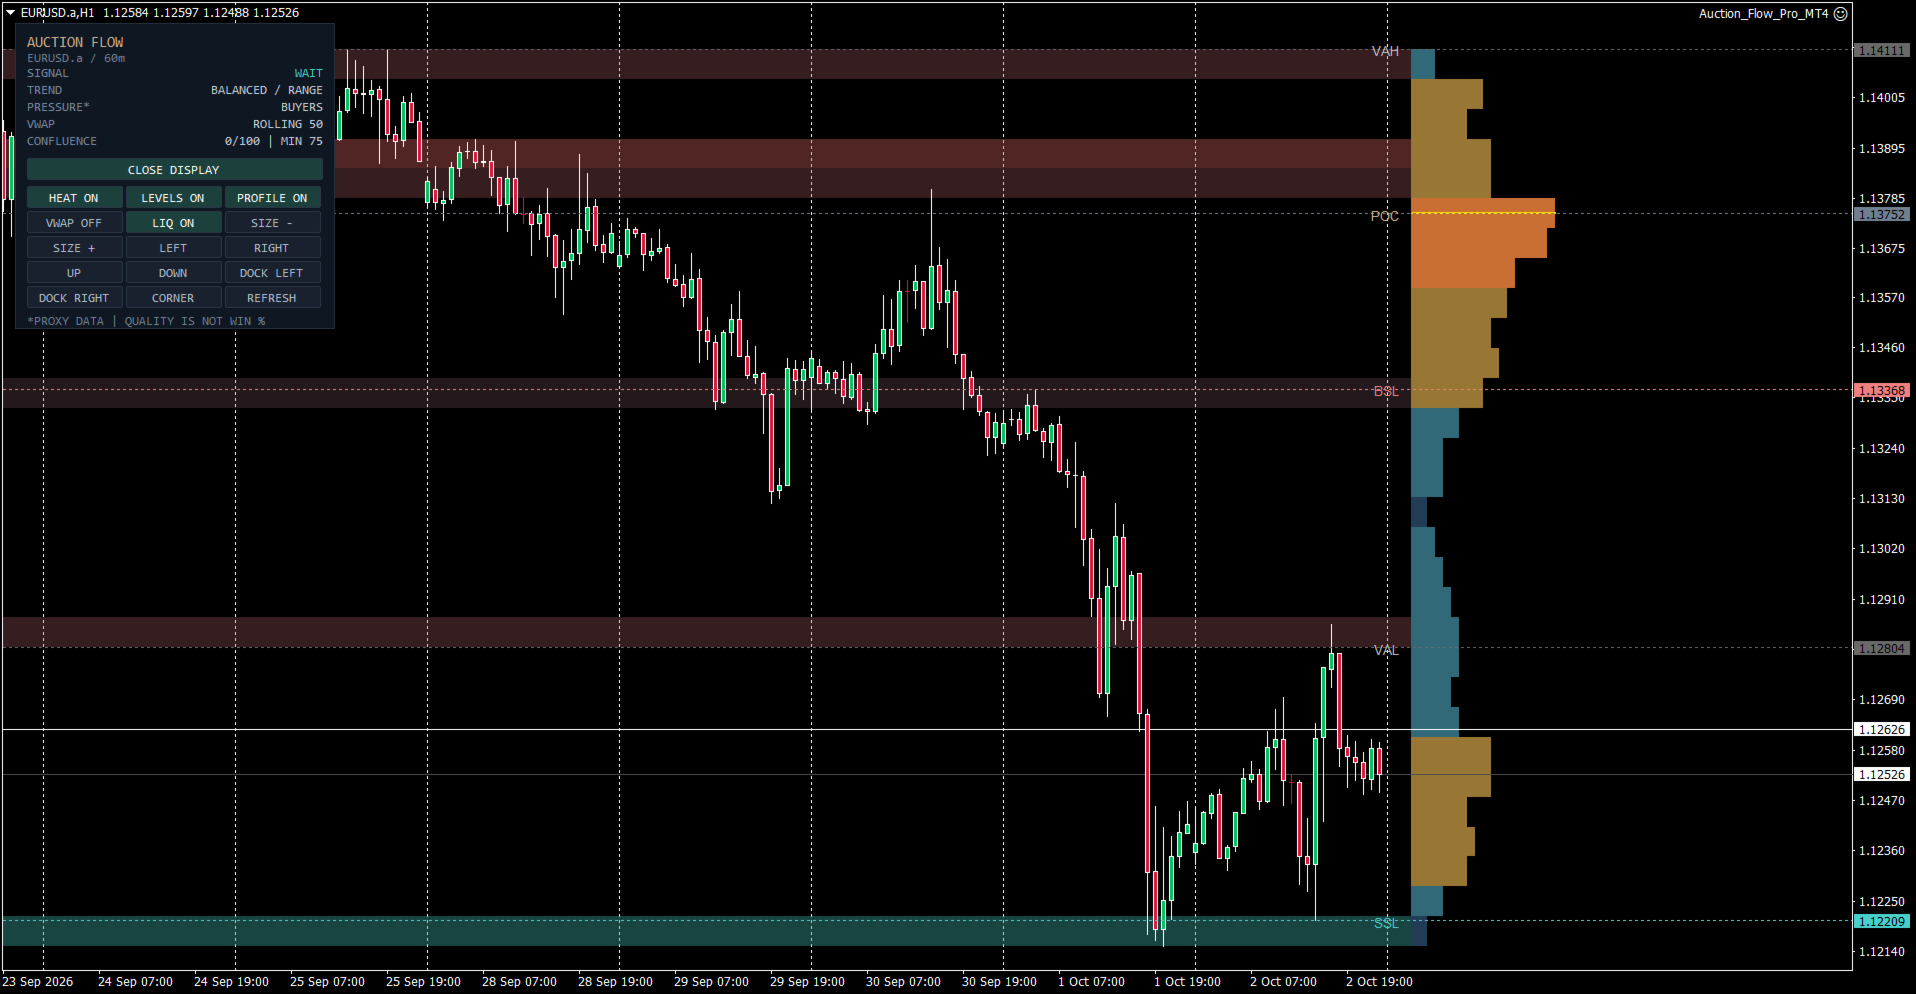
Auction Flow Pro
- Indicators
- Version: 3.0
- Activations: 5

Auction Flow Pro — Market Context, Clearly Presented
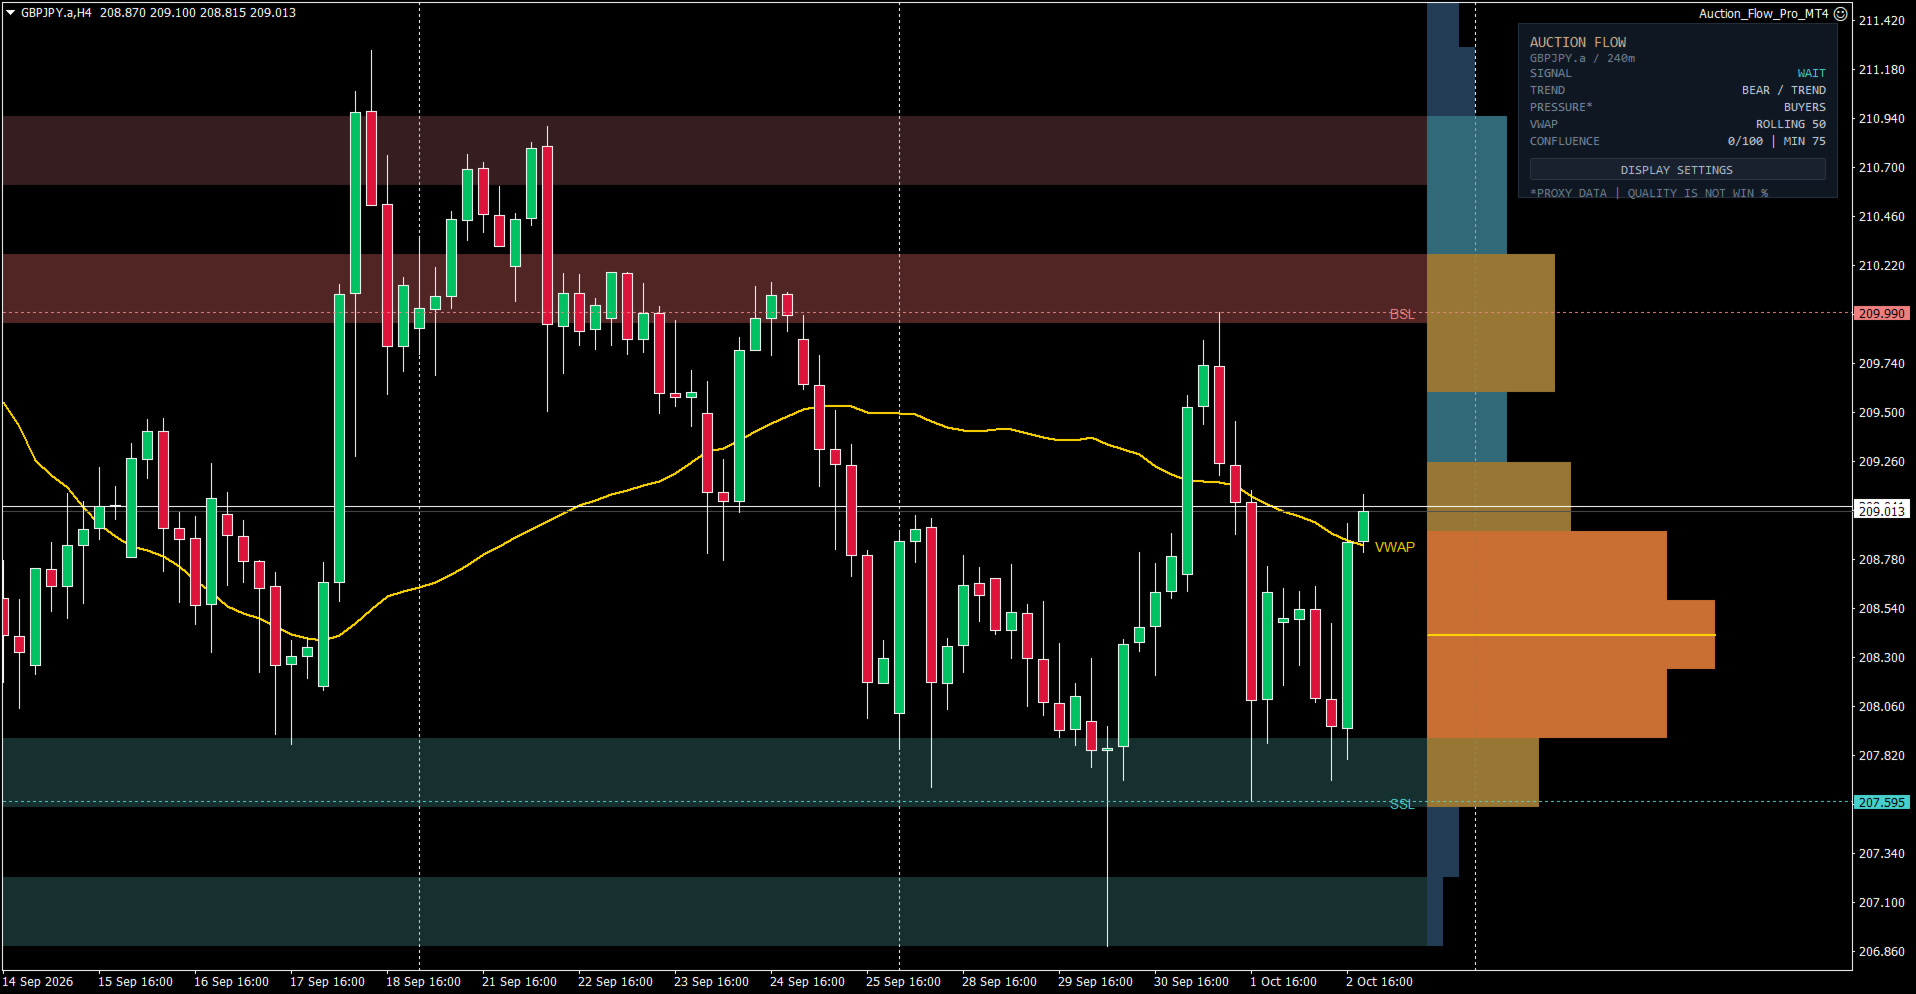
Auction Flow Pro brings volume profile, market heat, liquidity zones and VWAP into a clean MetaTrader 5 workspace. It is designed for traders who want to assess market conditions, review potential opportunities and keep important price areas visible without filling their charts with unnecessary clutter.
The product combines an informative chart display with a compact, adjustable dashboard. Essential readings remain easy to access, while interactive controls let you tailor the presentation to your preferred trading workspace.
See More Context Behind Price
Price movement becomes easier to assess when you can see the surrounding market context. Auction Flow Pro presents several complementary perspectives in one view, helping you examine where activity is concentrated, how price relates to its reference levels and which nearby areas may deserve attention.
Use the display to support your own chart analysis, prepare for a trading session or review a developing setup. The purpose is to organise useful information so you can make more deliberate decisions.
Volume Profile and Market Heat
The volume-profile display highlights the distribution of estimated trading activity across price levels. Its colour presentation makes differences in relative activity easier to recognise.
Point of Control and Value Area references provide additional context when reviewing the market. Clearly positioned labels keep these areas identifiable, while hover information offers further detail without crowding the chart.
Liquidity-Zone Visualisation
Auction Flow Pro displays liquidity-related areas directly alongside price. These visual references help you keep potential reaction areas in view as market conditions develop.
The zones complement the wider chart display, allowing you to assess their location in relation to price, the activity profile and VWAP. They are analytical references rather than promises that price will reverse or continue at a particular level.
A Clear, Continuous VWAP
The single VWAP line provides a straightforward reference for price location and direction. Its moving-average-style presentation keeps the chart readable while giving you another perspective on market conditions.
The display focuses on the central line, keeping the workspace clean and easy to follow.
Setup Signals and Market Status
Visual setup signals draw attention to potential opportunities for further review. The dashboard keeps the current signal status accessible, helping you distinguish between a waiting market and a developing setup.
Signals support your assessment of the chart. Your trading plan, execution decisions and risk tolerance remain essential parts of that process.
Compact Dashboard
The dashboard brings key readings together in a small, organised panel:
-
Signal status.
-
Market trend.
-
Estimated buying or selling pressure.
-
VWAP mode.
-
Setup confluence.
The confluence reading provides a quick view of agreement between the system’s conditions. It is a contextual score, not a predicted win rate.
Adjust the Chart to Your Workflow
Interactive display controls let you choose how much information appears on your chart. You can show or hide visual layers, adjust the dashboard size and reposition the panel to suit your layout.
Keep the controls collapsed during everyday chart review, then expand them when making display adjustments. This flexibility helps you maintain a focused workspace across different chart sizes and screen arrangements.
A Consistent Visual Workspace
Auction Flow Pro is built around a clear presentation: readable price action, distinct analytical references and a dashboard that keeps essential information close at hand.
It suits traders who value structured chart preparation and want several useful perspectives available in one place. The display can support both a quick market overview and a more detailed review of a potential setup.
Platform and Getting Started
This edition is designed for MetaTrader 5. Load sufficient chart history, review the available settings and familiarise yourself with the display on a demo account before relying on it in your trading workflow.
Readings and signals can differ between brokers because of variations in price history, tick volume, spreads and instrument specifications.
Important Information
Volume profile, market heat and pressure readings are estimates derived from broker-provided market data. They do not represent live exchange order-book depth or verified institutional orders.
No signal, zone or confluence score guarantees a profitable outcome. Trading involves risk, and losses are possible. Assess the product on your chosen broker, instrument and timeframe before live use.
Auction Flow Pro — Bring Clarity to Your Chart and Structure to Your Decisions.