Currency Strength Matrix MT5

THE ONLY CURRENCY STRENGTH INDICATOR BUILT ON PRICE ACTION


Most currency strength meters average an oscillator, or measure how far price has travelled. But these are not accurate measures of trend, Currency Strength Matrix measures trend strength, not just if a currency price has gone up or down.

Currency Strength Matrix reads market structure. For each of the 28 major pairs it finds the confirmed cycle highs and lows, and decides whether that pair is in an uptrend, a downtrend, or neither. A currency's score is simply the number of pairs it is beating minus the number it is losing to.


+7 is the maximum + score and means that currency is in an uptrend against all seven other majors. -7 means the opposite.

Because it reads structure rather than just price changes, a score only changes when the market CHANGES TREND.


THE TOTAL COLUMN

Strength is the score on your chart's timeframe. Total is the sum of the scores across the three timeframes you choose — H1, H4 and D1 by default. One number, from -21 to +21, that tells you whether a currency is strong everywhere or strong in only one place.

It sounds trivial but it stops one of the biggest causes of bad trades, taking a trend trade which is actually against the trend of another time frame. This helps to separate trades that work from trades that fight the market. Look at a real reading:

Currency Strength (D1) Total
AUD +4 +6
CAD +3 +3
JPY +3 -1
USD +2 +10
NZD -4 -17


On the daily alone, JPY (+3) looks stronger than USD (+2). The Total says the opposite. USD is +10 — it is being bought on the hourly, the four-hour and the daily at once. JPY is -1 — its daily strength is running against the shorter timeframes, which is exactly the kind of move that stalls.

And NZD at -17 out of a possible -21 is weak on every timeframe there is. So the trade the board is pointing at is not the one the daily column suggests. Pair the strongest Total against the weakest Total and you are trading with every timeframe you look at, not just the one on your screen.

Strength tells you what is happening now. Total tells you whether it is likely to continue.


WHAT YOU GET

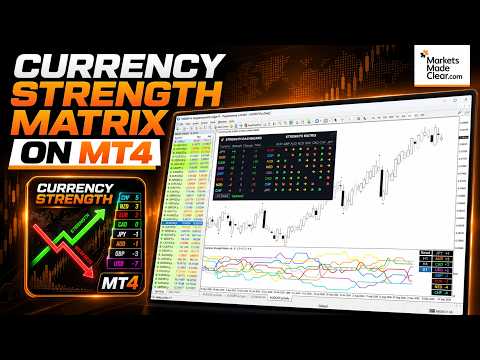
The dashboard — all eight currencies, sorted strongest to weakest automatically. Strength on your chart's timeframe, Change since the trading day opened, and the Total across your three timeframes.

The strength matrix — every one of the 28 pairings in a single grid. An arrow shows which side is winning: up if the row currency is beating the column currency, down if it is losing, sideways if there is no trend. Reading down a column shows you at a glance exactly which pairs are driving a currency's score. Collapse it with one click when you want the chart space back.

Strength history — the scores plotted for the last 200 bars, not just this moment. You can see which currency has been building strength for a week and which one turned this morning. Click any currency to isolate its line, or hide the ones you don't care about.

Timeframe buttons — inspect the H1, H4 or D1 picture without changing your chart. The chart stays where it is; only the panel and the lines switch.

Cycle markers on your chart — the confirmed highs and lows the scores are actually built from, drawn on the symbol you are looking at, plus its own trend reading. Nothing is hidden: you can see the structure behind every number.

Change since the day opened — who has gained and who has given ground today, measured from the broker's daily open.


FAST

The whole board — 28 pairs across four timeframes — is rebuilt from scratch in a few milliseconds. Switch symbol or timeframe and it is simply there.


SETTINGS

Total: timeframe 1 / 2 / 3 — the three timeframes that make up the Total column. H1, H4 and D1 by default. Set them to whatever you trade.

Bars of strength history — how much history to draw and to read structure from. Default 200.

Oversized bar threshold (x ATR) — bars far larger than average are news, not structure, and are handled separately so a single spike cannot invent a trend. Default 2.2. Raise it to treat fewer bars as oversized, lower it to treat more.

ATR period — default 14.

Marker offset, pips — how far the cycle markers sit from the high or low. Default 2. Cosmetic only; it does not affect any score.

Broker suffix — advanced. Leave blank and the indicator works out your broker's naming from EURUSD (".p", ".raw", ".m" and so on). Only set it if your broker uses more than one variant of the same pair.

Panel — show or hide it, position, font size (everything scales from it), background and text colour, and whether the sorted list and buttons appear in the strength window.

Markers — show or hide, high and low colours, size.

Strength line width and the eight currency colours — set these here in the Inputs tab, not the Colors tab, so they survive a timeframe change.


HOW TO TRADE IT

  1. Trade the extremes. Pair a currency with a high positive Total against one with a high negative Total. Both timeframes and structure agree; you are going with the market, not predicting it.
  2. Trade the crossings. When two currencies cross the zero line in opposite directions, the pair between them is changing hands. The strength history makes these easy to spot as they form.
  3. Trade the early turn. A strong currency losing strength against a weak one gaining it is the earliest, most aggressive entry the board offers — and the Total column tells you whether the bigger picture supports it or not.
  4. Use Total as a filter. Before taking any of the above, check the Total. Strength without Total is a short-term move inside a bigger trend going the other way.

REQUIREMENTS

MetaTrader 5. Works on any chart — forex, indices, metals — since the strength is always computed from the 28 major pairs regardless of what you are looking at. Your broker must offer the 28 major pairs for a complete board; the panel tells you if any are missing.


WHAT'S NEW IN v6

  • Total column across three timeframes of your choosing.
  • Strength matrix — all 28 pairings as a grid of arrows, collapsible.
  • Strength history for the last 200 bars, with click-to-isolate on any currency.
  • Timeframe buttons — see another timeframe without leaving your chart.
  • Cycle markers drawn on the chart, showing the structure behind the scores.
  • Change since the daily open.
  • Rebuilt calculation engine. The full board now takes milliseconds instead of minutes. Symbol and timeframe switching is instant and there is no background load.
  • Scales correctly on high-DPI displays.
Recommended products
Money Flow Profile MT4  HERE   Use Guide Here our more valuable tools SMC Trend Trading   ,  Easy SMC Trading  ,  Institutional SMC Architect Volume Analysis Tools  ,  Volume flow Profile  ,  Market volume profile  , FVG with Volume  , Liquidity Heatmap Profile  ,  Volume Spread Analysis  Master Edition is a professional-grade analytical tool designed to visualize market structure through the lens of volume and money flow. Unlike standard volume indicators, this tool displays a Daily Vo
Advanced Volume Profile
Henry Armando Baltazar
Advanced Volume Profile Liquidity Analysis via Custom Area Selection The Advanced Manual Volume Profile is a precision tool for MetaTrader 5 designed to deconstruct market structure through price-level volume analysis. Unlike static profiles, this indicator exclusively processes the price and time range defined by the user via a rectangle object, offering a surgical view of the market auction. Elite Technical Specifications Dynamic Algorithm: Real-time calculation (400ms refresh rate) based on t
FREE
Ospe POC Volume Profile
Nur Azureen Binti Ab Aziz
A volume-at-price heatmap with POC, value area, estimated buy/sell pressure, confirmed signals and alerts. POC Volume Profile Heatmap is a MetaTrader 5 indicator that organizes historical volume across price levels. It identifies the Point of Control, displays the selected value area, and estimates buying and selling pressure at the POC. The indicator is intended for traders who use volume-at-price structure to study acceptance, rejection and interaction around high-activity price levels. It c
FREE
Volume Profile OrderFlow Suite puts volume profiles, VWAP and tick order flow on one MetaTrader 5 chart, with one panel. It also measures how price actually reacted at the profile levels on your symbol, so you can see from your broker's own data whether a level has been worth watching. The panel always shows which data is used. Forex and CFD symbols in MT5 only have tick volume (the number of price changes), so on those symbols the buy/sell side is an estimate. Symbols with exchange trades use r
Makito NASDAQ
Riel Arthur Soliven
Makito NASDAQ is a professional market-analysis indicator for MetaTrader 5 designed for NASDAQ traders. It combines market structure, higher-timeframe trend, Mag7 stock participation, support and resistance, VIX sentiment, liquidity behavior, and multi-timeframe buying and selling pressure into one organized on-chart panel. The indicator summarizes current conditions with a simple: BUY – bullish conditions have sufficient alignment SELL – bearish conditions have sufficient alignment HOLD – confi
Correlation Matrix Pro - Multi Currency Pairs Hedge Scanner Understand the relationships between currency pairs in real-time! A powerful analysis tool that helps you visualize statistical relationships between up to 6 currency pairs simultaneously. Perfect for portfolio management, risk diversification, and hedging strategies. KEY FEATURES - Real-time Pearson correlation using log returns - Monitor up to 6 currency pairs simultaneously - Automatic timeframe detection - Adjustable lookback
FREE
Daily & Composite Volume Profile   This is a professional-grade market profile tool designed for MetaTrader 5. It utilizes a   Dual-Profile System   to visualize supply, demand, and liquidity concentrations. Key Features Left Side: Daily Session Profiles Automatically identifies the start and end of every trading day. Generates a unique Volume Profile for each individual day. Allows you to see how value migrated from yesterday to today (e.g., Is today's volume higher or lower than yesterday?).
Spike Blast Pro
Israr Hussain Shah
Here   our more valuable tools SMC Trend Trading   ,  Easy SMC Trading  ,  Institutional SMC Architect Volume Analysis Tools  ,  Volume flow Profile  ,  Market volume profile  , FVG with Volume  , Liquidity Heatmap Profile  ,  Volume Spread Analysis Spike Blaster Pro is a next-generation MT5 indicator designed specifically for synthetic markets. It works seamlessly on Boom Index and Weltrade Index , providing traders with sharp, reliable spike detection signals. What makes Spike Blaster Pro po
RSI Currency Strength Meter is a powerful and elegant multi-currency indicator that measures the real-time relative strength of the 8 major currencies using RSI logic. By calculating the smoothed performance of each currency across its major pairs and applying the RSI formula, it delivers clean and responsive strength lines that make it easy to spot which currencies are truly strong or weak at any moment. This indicator is particularly useful for visualizing currency correlations and divergence
Volume Profile FREE — Multi-Session Heatmap (POC · VAH · VAL) See where trading activity actually occurs—not just where price moves. This indicator builds a clear, color-coded Volume Profile Heatmap directly on your chart and highlights the market's most important price levels: the Point of Control (POC) and the Value Area (VAH/VAL) , where price is most likely to react.
FREE
Here   our more valuable tools SMC Trend Trading   ,  Easy SMC Trading  ,  Institutional SMC Architect Volume Analysis Tools  ,  Volume flow Profile  ,  Market volume profile  , FVG with Volume  , Liquidity Heatmap Profile  ,  Volume Spread Analysis Automatically detects major swing points not internal noise Generates buy/sell signals at key Fibonacci levels Displays professional GUI panel with real-time analysis Marks major swings with visual indicators Trading Strategy BUY at 38.2%-61.8% Fib
FREE
Here   our more valuable tools SMC Trend Trading   ,  Easy SMC Trading  ,  Institutional SMC Architect Volume Analysis Tools  ,  Volume flow Profile  ,  Market volume profile  , FVG with Volume  , Liquidity Heatmap Profile  ,  Volume Spread Analysis 1. Institutional Supply & Demand Zones Auto-Detection:   Automatically draws zones at valid pivot points. Smart Extension:   Zones extend into the future for easy visibility but automatically cut off when price breaks them. Mitigation Logic:   When
Gold Venamax MT5
Sergei Linskii
3.5 (2)
Gold Venamax - this is a best stock technical indicator. The indicator algorithm analyzes the price movement of an asset and reflects volatility and potential entry zones. Live Signal of manual trading >>>   [ Click Here ] Indicator features: This is a super indicator with Magic and two Blocks of trend arrows for comfortable and profitable trading. Red Button for switching blocks is displayed on the chart. Magic is set in the indicator settings, so that you can install the indicator on two chart
Fixed Volume Profile
Carlos Pascual Perez Maturano
This indicator, titled "Fixed Volume Profile.mq5", is a custom tool for MetaTrader 5 (MQL5) designed to calculate and display a Volume Profile over a user-defined fixed time range. The Volume Profile shows the distribution of trading volume at different price levels during a specific period, helping to identify areas of high activity (such as Points of Control or POCs) and volume-based support/resistance areas. Main Functionality: Interactive Range: The indicator creates two vertical lines on
FREE
VSA Smart Engine
Jean Carlos Martins Roso
VSASmartEngine - VSA Volume Intelligence System VSASmartEngine is a technical indicator for MetaTrader 5 based on VSA (Volume Spread Analysis) methodology. The system is designed to provide an objective reading of market activity, helping traders identify aggression, absorption, and exhaustion states by analyzing the relationship between volume and price action. The indicator features a dual-processing architecture, allowing the user to switch between the full VSA logic engine or a simplified h
The Dynamic Market Profile allows you to analyze the volume of any specific chart region manually and instantly. No more being restricted to fixed daily or weekly profiles: you choose the exact move, consolidation, or trend leg you want to analyze . The indicator lets you draw up to 5 independent areas at the same time using interactive rectangles . How It Works on a Daily Basis Create the zone: Press keys 1, 2, 3, 4, or 5 on your keyboard (or use the on-screen buttons) to plot a rectangle . A
Delta Profile Volume
Teresinha Moraes Correia
Technical Description of the Indicator – Delta Profile for MetaTrader 5 The Delta Profile is an indicator developed for MetaTrader 5 focused on detailed analysis of volume flow within a defined range of candles. It organizes and displays information about the imbalance of positive volumes (associated with upward movements) and negative volumes (associated with downward movements) at different price levels. The result is a clear view of the chart points where the highest concentration of trades o
Proxy OrderFlow MT5
Vincent Jose Proenca
Indicator based on tick-spread imbalance. TF: Works on all timeframes (M1 to D1). Pair: Compatible with Forex, indices, gold, and CFDs (auto-adjustment for JPY pairs, Gold, CFDs). Settings: TickWindow (200) – tick observation window SpreadWeight (1.5) – spread weighting factor NormalizationPeriod (20) – normalization period (z-score) Overbought / Oversold (±3.0) – alert thresholds AlertCooldown (300s) – alert cooldown period Conclusion: The Proxy Order Flow – Imbalance Tick-Spread v2.4 detect
SMCtarget
Zheng Quan He
SMC Pro is a chart-window indicator for traders who work with Smart Money Concepts: structure first, then wait for price to return into a high-quality POI. What it shows ZigZag swings on higher-timeframe structure (default H1) and on the chart timeframe BOS (break of structure) and CHoCH (change of character) Equal Highs / Equal Lows (liquidity pools) and an equilibrium midpoint Fair Value Gaps (FVG) filtered by ATR Order Blocks (OB) defined from a strong impulse candle Confluence score: structu
Radar Trade Analytic
Jeverson Rodrigues Ferreira
Radar Trade Analytic 2.0 – Quantitative Panel for MT5 What is Radar Trade Analytic? Radar Trade Analytic is the quantitative module of the Radar Trade Ecosystem. It opens in a separate window below the main chart and displays four synchronized layers , all built with the same proprietary Sigma engine, ensuring a direct correspondence between what you see on the chart and what you read in the panel. No buy or sell signals. No targets. No alerts. Radar Trade Analytic organizes the data tha
Here   our more valuable tools SMC Trend Trading   ,  Easy SMC Trading  ,  Institutional SMC Architect Volume Analysis Tools  ,  Volume flow Profile  ,  Market volume profile  , FVG with Volume  , Liquidity Heatmap Profile  ,  Volume Spread Analysis A professional spike pattern indicator built for synthetic traders who scalp and swing Crash 500/300/1000 with precision.  This indicator: Detects powerful 3-candle spike formations (Spike → Pullback → Spike) Automatically draws a clean box a
FREE
Enhanced Volume Profile: The Ultimate Order Flow & Liquidity Analysis Tool Overview Enhanced Volume Profile is an indicator for MetaTrader 5 that displays the traded volume at specific price levels over a defined period. It separates the total volume into buy and sell components, presenting them as a side-by-side histogram on the chart. This allows users to observe the volume distribution and the proportion of buy and sell volumes at each price level. Graphics Rendering The indicator uses the
FREE
Adaptive Volume Profile draws the Volume Profile of the latest bars directly on the chart: the Point of Control (POC), the Value Area (VAH / VAL), high-volume nodes (HVN), low-volume nodes (LVN) and an optional volume histogram. The size of the price rows adapts to the current volatility (ATR), so the profile stays readable on any symbol and timeframe. Features POC - the price level with the largest traded volume in the window Value Area (VAH / VAL) - the price range that contains the chosen sha
FREE
Smart SMC FVG
Ekkasawat Pitichalermroch
SMC + Volume Profile + FVG: Indicator Guide Overview SMC + Volume Profile + FVG is an all-in-one indicator for MetaTrader 5. It combines three popular price-action tools on a single chart: Smart Money Concepts (SMC): market structure (swings, BOS, CHoCH) and Order Blocks Fair Value Gaps (FVG): price imbalances left behind by fast moves Volume Profile: where the most trading happened, shown as POC, Value Area High and Value Area Low Everything is drawn automatically. You can turn each part on or
VibeFox Volume Profile — Volume Profile for MetaTrader 5 VibeFox Volume Profile is a complete Volume Profile toolkit for MetaTrader 5. It builds the horizontal distribution of traded volume across price, so you can instantly see where the market spent the most activity, where it traded thin, and which price levels are likely to act as magnets or barriers. Every profile is drawn directly on the chart and controlled from a modern, mouse-driven panel — no menus to dig through, no scripts to attach.
Volume Profile Multi-Mode: Analyze Volume Your Way—Not Your Indicator's Way. Most Volume Profile indicators limit traders to predefined analysis ranges. But the market doesn't move inside fixed templates, so why should your analysis? Volume Profile Multi-Mode gives you complete freedom to decide where, when, and how volume is analyzed. Whether you're studying market structure, profiling trading sessions, monitoring higher-timeframe activity, or tracking a developing auction, this indicator adapt
Relative Volume Profile (RVP) Stop guessing where the smart money is trading. See the exact price levels that matter. Overview Traditional Volume Profiles tell you where volume occurred, but they leave out a crucial piece of the puzzle: intensity . The Relative Volume Profile (RVP) is a next-generation charting tool that fuses standard price profiling with Relative Volume (RVOL) analysis. Instead of drawing plain, monotone blocks, RVP color-codes every single price level based on aggressive buyi
Technical Analysis Dashboard Pro
Andres Felipe Carvajal Rodriguez
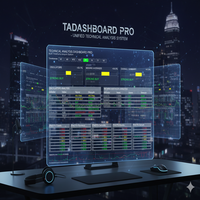
Technical Analysis Dashboard Pro (TADashboard Pro) – Unified Technical Analysis System TADashboard Pro is an advanced technical analysis panel that consolidates multiple indicators and timeframes into a single visual interface. Designed for traders who demand precision and efficiency , the system simultaneously analyzes 7 oscillators and 4 moving averages across 8 different timeframes , generating normalized scores that simplify decision-making. Key Features: Multi-Timeframe Analysis: Easily mon
FREE
Here   our more valuable tools SMC Trend Trading   ,  Easy SMC Trading  ,  Institutional SMC Architect Volume Analysis Tools  ,  Volume flow Profile  ,  Market volume profile  , FVG with Volume  , Liquidity Heatmap Profile  ,  Volume Spread Analysis The    Liquidity Heatmap   is a sophisticated institutional trading tool designed to reveal where over-leveraged traders are trapped. By calculating estimated liquidation levels based on volume spikes and leverage, this indicator draws a dynamic "h
Spike Phantom
Niccyril Chirindo
1 (1)
Spike Phantom Spike Phantom is a specialized indicator for PainX and GainX synthetic indices that generates trading signals with automatic alert notifications. Features The indicator analyzes market conditions using proprietary algorithms and displays buy/sell arrows directly on the chart. It works specifically with PainX and GainX indices on M5 timeframe. Signal generation combines multiple technical analysis methods to identify potential trading opportunities. The system provides two TP leve
Buyers of this product also purchase
Trend Sniper X
Sarvarbek Abduvoxobov
4.86 (44)
Trend Sniper X is a multi-timeframe trend-following indicator for MetaTrader 5 that helps traders identify trend direction and potential reversal points with clarity and precision. for MT4: https://www.mql5.com/en/market/product/193245 Price Information: The current price is promotional and is subject to change as upcoming updates and new features are released. Bonus Offer: To get the FREE Auto-Trade Assistant EA for this indicator, please message the author after purchasing. Code2Profit Channe
Entry Points Pro shows you where to enter, where to put the stop and what lot to trade — before you place the order. PRICE Now 199 USD: 8 copies at this price, then 249 USD. The final price is 349 USD. I make my money trading the markets, and I show it, so I don't need to sell this indicator to everyone. It is a tool for traders who think for themselves, not a magic button. No breakout, no trade. A gray arrow is a cancelled signal: price did not break the signal candle, so there was no entry
Ultra Indicator
Ihor Otkydach
5 (1)
ULTRA is a technical indicator that operates on an “all-in-one” basis—it independently analyzes the market, generates trading signals, displays levels for setting stop-loss orders, and suggests when to close trades to lock in profits or minimize losses. In other words, it doesn't matter if you don't know how to analyze the market, determine levels—where to set your stop-loss—or struggle with money management. ULTRA will do all of that for you! BUYER BONUS: After purchasing the ULTRA indicator, s
Gann Made Easy   is a professional and easy to use Forex trading system which is based on the best principles of trading using the theory of W.D. Gann. The indicator provides accurate BUY and SELL signals including Stop Loss and Take Profit levels. You can trade even on the go using PUSH notifications. PLEASE CONTACT ME AFTER PURCHASE TO GET TRADING  INSTRUCTIONS   AND GREAT EXTRA INDICATORS  FOR FREE! Probably you already heard about the Gann trading methods before. Usually the Gann theory is a
Boba Analysis Suite
Trade Ready Solutions LLC
5 (2)
Boba Analysis Suite Boba Analysis Suite is an analytical indicator for MetaTrader 5. It brings market structure, relevant price zones and broader market context together in a single chart view. Developed through practical experience as a trader and trading coach, it supports a structured analysis process: assessing market direction, identifying important levels and considering multiple timeframes together. Analysis in Context Individual signals gain meaning through context. Boba Analysis Suite h
Azimuth Pro
Ottaviano De Cicco
5 (7)
Azimuth Pro V2: Synthetic Fractal Structure and Confirmed Entries for MT5 Overview Azimuth Pro is a multi-level swing structure indicator by Merkava Labs . Four nested swing layers, swing-anchored VWAP, ABC pattern detection, three-timeframe structural filtering, and closed-bar confirmed entries — one chart, one workflow from micro-swings to macro-cycles. This is not a blind signal product. It is a structure-first workflow for traders who care about location, context, and timing. 1. What Change
FiboSniper Pro
Van Minh Nguyen
5 (4)
FiboSniper Pro - Multi-Filter Fibonacci System with Auto SL/TP and Control Panel FiboSniper Pro is a technical indicator that combines dynamic Fibonacci Envelopes with multiple confirmation filters to generate selective Buy and Sell signals. Fibonacci levels are calculated from Moving Average and ATR, then filtered by ADX, EMA, RSI, ATR, Volume, Time and Candle structure. The indicator displays automatic ATR-based Stop Loss and Take Profit levels directly on the chart, along with an interactive
M1 Sniper MT5
Oleg Rodin
5 (7)
M1 SNIPER  is an easy to use trading indicator system. It is an arrow indicator which is designed for M1 time frame. The indicator can be used as a standalone system for scalping on M1 time frame and it can be used as a part of your existing trading system. Though this trading system was designed specifically for short-term trading, it still can be helpful for all traders. This trading system can be used with any forex pair and time frame, though lower time frames are recommended from M1 up to M
Apex Patterns PRO Buy Indicator - Get Expert Advisor Based on it for FREE. Self-Optimizing Chart Pattern & Breakout Intelligence Traditional pattern scanners rely on fixed inputs, often underperforming when market volatility and structures shift. Apex Patterns PRO is designed to adapt to changing market conditions by combining structural chart pattern recognition, momentum filtering, and statistical self-optimization into one analytical framework. Adaptive Scanning Engine Self-Optimizing Patter
SQN Max indicator for MT5 by ITC
Renaud Herve Francois Candel
Sqn Max Indicator Sqn Max is an exclusive indicator to trade the market with high effectiveness. The indicator is based on price action, volatility and trend. This indicator is as simple as possible but not too simple. The indicator can generate alerts to ease the trading process. You don't have to stay all day in front of your screen. The indicator can be used with any class of assets and with any time frame. It is possible to achieve better results trading our list of selected assets. We achi
Adaptive Price Action Engine Buy Indicator- Get EA Based on it for FREE. Self-Optimizing Multi-Timeframe Trend & Candlestick Intelligence Markets do not behave the same way all the time—and not every price-action pattern has the same value in every market regime. Adaptive Price Action Engine is designed to adapt to changing market conditions by combining trend structure, multi-timeframe analysis, candlestick patterns, and statistical optimization into one analytical framework. Two Adaptive Mode
Divergence Bomber
Ihor Otkydach
4.89 (94)
Each buyer of this indicator also receives the following for free: The custom utility "Bomber Utility", which automatically manages every trade, sets Stop Loss and Take Profit levels, and closes trades according to the rules of this strategy Set files for configuring the indicator for various assets Set files for configuring Bomber Utility in the following modes: "Minimum Risk", "Balanced Risk", and "Wait-and-See Strategy" A step-by-step video manual to help you quickly install, configure, and
Power Candles MT5
Daniel Stein
4.58 (12)
Power Candles - Self-Optimizing Strength Indicator Strength usually lives in a sub-window. The line runs below, the candle above, and your eye keeps connecting the two. Power Candles puts the strength into the candle itself, colored from dark red to dark green, so the chart reads at a glance and the sub-window stays closed. The indicator also finds its own settings for the symbol and timeframe in front of you. One click on [ Apply Best ] draws entry, Stop Loss and Take Profit at the exact prices
Currency Strength Wizard   is a very powerful indicator that provides you with all-in-one solution for successful trading. The indicator calculates the power of this or that forex pair using the data of all currencies on multiple time frames. This data is represented in a form of easy to use currency index and currency power lines which you can use to see the power of this or that currency. All you need is attach the indicator to the chart you want to trade and the indicator will show you real s
Naked Forex Tweezer Pro Indicator Tweezer Pro Indicator is a pattern recognition indicator for Forex, Stocks, Indices, Futures, Commodities and Cryptos. The standard Tweezer is a two bar pattern. Our enhanced version is a multi-bar pattern. We filter the patterns for you so that you only get the     best and most effective patterns   and ignore the noise. The Tweezer pattern is a simple and effective pattern to trade. The strategy that comes with the Tweezer is based on price action. The Twe
Auto Optimized SpeedAngle is an institutional-grade momentum vectoring system that eliminates curve-fitting through continuous Walk-Forward Optimization (WFO). Rather than relying on static inputs that degrade when market regimes shift, the indicator dynamically recalibrates its parameters using Out-of-Sample (OOS) validation, ensuring the displayed signals represent genuine statistical edges rather than historical anomalies. By shifting the focus from subjective visual angles to normalized, qua
Multi Currency Strength and Momentum Indicator MT5 Dynamic Forex28 Navigator is the evolution of our long-time, popular indicators, combining the power of five in one: Advanced Currency Strength28 Indicator (700 reviews) Advanced Currency IMPULSE with ALERT (530 reviews) Currency Strength EXOTICS GOLD Impulse with Alert CS28 Combo Signals (recent Bonus) No need to buy four indicators and stack them on your charts. All of it is merged into one powerful indicator: the strength of the 28 Forex pair
ARICoins
Temirlan Kdyrkhan
ARICoin is a powerful trading companion designed to generate high-probability entry signals with dynamic TP/SL/DP levels based on volatility. Built-in performance tracking shows win/loss stats, PP1/PP2 hits, and success rates all updated live. Key Features: Buy/Sell signals with adaptive volatility bands Real-time TP/SL/DP levels based on ATR Built-in MA Filter with optional ATR/StdDev volatility Performance stats panel (Success, Profit/Loss, PP1/PP2) Alerts via popup, sound, push, or email Cust
PZ Swing Trading MT5
PZ TRADING SLU
5 (5)
Protect against whipsaws: revolutionize your swing trading approach Swing Trading is the first indicator designed to detect swings in the direction of the trend and possible reversal swings. It uses the baseline swing trading approach, widely described in trading literature. The indicator studies several price and time vectors to track the aggregate trend direction and detects situations in which the market is oversold or overbought and ready to correct. [ Installation Guide | Update Guide | Tro
Apollo SR Master is a Support/Resistance indicator with special features which make trading with Support/Resistance zones easier and more reliable. The indicator calculates Support/Resistance zones in real-time without any time lag by detecting local price tops and bottoms. Then to confirm the newly formed SR area, the indicator shows special signal which signalizes that the SR zone can be taken into consideration and used as an actual SELL or BUY signal. In this case the strength of the SR zone
Neuro Poseidon MT5
Daria Rezueva
4.68 (53)
Neuro Poseidon is a new indicator by Daria Rezueva. It combines precise trading signals with adaptive TP/SL levels - creating best possible trades as a result! Message me and get  Neuro Poseidon Assistant  as a gift to automize your trading process! What makes it stand out? 1. Proven profitability on all assets and timeframes 2. Only confirmed BUY and SELL signals present on the chart 3. Adaptive TP & SL levels generated by the software for each trade 4. Easy to understand - suitable for al
SIO Oscillator: Self-Optimizing Semivariance Imbalance Oscillator Buy the indicator and get the Expert Advisor based on it for FREE. Most oscillators treat all price movement the same. SIO separates upside and downside market pressure and measures the imbalance between them, showing which side is really in control: buyers or sellers. When the imbalance reaches an extreme, SIO prints a clear signal with entry, Stop Loss and Take Profit levels. What makes SIO different is that it doesn’t rely on f
Advanced Supply Demand MT5
Bernhard Schweigert
4.53 (15)
Best Solution for any Newbie or Expert Trader! This indicator is a unique, high quality and affordable trading tool because we have incorporated a number of proprietary features and a new formula. With this update, you will be able to show double timeframe zones. You will not only be able to show a higher TF but to show both, the chart TF, PLUS the higher TF: SHOWING NESTED ZONES. All Supply Demand traders will love it. :) Important Information Revealed Maximize the potential of Advanced Supply
ScalpPoint
Temirlan Kdyrkhan
ScalpPoint is a powerful trading companion designed to generate high-probability entry signals with dynamic TP/SL/DP levels based on volatility. Built-in performance tracking shows win/loss stats, PP1/PP2 hits, and success rates — all updated live. Key Features: Buy/Sell signals with adaptive volatility bands Real-time TP/SL/DP levels based on ATR Built-in MA Filter with optional ATR/StdDev volatility Performance stats panel (Success, Profit/Loss, PP1/PP2) Alerts via popup, sound, push, or emai
Astral Structure
Ottaviano De Cicco
Astral Structure Assess the setup. See the initial plan. Launch Special - $99. $149 after launch. A structure setup raises several questions at once: does the wider view agree, where is the stop reference, and how are targets defined? Astral Structure brings those questions into one workspace for discretionary traders who build their decisions around market structure. Focus on the relevant setup. Review the latest eligible setup, its direction and qualification together. See the wider agreement.
Superhero
Ihor Otkydach
5 (3)
The SUPERHERO indicator is a multi-currency trading system designed on an "all-inclusive" basis. The indicator independently analyzes the market and provides signals on when to open and close trades. It uses Stop Loss and Take Profit orders. The R:R ratio is 1:1. This system can send push notifications to your smartphone, so you can place trades "on the go" without needing to be tied to a PC. It's perfect for proprietary trading firms. A BONUS FOR EVERY CUSTOMER: Every buyer of this indicator wi
Bill Williams Advanced
Siarhei Vashchylka
5 (11)
Bill Williams Advanced is designed for automatic chart analysis using Bill Williams' "Profitunity" system. The indicator analyzes four timeframes at once. Manual (Be sure to read before purchasing) Advantages 1. Analyzes the chart using Bill Williams' "Profitunity" system. Signals are displayed in a table in the corner of the screen and on the price chart. 2. Finds all known AO and AC signals, as well as zone signals. Equipped with a trend filter based on the Alligator. 3. Finds "Divergence Bar
Naked Forex Kangaroo Tail Pro Indicator Kangaroo Tail Pro Indicator is a pattern recognition indicator for Forex, Stocks, Indices, Futures, Commodities and Cryptos. The Kangaroo Tail is a multi-bar pattern. The Kangaroo Tail pattern is very effective and is very simple to trade. The strategy that comes with the Kangaroo Tail is based on price action. The indicator does what it was designed for: displaying Kangaroo Tail patterns.     Don't expect to follow the up and down arrows and make mone
AriFocus
Temirlan Kdyrkhan
AriFocus - Non-Repainting Buy/Sell Signals AriFocus - one clear signal. AriFocus marks buy and sell signals directly on the chart and suggests a stop-loss level for each one. Every signal is confirmed on bar close and never repaints. - Buy/sell arrows, confirmed on bar close - Suggested stop-loss level for every signal - Trend band and candle coloring to show direction at a glance - 10 ready-made presets, or your own settings (14 calculation methods) - Pop-up, push and email alerts with entr
RSI Thunder MT5
Muhammad Abdulrahman Omar Naima Allah Al-rais
RSI Thunder is a powerful and intelligent trading indicator designed for traders who value precision over noise. The indicator generates signals only after candle close , completely eliminating repainting and false entries. It combines multiple proven technical tools into one robust decision-making system, delivering clean, high-quality buy and sell signals directly on the chart. RSI Thunder integrates RSI, EMA, ADX, and ATR , reinforced by a strict SMA40 trend-direction filter to ensure trades
More from author
Cycle Finder Pro
Raymond Gilmour
5 (11)
## THE CHART, READ FOR YOU. Chart reading is slow, and it is easy to get wrong. You need to know which highs and lows actually matter, which ones the market has already invalidated, and what the ones that remain are telling you. Miss a point and the whole read changes. Cycle Finder Pro marks TRUE highs and lows, and nothing else. A high is confirmed when two subsequent bars each take out the low beneath them. A low when two take out the high above. The bars need not be consecutive — the marke
EVERY MARKET YOU FOLLOW, ALL YOUR TIMEFRAMES, ON ONE TABLE If you follow the trend on more than one timeframe, checking every market chart by chart is slow, and it is easy to miss one. Trend Viewer Pro reads it for you. For every market on your list it shows the trend on up to three timeframes of your choosing, in one table on any chart, and sums each market up in a single word: **STRONG**, **BULL**, **BEAR** or **MIXED**. Every reading is Cycle Finder Pro's. A high is confirmed when two lat
Currency Strength Matrix
Raymond Gilmour
4.5 (26)
THE ONLY CURRENCY STRENGTH INDICATOR BUILT ON PRICE ACTION Most currency strength meters average an oscillator, or measure how far price has travelled. But these are not accurate measures of trend, Currency Strength Matrix measures trend strength, not just if a currency price has gone up or down. Currency Strength Matrix reads market structure . For each of the 28 major pairs it finds the confirmed cycle highs and lows, and decides whether that pair is in an uptrend, a downtrend, or neither. A
CycleFinderPro
Raymond Gilmour
5 (1)
## THE CHART, READ FOR YOU. Chart reading is slow, and it is easy to get wrong. You need to know which highs and lows actually matter, which ones the market has already invalidated, and what the ones that remain are telling you. Miss a point and the whole read changes. Cycle Finder Pro marks TRUE highs and lows, and nothing else. A high is confirmed when two subsequent bars each take out the low beneath them. A low when two take out the high above. The bars need not be consecutive — the marke
Trend Viewer Pro
Raymond Gilmour
5 (4)
EVERY MARKET YOU FOLLOW, ON YOUR TIMEFRAMES, IN ONE TABLE If you follow the trend on more than one timeframe, checking every market chart by chart is  slow, and it is easy to miss one. Trend Viewer Pro reads it for you. For every market on your list it shows the trend on up  to three timeframes of your choosing, in one table on any chart, and sums each market up in  a single word: **STRONG**, **BULL**, **BEAR** or **MIXED**. Every reading is Cycle Finder Pro's. A high is confirmed when two late
Filter:
No reviews
Reply to review