Currency Strength Matrix MT5

THE ONLY CURRENCY STRENGTH INDICATOR BUILT ON PRICE ACTION


Most currency strength meters average an oscillator, or measure how far price has travelled. But these are not accurate measures of trend, Currency Strength Matrix measures trend strength, not just if a currency price has gone up or down.

Currency Strength Matrix reads market structure. For each of the 28 major pairs it finds the confirmed cycle highs and lows, and decides whether that pair is in an uptrend, a downtrend, or neither. A currency's score is simply the number of pairs it is beating minus the number it is losing to.


+7 is the maximum + score and means that currency is in an uptrend against all seven other majors. -7 means the opposite.

Because it reads structure rather than just price changes, a score only changes when the market CHANGES TREND.


THE TOTAL COLUMN

Strength is the score on your chart's timeframe. Total is the sum of the scores across the three timeframes you choose — H1, H4 and D1 by default. One number, from -21 to +21, that tells you whether a currency is strong everywhere or strong in only one place.

It sounds trivial but it stops one of the biggest causes of bad trades, taking a trend trade which is actually against the trend of another time frame. This helps to separate trades that work from trades that fight the market. Look at a real reading:

Currency Strength (D1) Total
AUD +4 +6
CAD +3 +3
JPY +3 -1
USD +2 +10
NZD -4 -17


On the daily alone, JPY (+3) looks stronger than USD (+2). The Total says the opposite. USD is +10 — it is being bought on the hourly, the four-hour and the daily at once. JPY is -1 — its daily strength is running against the shorter timeframes, which is exactly the kind of move that stalls.

And NZD at -17 out of a possible -21 is weak on every timeframe there is. So the trade the board is pointing at is not the one the daily column suggests. Pair the strongest Total against the weakest Total and you are trading with every timeframe you look at, not just the one on your screen.

Strength tells you what is happening now. Total tells you whether it is likely to continue.


WHAT YOU GET

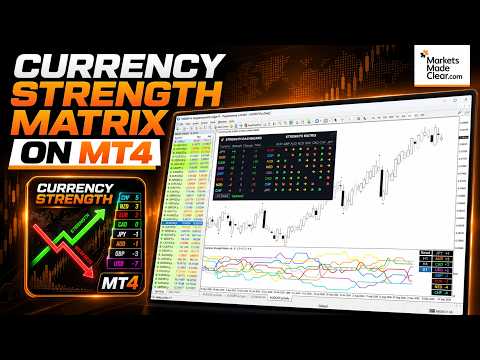
The dashboard — all eight currencies, sorted strongest to weakest automatically. Strength on your chart's timeframe, Change since the trading day opened, and the Total across your three timeframes.

The strength matrix — every one of the 28 pairings in a single grid. An arrow shows which side is winning: up if the row currency is beating the column currency, down if it is losing, sideways if there is no trend. Reading down a column shows you at a glance exactly which pairs are driving a currency's score. Collapse it with one click when you want the chart space back.

Strength history — the scores plotted for the last 200 bars, not just this moment. You can see which currency has been building strength for a week and which one turned this morning. Click any currency to isolate its line, or hide the ones you don't care about.

Timeframe buttons — inspect the H1, H4 or D1 picture without changing your chart. The chart stays where it is; only the panel and the lines switch.

Cycle markers on your chart — the confirmed highs and lows the scores are actually built from, drawn on the symbol you are looking at, plus its own trend reading. Nothing is hidden: you can see the structure behind every number.

Change since the day opened — who has gained and who has given ground today, measured from the broker's daily open.


FAST

The whole board — 28 pairs across four timeframes — is rebuilt from scratch in a few milliseconds. Switch symbol or timeframe and it is simply there.


SETTINGS

Total: timeframe 1 / 2 / 3 — the three timeframes that make up the Total column. H1, H4 and D1 by default. Set them to whatever you trade.

Bars of strength history — how much history to draw and to read structure from. Default 200.

Oversized bar threshold (x ATR) — bars far larger than average are news, not structure, and are handled separately so a single spike cannot invent a trend. Default 2.2. Raise it to treat fewer bars as oversized, lower it to treat more.

ATR period — default 14.

Marker offset, pips — how far the cycle markers sit from the high or low. Default 2. Cosmetic only; it does not affect any score.

Broker suffix — advanced. Leave blank and the indicator works out your broker's naming from EURUSD (".p", ".raw", ".m" and so on). Only set it if your broker uses more than one variant of the same pair.

Panel — show or hide it, position, font size (everything scales from it), background and text colour, and whether the sorted list and buttons appear in the strength window.

Markers — show or hide, high and low colours, size.

Strength line width and the eight currency colours — set these here in the Inputs tab, not the Colors tab, so they survive a timeframe change.


HOW TO TRADE IT

  1. Trade the extremes. Pair a currency with a high positive Total against one with a high negative Total. Both timeframes and structure agree; you are going with the market, not predicting it.
  2. Trade the crossings. When two currencies cross the zero line in opposite directions, the pair between them is changing hands. The strength history makes these easy to spot as they form.
  3. Trade the early turn. A strong currency losing strength against a weak one gaining it is the earliest, most aggressive entry the board offers — and the Total column tells you whether the bigger picture supports it or not.
  4. Use Total as a filter. Before taking any of the above, check the Total. Strength without Total is a short-term move inside a bigger trend going the other way.

REQUIREMENTS

MetaTrader 5. Works on any chart — forex, indices, metals — since the strength is always computed from the 28 major pairs regardless of what you are looking at. Your broker must offer the 28 major pairs for a complete board; the panel tells you if any are missing.


WHAT'S NEW IN v6

  • Total column across three timeframes of your choosing.
  • Strength matrix — all 28 pairings as a grid of arrows, collapsible.
  • Strength history for the last 200 bars, with click-to-isolate on any currency.
  • Timeframe buttons — see another timeframe without leaving your chart.
  • Cycle markers drawn on the chart, showing the structure behind the scores.
  • Change since the daily open.
  • Rebuilt calculation engine. The full board now takes milliseconds instead of minutes. Symbol and timeframe switching is instant and there is no background load.
  • Scales correctly on high-DPI displays.
Önerilen ürünler
Master Edition, piyasa yapısını hacim ve para akışı merceğinden görselleştirmek için tasarlanmış profesyonel kalitede bir analiz aracıdır. Standart hacim göstergelerinin aksine, bu araç doğrudan grafiğinizde bir Günlük Hacim Profili görüntüleyerek, fiyat keşfinin tam olarak nerede gerçekleştiğini ve "akıllı paranın" nerede konumlandığını görmenizi sağlar. Bu Master Edition, netlik ve hız için tasarlanmıştır ve yüklendiğinde grafik düzeninizi anında güzelleştiren benzersiz bir Otomatik Tema Senkr
Advanced Volume Profile Liquidity Analysis via Custom Area Selection The Advanced Manual Volume Profile is a precision tool for MetaTrader 5 designed to deconstruct market structure through price-level volume analysis. Unlike static profiles, this indicator exclusively processes the price and time range defined by the user via a rectangle object, offering a surgical view of the market auction. Elite Technical Specifications Dynamic Algorithm: Real-time calculation (400ms refresh rate) based on t
FREE
Ospe POC Volume Profile
Nur Azureen Binti Ab Aziz
A volume-at-price heatmap with POC, value area, estimated buy/sell pressure, confirmed signals and alerts. POC Volume Profile Heatmap is a MetaTrader 5 indicator that organizes historical volume across price levels. It identifies the Point of Control, displays the selected value area, and estimates buying and selling pressure at the POC. The indicator is intended for traders who use volume-at-price structure to study acceptance, rejection and interaction around high-activity price levels. It c
FREE
Volume Profile OrderFlow Suite puts volume profiles, VWAP and tick order flow on one MetaTrader 5 chart, with one panel. It also measures how price actually reacted at the profile levels on your symbol, so you can see from your broker's own data whether a level has been worth watching. The panel always shows which data is used. Forex and CFD symbols in MT5 only have tick volume (the number of price changes), so on those symbols the buy/sell side is an estimate. Symbols with exchange trades use r
Makito NASDAQ
Riel Arthur Soliven
Makito NASDAQ is a professional market-analysis indicator for MetaTrader 5 designed for NASDAQ traders. It combines market structure, higher-timeframe trend, Mag7 stock participation, support and resistance, VIX sentiment, liquidity behavior, and multi-timeframe buying and selling pressure into one organized on-chart panel. The indicator summarizes current conditions with a simple: BUY – bullish conditions have sufficient alignment SELL – bearish conditions have sufficient alignment HOLD – confi
Correlation Matrix Pro - Çoklu Döviz Hedge Tarayıcı Döviz çiftleri arasındaki ilişkileri gerçek zamanlı olarak anlayın! 6 döviz çifti arasındaki istatistiksel ilişkileri aynı anda görselleştirmenize yardımcı olan güçlü bir analiz aracıdır. Portföy yönetimi, risk çeşitlendirmesi ve hedge stratejileri için mükemmeldir. TEMEL ÖZELLİKLER - Logaritmik getiriler kullanan gerçek zamanlı Pearson korelasyonu - Aynı anda 6 döviz çiftini izleme - Otomatik zaman dilimi algılama - Ayarlanabilir geriye bakış
FREE
Daily & Composite Volume Profile   This is a professional-grade market profile tool designed for MetaTrader 5. It utilizes a   Dual-Profile System   to visualize supply, demand, and liquidity concentrations. Key Features Left Side: Daily Session Profiles Automatically identifies the start and end of every trading day. Generates a unique Volume Profile for each individual day. Allows you to see how value migrated from yesterday to today (e.g., Is today's volume higher or lower than yesterday?).
Spike Blast Pro
Israr Hussain Shah
Here   our more valuable tools SMC Trend Trading   ,  Easy SMC Trading  ,  Institutional SMC Architect Volume Analysis Tools  ,  Volume flow Profile  ,  Market volume profile  , FVG with Volume  , Liquidity Heatmap Profile  ,  Volume Spread Analysis Spike Blaster Pro is a next-generation MT5 indicator designed specifically for synthetic markets. It works seamlessly on Boom Index and Weltrade Index , providing traders with sharp, reliable spike detection signals. What makes Spike Blaster Pro po
RSI Currency Strength Meter is a powerful and elegant multi-currency indicator that measures the real-time relative strength of the 8 major currencies using RSI logic. By calculating the smoothed performance of each currency across its major pairs and applying the RSI formula, it delivers clean and responsive strength lines that make it easy to spot which currencies are truly strong or weak at any moment. This indicator is particularly useful for visualizing currency correlations and divergence
Volume Profile FREE — Multi-Session Heatmap (POC · VAH · VAL) See where trading activity actually occurs—not just where price moves. This indicator builds a clear, color-coded Volume Profile Heatmap directly on your chart and highlights the market's most important price levels: the Point of Control (POC) and the Value Area (VAH/VAL) , where price is most likely to react.
FREE
Here   our more valuable tools SMC Trend Trading   ,  Easy SMC Trading  ,  Institutional SMC Architect Volume Analysis Tools  ,  Volume flow Profile  ,  Market volume profile  , FVG with Volume  , Liquidity Heatmap Profile  ,  Volume Spread Analysis Automatically detects major swing points not internal noise Generates buy/sell signals at key Fibonacci levels Displays professional GUI panel with real-time analysis Marks major swings with visual indicators Trading Strategy BUY at 38.2%-61.8% Fib
FREE
Here   our more valuable tools SMC Trend Trading   ,  Easy SMC Trading  ,  Institutional SMC Architect Volume Analysis Tools  ,  Volume flow Profile  ,  Market volume profile  , FVG with Volume  , Liquidity Heatmap Profile  ,  Volume Spread Analysis 1. Institutional Supply & Demand Zones Auto-Detection:   Automatically draws zones at valid pivot points. Smart Extension:   Zones extend into the future for easy visibility but automatically cut off when price breaks them. Mitigation Logic:   When
Gold Venamax MT5
Sergei Linskii
3.5 (2)
Gold Venamax - bu en iyi hisse senedi teknik göstergesidir. Gösterge algoritması bir varlığın fiyat hareketini analiz eder ve oynaklığı ve potansiyel giriş bölgelerini yansıtır. Gösterge özellikleri: Bu, rahat ve karlı ticaret için Magic ve iki Blok trend oku içeren süper bir göstergedir. Grafikte blokları değiştirmek için Kırmızı Düğme görüntülenir. Magic, gösterge ayarlarında ayarlanır, böylece göstergeyi farklı Blokları görüntüleyen iki grafiğe yükleyebilirsiniz. Gold Venamax farklı ok tampo
Fixed Volume Profile
Carlos Pascual Perez Maturano
This indicator, titled "Fixed Volume Profile.mq5", is a custom tool for MetaTrader 5 (MQL5) designed to calculate and display a Volume Profile over a user-defined fixed time range. The Volume Profile shows the distribution of trading volume at different price levels during a specific period, helping to identify areas of high activity (such as Points of Control or POCs) and volume-based support/resistance areas. Main Functionality: Interactive Range: The indicator creates two vertical lines on
FREE
VSA Smart Engine
Jean Carlos Martins Roso
VSASmartEngine - VSA Volume Intelligence System VSASmartEngine is a technical indicator for MetaTrader 5 based on VSA (Volume Spread Analysis) methodology. The system is designed to provide an objective reading of market activity, helping traders identify aggression, absorption, and exhaustion states by analyzing the relationship between volume and price action. The indicator features a dual-processing architecture, allowing the user to switch between the full VSA logic engine or a simplified h
The Dynamic Market Profile allows you to analyze the volume of any specific chart region manually and instantly. No more being restricted to fixed daily or weekly profiles: you choose the exact move, consolidation, or trend leg you want to analyze . The indicator lets you draw up to 5 independent areas at the same time using interactive rectangles . How It Works on a Daily Basis Create the zone: Press keys 1, 2, 3, 4, or 5 on your keyboard (or use the on-screen buttons) to plot a rectangle . A
Delta Profile Volume
Teresinha Moraes Correia
Technical Description of the Indicator – Delta Profile for MetaTrader 5 The Delta Profile is an indicator developed for MetaTrader 5 focused on detailed analysis of volume flow within a defined range of candles. It organizes and displays information about the imbalance of positive volumes (associated with upward movements) and negative volumes (associated with downward movements) at different price levels. The result is a clear view of the chart points where the highest concentration of trades o
Proxy OrderFlow MT5
Vincent Jose Proenca
Tick-spread dengesizliğine dayalı gösterge. TF: Tüm zaman dilimlerinde çalışır (M1’den D1’e). Parite: Forex, endeksler, altın ve CFD’lerle uyumludur (JPY, Altın ve CFD enstrümanları için otomatik ayar). Ayarlar: TickWindow (200) – tik gözlem penceresi SpreadWeight (1.5) – spread ağırlığı NormalizationPeriod (20) – normalizasyon periyodu (z-score) Overbought / Oversold (±3.0) – uyarı eşikleri AlertCooldown (300s) – uyarılar arasındaki bekleme süresi Sonuç: Proxy Order Flow – Imbalance Tick-Spr
SMC Pro is a chart-window indicator for traders who work with Smart Money Concepts: structure first, then wait for price to return into a high-quality POI. What it shows ZigZag swings on higher-timeframe structure (default H1) and on the chart timeframe BOS (break of structure) and CHoCH (change of character) Equal Highs / Equal Lows (liquidity pools) and an equilibrium midpoint Fair Value Gaps (FVG) filtered by ATR Order Blocks (OB) defined from a strong impulse candle Confluence score: structu
Radar Trade Analytic
Jeverson Rodrigues Ferreira
Radar Trade Analytic 2.0 – MT5 için Kantitatif Panel Radar Trade Analytic nedir? Radar Trade Analytic, Radar Trade ekosisteminin kantitatif modülüdür. Ana grafiğin altında ayrı bir pencerede açılır ve hepsi aynı özel Sigma motoru ile oluşturulmuş dört senkronize katman gösterir; böylece grafikte gördüğünüz ile panelde okuduğunuz arasında doğrudan bir uyum sağlanır. Alım veya satım sinyali yoktur. Hedef yoktur. Uyarı yoktur. Radar Trade Analytic, gerçekten önemli olan verileri düzenler, böy
Here   our more valuable tools SMC Trend Trading   ,  Easy SMC Trading  ,  Institutional SMC Architect Volume Analysis Tools  ,  Volume flow Profile  ,  Market volume profile  , FVG with Volume  , Liquidity Heatmap Profile  ,  Volume Spread Analysis A professional spike pattern indicator built for synthetic traders who scalp and swing Crash 500/300/1000 with precision.  This indicator: Detects powerful 3-candle spike formations (Spike → Pullback → Spike) Automatically draws a clean box a
FREE
Enhanced Volume Profile: The Ultimate Order Flow & Liquidity Analysis Tool Overview Enhanced Volume Profile is an indicator for MetaTrader 5 that displays the traded volume at specific price levels over a defined period. It separates the total volume into buy and sell components, presenting them as a side-by-side histogram on the chart. This allows users to observe the volume distribution and the proportion of buy and sell volumes at each price level. Graphics Rendering The indicator uses the
FREE
Adaptive Volume Profile son çubukların Hacim Profilini doğrudan grafiğin üzerine çizer: Kontrol Noktası (POC), Değer Alanı (VAH / VAL), yüksek hacimli düğümler (HVN), düşük hacimli düğümler (LVN) ve isteğe bağlı hacim histogramı. Fiyat satırlarının boyutu mevcut volatiliteye (ATR) uyum sağlar, böylece profil her sembolde ve zaman diliminde okunabilir kalır. Özellikler POC - penceredeki en yüksek işlem hacmine sahip fiyat seviyesi Value Area (VAH / VAL) - hacmin seçilen payını içeren fiyat aralığ
FREE
Smart SMC FVG
Ekkasawat Pitichalermroch
SMC + Volume Profile + FVG: Indicator Guide Overview SMC + Volume Profile + FVG is an all-in-one indicator for MetaTrader 5. It combines three popular price-action tools on a single chart: Smart Money Concepts (SMC): market structure (swings, BOS, CHoCH) and Order Blocks Fair Value Gaps (FVG): price imbalances left behind by fast moves Volume Profile: where the most trading happened, shown as POC, Value Area High and Value Area Low Everything is drawn automatically. You can turn each part on or
VibeFox Volume Profile — MetaTrader 5 için Volume Profile VibeFox Volume Profile, MetaTrader 5 için eksiksiz bir Volume Profile araç setidir. İşlem gören hacmin fiyat boyunca yatay dağılımını oluşturur, böylece piyasanın en çok nerede aktivite gösterdiğini, nerede ince işlem yaptığını ve hangi fiyat seviyelerinin mıknatıs veya bariyer gibi davranma olasılığı olduğunu anında görürsünüz. Her profil doğrudan grafiğin üzerine çizilir ve modern, fareyle kontrol edilen bir panelden yönetilir — eşelene
Hacim Profili Çok Modlu: Hacmi Göstergenizin Yöntemiyle Değil, Kendi Yönteminizle Analiz Edin. Çoğu Hacim Profili göstergesi, yatırımcıları önceden tanımlanmış analiz aralıklarıyla sınırlandırır. Ancak piyasa sabit şablonlar içinde hareket etmez, öyleyse analiziniz neden öyle olsun ki? Çok Modlu Hacim Profili, hacmin nerede, ne zaman ve nasıl analiz edileceğine karar verme konusunda size tam özgürlük sağlar. Piyasa yapısını inceliyor, işlem seanslarını profillendiriyor, daha yüksek zaman dilimli
Relative Volume Profile (RVP) Stop guessing where the smart money is trading. See the exact price levels that matter. Overview Traditional Volume Profiles tell you where volume occurred, but they leave out a crucial piece of the puzzle: intensity . The Relative Volume Profile (RVP) is a next-generation charting tool that fuses standard price profiling with Relative Volume (RVOL) analysis. Instead of drawing plain, monotone blocks, RVP color-codes every single price level based on aggressive buyi
Technical Analysis Dashboard Pro
Andres Felipe Carvajal Rodriguez
Technical Analysis Dashboard Pro (TADashboard Pro) – Birleşik Teknik Analiz Sistemi TADashboard Pro , birden fazla göstergeyi ( indikatör ) ve zaman dilimini ( timeframe ) tek bir görsel arayüzde birleştiren gelişmiş bir teknik analiz panelidir. Hassasiyet ve verimlilik arayan yatırımcılar ( trader ) için tasarlanan bu sistem, 8 farklı zaman diliminde eş zamanlı olarak 7 osilatör ve 4 hareketli ortalamayı analiz eder ve karar verme sürecini basitleştiren normalize edilmiş puanlar üretir. Temel Ö
FREE
Here   our more valuable tools SMC Trend Trading   ,  Easy SMC Trading  ,  Institutional SMC Architect Volume Analysis Tools  ,  Volume flow Profile  ,  Market volume profile  , FVG with Volume  , Liquidity Heatmap Profile  ,  Volume Spread Analysis The    Liquidity Heatmap   is a sophisticated institutional trading tool designed to reveal where over-leveraged traders are trapped. By calculating estimated liquidation levels based on volume spikes and leverage, this indicator draws a dynamic "h
Spike Phantom
Niccyril Chirindo
1 (1)
Spike Phantom Spike Phantom is a specialized indicator for PainX and GainX synthetic indices that generates trading signals with automatic alert notifications. Features The indicator analyzes market conditions using proprietary algorithms and displays buy/sell arrows directly on the chart. It works specifically with PainX and GainX indices on M5 timeframe. Signal generation combines multiple technical analysis methods to identify potential trading opportunities. The system provides two TP leve
Bu ürünün alıcıları ayrıca şunları da satın alıyor
Trend Sniper X
Sarvarbek Abduvoxobov
4.86 (44)
Trend Sniper X , tüccarların trend yönünü ve olası dönüş noktalarını netlik ve hassasiyetle belirlemelerine yardımcı olan MetaTrader 5 için çoklu zaman dilimli bir trend takip göstergesidir. MT4 için: https://www.mql5.com/en/market/product/193245 Fiyat Bilgisi: Mevcut fiyat tanıtım amaçlıdır ve gelecek güncellemeler ile yeni özellikler yayınlandıkça değişebilir. Bonus Fırsatı: Bu indikatör için ÜCRETSİZ Oto-Trade Assistant EA'yı almak için lütfen satın aldıktan sonra yazara mesaj gönderin. Code
Entry Points Pro, emri vermeden önce nereden gireceğinizi, stopu nereye koyacağınızı ve hangi lotla işlem yapacağınızı gösterir. FİYAT Şu anda 199 USD: bu fiyattan 10 kopya, sonra 249 USD. Nihai fiyat 349 USD. Paramı piyasalarda işlem yaparak kazanıyorum ve bunu gösteriyorum, bu yüzden bu indikatörü herkese satmak zorunda değilim. Bu, kendi kafasıyla düşünen traderlar için bir araç, sihirli bir düğme değil. Kırılım yoksa işlem de yok. Gri ok, iptal edilmiş bir sinyaldir: fiyat sinyal mumunu kır
Ultra Indicator
Ihor Otkydach
5 (1)
ULTRA, “hepsi bir arada” prensibiyle çalışan bir teknik göstergedir; piyasayı bağımsız olarak analiz eder, işlem sinyalleri üretir, stop-loss emirlerinin verileceği seviyeleri gösterir ve kârı garantilemek ya da zararı en aza indirmek için işlemlerin ne zaman kapatılması gerektiğini önerir. Başka bir deyişle, piyasayı nasıl analiz edeceğinizi bilmeseniz, seviyeleri (stop-loss'unuzu nereye koyacağınızı) belirleyemeseniz ya da para yönetimi konusunda zorluk yaşasanız da fark etmez. ULTRA tüm bunla
Gann Made Easy , bay teorisini kullanarak ticaretin en iyi ilkelerine dayanan, profesyonel ve kullanımı kolay bir Forex ticaret sistemidir. WD Gann. Gösterge, Zararı Durdur ve Kâr Al Seviyeleri dahil olmak üzere doğru SATIN AL ve SAT sinyalleri sağlar. PUSH bildirimlerini kullanarak hareket halindeyken bile işlem yapabilirsiniz. Satın alma işleminden sonra, alım satım talimatlarını ve harika ek göstergeleri ücretsiz olarak almak için lütfen benimle iletişime geçin! Muhtemelen Gann ticaret yöntem
Boba Analysis Suite
Trade Ready Solutions LLC
5 (2)
Boba Analysis Suite Boba Analysis Suite, MetaTrader 5 için geliştirilmiş bir analiz göstergesidir. Piyasa yapısını, önemli fiyat bölgelerini ve genel piyasa bağlamını tek bir grafik görünümünde bir araya getirir. Trader ve trading eğitmeni olarak edinilen uygulamalı deneyimden yola çıkarak geliştirilmiştir. Piyasanın yönünü değerlendirme, önemli seviyeleri belirleme ve birden fazla zaman dilimini birlikte inceleme gibi adımlardan oluşan sistematik bir analiz sürecini destekler. Piyasa Bağlamını
M1 Sniper MT5
Oleg Rodin
5 (7)
M1 SNIPER   kullanımı kolay bir işlem göstergesi sistemidir. M1 zaman dilimi için tasarlanmış bir ok göstergesidir. Gösterge, M1 zaman diliminde scalping için bağımsız bir sistem olarak kullanılabilir ve mevcut işlem sisteminizin bir parçası olarak kullanılabilir. Bu işlem sistemi özellikle M1'de işlem yapmak için tasarlanmış olsa da, diğer zaman dilimleriyle de kullanılabilir. Başlangıçta bu yöntemi XAUUSD ve BTCUSD ticareti için tasarladım. Ancak bu yöntemi diğer piyasalarda işlem yaparken de
FiboSniper Pro
Van Minh Nguyen
5 (4)
FiboSniper Pro – Multi-Filter Fibonacci System with Auto SL/TP and Control Panel FiboSniper Pro, seçilmiş Buy ve Sell sinyalleri üretmek için dinamik Fibonacci Envelopes ile birden fazla doğrulama filtresini birleştiren teknik bir göstergedir. Fibonacci seviyeleri Moving Average ve ATR temel alınarak hesaplanır ve ardından ADX, EMA, RSI, ATR, Volume, Time ve Candle yapısı ile filtrelenir. Gösterge, ATR tabanlı otomatik Stop Loss ve Take Profit seviyelerini doğrudan grafik üzerinde görüntüler ve
Auto Optimized SpeedAngle , sürekli İleriye Dönük Optimizasyon (Walk-Forward Optimization, WFO) yoluyla eğri uydurmayı (curve-fitting) ortadan kaldıran kurumsal düzeyde bir momentum vektörleme sistemidir. Piyasa rejimleri değiştiğinde etkinliğini yitiren statik girdilere güvenmek yerine, gösterge, örneklem dışı (Out-of-Sample, OOS) doğrulama kullanarak parametrelerini dinamik olarak yeniden kalibre eder ve böylece gösterilen sinyallerin geçmişteki rastgele anomalileri değil, gerçek bir istatisti
Sqn Max Indicator Sqn Max is an exclusive indicator to trade the market with high effectiveness. The indicator is based on price action, volatility and trend. This indicator is as simple as possible but not too simple. The indicator can generate alerts to ease the trading process. You don't have to stay all day in front of your screen. The indicator can be used with any class of assets and with any time frame. It is possible to achieve better results trading our list of selected assets. We achi
SIO Oscillator: Kendi Kendini Optimize Eden Yarı Varyans Dengesizlik Osilatörü İndikatörü satın alın, ona dayalı Uzman Danışmanı (EA) ÜCRETSİZ edinin. Çoğu osilatör, tüm fiyat hareketlerini aynı şekilde değerlendirir. SIO ise yükseliş ve düşüş baskısını birbirinden ayırır ve aralarındaki dengesizliği ölçerek piyasayı gerçekte kimin kontrol ettiğini gösterir: alıcılar mı, satıcılar mı. Dengesizlik bir uç noktaya ulaştığında SIO, giriş, Stop Loss ve Take Profit seviyeleriyle birlikte net bir sinya
Power Candles MT5
Daniel Stein
4.58 (12)
Power Candles V3 - Kendi Kendini Optimize Eden Güç Göstergesi Power Candles V3, döviz ve enstrüman gücünü, eklendiği her grafikte eyleme geçirilebilir bir ticaret planına dönüştürür. Sadece mumları renklendirmek yerine, arka planda canlı bir otomatik optimizasyon çalıştırır ve önünüzdeki sembol için en iyi Stop Loss, Take Profit ve sinyal eşiğini size sunar. Tek bir tıklama ile canlı ticarete uyarlanır - giriş, Stop Loss ve Take Profit ışınları grafikte tam fiyatlarla görünür ve uyarılar yön bil
Astral Structure
Ottaviano De Cicco
Astral Structure Kurulumu değerlendirin. İlk planı görün. Lansmana özel - $99. Lansman sonrasında $149. Bir piyasa yapısı kurulumu birkaç soruyu birlikte getirir: Geniş görünüm uyumlu mu, stop referansı nerede ve hedefler nasıl tanımlanıyor? Astral Structure, kararlarını piyasa yapısına dayandıran takdire dayalı yatırımcılar için bu soruları tek çalışma alanında toplar. İlgili kuruluma odaklanın. En son uygun kurulumu, yönünü ve koşulları karşılayıp karşılamadığını birlikte inceleyin. Zaman dili
Çoklu Para Birimi Güç ve Momentum Göstergesi MT5 Dynamic Forex28 Navigator, uzun süredir popüler olan göstergelerimizin evrimidir ve beşinin gücünü bir arada sunar: Advanced Currency Strength28 Indicator (700 inceleme) Advanced Currency IMPULSE with ALERT (530 inceleme) Currency Strength EXOTICS GOLD Impulse with Alert CS28 Combo Signals (son Bonus) Dört gösterge satın alıp grafiklerinizde üst üste yığmanıza gerek yok. Hepsi tek bir güçlü göstergede birleşiyor: 28 Forex paritesinin gücü, onları
Scalper Vault, gün içi işlemlerde istikrar yakalamak isteyen yatırımcılar için tasarlanmış, güçlü ve tam donanımlı bir alım satım sistemidir. Bu yüksek hassasiyetli gösterge; hem Forex hem de İkili Opsiyon yatırımcıları için kurumsal düzeyde analizler sunan, bağımsız ve eksiksiz bir alım satım sistemi işlevi görür. SATIN ALIM İŞLEMİNDEN SONRA BENİMLE İLETİŞİME GEÇİN; ALIM SATIM İPUÇLARIMI VE HARİKA BİR BONUSU ALIN! Tahmin yürütme zorunluluğunu ve karmaşık manuel analiz süreçlerini ortadan kaldı
Azimuth Pro
Ottaviano De Cicco
5 (7)
Azimuth Pro V2: Synthetic Fractal Structure and Confirmed Entries for MT5 Overview Azimuth Pro is a multi-level swing structure indicator by Merkava Labs . Four nested swing layers, swing-anchored VWAP, ABC pattern detection, three-timeframe structural filtering, and closed-bar confirmed entries — one chart, one workflow from micro-swings to macro-cycles. This is not a blind signal product. It is a structure-first workflow for traders who care about location, context, and timing. Halloween P
Neuro Poseidon MT5
Daria Rezueva
4.68 (53)
Neuro Poseidon is a new indicator by Daria Rezueva. It combines precise trading signals with adaptive TP/SL levels - creating best possible trades as a result! Message me and get  Neuro Poseidon Assistant  as a gift to automize your trading process! What makes it stand out? 1. Proven profitability on all assets and timeframes 2. Only confirmed BUY and SELL signals present on the chart 3. Adaptive TP & SL levels generated by the software for each trade 4. Easy to understand - suitable for al
Adaptive Price Action Engine Göstergeyi al, EA'sı (Uzman Danışman) bedava gelsin Kendi Kendini Optimize Eden Multi-Timeframe Trend ve Mum Formasyonu Analizi Piyasalar sürekli değişir ve her Price Action formasyonu her piyasa koşulunda aynı değere sahip değildir. Adaptive Price Action Engine , değişen piyasa koşullarına uyum sağlamak amacıyla trend yapısını, Multi-Timeframe analizini, mum formasyonlarını ve istatistiksel optimizasyonu tek bir analiz sistemi içerisinde birleştirir. İki Adaptif Mod
Protect against whipsaws: revolutionize your swing trading approach Swing Trading is the first indicator designed to detect swings in the direction of the trend and possible reversal swings. It uses the baseline swing trading approach, widely described in trading literature. The indicator studies several price and time vectors to track the aggregate trend direction and detects situations in which the market is oversold or overbought and ready to correct. [ Installation Guide | Update Guide | Tro
Advance AI Scanner
Mohamed Samsudeen
5 (1)
Advance AI Scanner is a multi-symbol analysis indicator for MetaTrader 5. It scans Forex pairs, metals, energy, stock indices and cryptocurrencies at the same time and rates each instrument with its own self-training model. It explains in plain English what moved each market and why, and it estimates how far upcoming economic news usually moves each symbol, measured on your broker's own price history. $199 instead of $499. 10 copies left at this price. One time purchase  Installation and User
Apex Patterns PRO İndikatörü Satın Alın - Üzerine Kurulu Expert Advisor'a ÜCRETSİZ Sahip Olun. Kendini Optimize Eden Grafik Formasyonu ve Kırılım Zekası Geleneksel formasyon tarayıcıları sabit girdilere dayanır ve piyasa volatilitesi ile yapıları değiştiğinde genellikle düşük performans gösterir. Apex Patterns PRO, yapısal grafik formasyon tanımayı, momentum filtrelemeyi ve istatistiksel kendi kendini optimizasyonu tek bir analitik çerçevede birleştirerek değişen piyasa koşullarına uyum sağlama
Advanced Supply Demand MT5
Bernhard Schweigert
4.53 (15)
Herhangi bir Acemi veya Uzman Tüccar için En İyi Çözüm! Bu gösterge benzersiz, yüksek kaliteli ve uygun fiyatlı bir ticaret aracıdır çünkü bir dizi tescilli özelliği ve yeni bir formülü bir araya getirdik. Bu güncelleme ile çift zaman dilimi dilimlerini gösterebileceksiniz. Yalnızca daha yüksek bir TF gösteremeyeceksiniz, aynı zamanda TF grafiğini ve ARTIK daha yüksek TF'yi de gösterebileceksiniz: YUVARLAK BÖLGELERİ GÖSTERMEK. Tüm Arz Talebi tüccarları buna bayılacak. :) Önemli Bilgiler Açıkland
Superhero
Ihor Otkydach
5 (3)
SUPERHERO göstergesi, "her şeyi kapsayan" bir temele dayalı olarak tasarlanmış çoklu para birimli bir işlem sistemidir. Gösterge, piyasayı bağımsız olarak analiz eder ve işlemlerin ne zaman açılıp kapatılacağına dair sinyaller verir. Stop Loss ve Take Profit emirlerini kullanır. R:R oranı 1:1'dir. Bu sistem akıllı telefonunuza anlık bildirimler gönderebilir; böylece bir bilgisayara bağlı kalmanıza gerek kalmadan "hareket halindeyken" işlem yapabilirsiniz. Bu, özel ticaret şirketleri için idealdi
Bill Williams Advanced
Siarhei Vashchylka
5 (11)
Bill Williams Advanced is designed for automatic chart analysis using Bill Williams' "Profitunity" system. The indicator analyzes four timeframes at once. Manual (Be sure to read before purchasing) Advantages 1. Analyzes the chart using Bill Williams' "Profitunity" system. Signals are displayed in a table in the corner of the screen and on the price chart. 2. Finds all known AO and AC signals, as well as zone signals. Equipped with a trend filter based on the Alligator. 3. Finds "Divergence Bar
Naked Forex Kangaroo Tail Pro Indicator Kangaroo Tail Pro Indicator is a pattern recognition indicator for Forex, Stocks, Indices, Futures, Commodities and Cryptos. The Kangaroo Tail is a multi-bar pattern. The Kangaroo Tail pattern is very effective and is very simple to trade. The strategy that comes with the Kangaroo Tail is based on price action. The indicator does what it was designed for: displaying Kangaroo Tail patterns.     Don't expect to follow the up and down arrows and make mone
Murrey Math Classic
Sarvarbek Abduvoxobov
5 (2)
Murrey Math Classic Murrey Math Classic , finansal piyasalardaki fiyat hareketlerini matematiksel bir kesinlikle tahmin etmek için tasarlanmış profesyonel ve dinamik bir ticaret (trading) indikatörüdür. Sistem, efsanevi fiyat-zaman geometrisini modernize ederek, günümüz finansal piyasalarına uygun, son derece yapılandırılmış bir matematiksel modele dönüştürür. Murrey Math'in arkasındaki temel mantık, finansal piyasaların rastgele hareket etmediği; belirli bir ritimle hareket ettiğidir. Müziğin b
Volatility Master for MetaTrader is a real-time dashboard tool that scans up to  50 symbols  to identify high-volatility , trending markets instantly. With bullish/bearish signals, customizable alerts, and a user-friendly interface, it helps you avoid range-bound conditions and focus on high-probability trades. Clarity leads to confidence. Trade confidently and protect your capital effectively with this powerful dashboard. We don't offer free or bonus indicators in exchange of reviews from you.
Divergence Bomber
Ihor Otkydach
4.89 (94)
Bu göstergeyi satın alan herkese aşağıdaki ekstra içerikler ücretsiz olarak sunulmaktadır: Her işlemi otomatik olarak yöneten, Stop Loss ve Take Profit seviyelerini ayarlayan ve işlemleri strateji kurallarına göre kapatan özel yardımcı araç: "Bomber Utility" Göstergenin farklı varlıklar üzerinde kullanılmasına yönelik ayar dosyaları (set dosyaları) Bomber Utility için 3 farklı modda kullanım sunan ayar dosyaları: "Minimum Risk", "Dengeli Risk" ve "Bekle-Gör Stratejisi" Bu ticaret stratejisini
FX Sniper Orange Indicator FX Sniper Orange is an exclusive indicator to spot situations where market has gone too far and market could reverse soon after. The indicator displays arrows in your chart indicating probable future price action (see screenshot attached). FX Sniper Orange never repaints. Once candle is closed signal is confirmed and arrow will never disappear. Users of the indicator can setup alerts when new arrows are displayed in the chart. Inputs of the indicator are: Distanc
Currency Strength Wizard , başarılı ticaret için size hepsi bir arada çözüm sağlayan çok güçlü bir göstergedir. Gösterge, birden çok zaman dilimindeki tüm para birimlerinin verilerini kullanarak şu veya bu forex çiftinin gücünü hesaplar. Bu veriler, şu veya bu para biriminin gücünü görmek için kullanabileceğiniz, kullanımı kolay para birimi endeksi ve para birimi güç hatları biçiminde temsil edilir. İhtiyacınız olan tek şey, işlem yapmak istediğiniz tabloya göstergeyi eklemektir ve gösterge size
ARIPoint
Temirlan Kdyrkhan
1 (4)
ARIPoint is a powerful trading companion designed to generate high-probability entry signals with dynamic TP/SL/DP levels based on volatility. Built-in performance tracking shows win/loss stats, PP1/PP2 hits, and success rates all updated live. Key Features: Buy/Sell signals with adaptive volatility bands Real-time TP/SL/DP levels based on ATR Built-in MA Filter with optional ATR/StdDev volatility Performance stats panel (Success, Profit/Loss, PP1/PP2) Alerts via popup, sound, push, or email Cu
Yazarın diğer ürünleri
SEE THE TREND ON EVERY TIME FRAME. INTELLIGENT INDICATOR READS PRICE ACTION TO SPOT TRUE MARKET CYCLES AND TREND. This advanced multi-currency and multi-time frame indicator,   reads trend in real-time   so you always know the trends of the markets   you want to trade.  ​Trend-Viewer Pro has been specifically designed to read the trend of   every time frame   and   every market , simultaneously, making it much easier for you to find markets with   time frame correlation , so you can focus on th
Cycle Finder Pro
Raymond Gilmour
5 (11)
## THE CHART, READ FOR YOU. Chart reading is slow, and it is easy to get wrong. You need to know which highs and lows actually matter, which ones the market has already invalidated, and what the ones that remain are telling you. Miss a point and the whole read changes. Cycle Finder Pro marks TRUE highs and lows, and nothing else. A high is confirmed when two subsequent bars each take out the low beneath them. A low when two take out the high above. The bars need not be consecutive — the marke
Currency Strength Matrix
Raymond Gilmour
4.5 (26)
THE ONLY CURRENCY STRENGTH INDICATOR BUILT ON PRICE ACTION Most currency strength meters average an oscillator, or measure how far price has travelled. But these are not accurate measures of trend, Currency Strength Matrix measures trend strength, not just if a currency price has gone up or down. Currency Strength Matrix reads market structure . For each of the 28 major pairs it finds the confirmed cycle highs and lows, and decides whether that pair is in an uptrend, a downtrend, or neither. A
CycleFinderPro
Raymond Gilmour
5 (1)
## THE CHART, READ FOR YOU. Chart reading is slow, and it is easy to get wrong. You need to know which highs and lows actually matter, which ones the market has already invalidated, and what the ones that remain are telling you. Miss a point and the whole read changes. Cycle Finder Pro marks TRUE highs and lows, and nothing else. A high is confirmed when two subsequent bars each take out the low beneath them. A low when two take out the high above. The bars need not be consecutive — the marke
Trend Viewer Pro
Raymond Gilmour
5 (4)
EVERY MARKET YOU FOLLOW, ON YOUR TIMEFRAMES, IN ONE TABLE If you follow the trend on more than one timeframe, checking every market chart by chart is  slow, and it is easy to miss one. Trend Viewer Pro reads it for you. For every market on your list it shows the trend on up  to three timeframes of your choosing, in one table on any chart, and sums each market up in  a single word: **STRONG**, **BULL**, **BEAR** or **MIXED**. Every reading is Cycle Finder Pro's. A high is confirmed when two late
Filtrele:
Değerlendirme yok
Değerlendirmeye yanıt