Currency Strength Matrix MT5

THE ONLY CURRENCY STRENGTH INDICATOR BUILT ON PRICE ACTION


Most currency strength meters average an oscillator, or measure how far price has travelled. But these are not accurate measures of trend, Currency Strength Matrix measures trend strength, not just if a currency price has gone up or down.

Currency Strength Matrix reads market structure. For each of the 28 major pairs it finds the confirmed cycle highs and lows, and decides whether that pair is in an uptrend, a downtrend, or neither. A currency's score is simply the number of pairs it is beating minus the number it is losing to.


+7 is the maximum + score and means that currency is in an uptrend against all seven other majors. -7 means the opposite.

Because it reads structure rather than just price changes, a score only changes when the market CHANGES TREND.


THE TOTAL COLUMN

Strength is the score on your chart's timeframe. Total is the sum of the scores across the three timeframes you choose — H1, H4 and D1 by default. One number, from -21 to +21, that tells you whether a currency is strong everywhere or strong in only one place.

It sounds trivial but it stops one of the biggest causes of bad trades, taking a trend trade which is actually against the trend of another time frame. This helps to separate trades that work from trades that fight the market. Look at a real reading:

Currency Strength (D1) Total
AUD +4 +6
CAD +3 +3
JPY +3 -1
USD +2 +10
NZD -4 -17


On the daily alone, JPY (+3) looks stronger than USD (+2). The Total says the opposite. USD is +10 — it is being bought on the hourly, the four-hour and the daily at once. JPY is -1 — its daily strength is running against the shorter timeframes, which is exactly the kind of move that stalls.

And NZD at -17 out of a possible -21 is weak on every timeframe there is. So the trade the board is pointing at is not the one the daily column suggests. Pair the strongest Total against the weakest Total and you are trading with every timeframe you look at, not just the one on your screen.

Strength tells you what is happening now. Total tells you whether it is likely to continue.


WHAT YOU GET

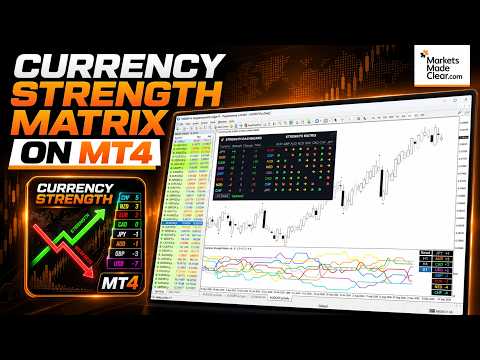
The dashboard — all eight currencies, sorted strongest to weakest automatically. Strength on your chart's timeframe, Change since the trading day opened, and the Total across your three timeframes.

The strength matrix — every one of the 28 pairings in a single grid. An arrow shows which side is winning: up if the row currency is beating the column currency, down if it is losing, sideways if there is no trend. Reading down a column shows you at a glance exactly which pairs are driving a currency's score. Collapse it with one click when you want the chart space back.

Strength history — the scores plotted for the last 200 bars, not just this moment. You can see which currency has been building strength for a week and which one turned this morning. Click any currency to isolate its line, or hide the ones you don't care about.

Timeframe buttons — inspect the H1, H4 or D1 picture without changing your chart. The chart stays where it is; only the panel and the lines switch.

Cycle markers on your chart — the confirmed highs and lows the scores are actually built from, drawn on the symbol you are looking at, plus its own trend reading. Nothing is hidden: you can see the structure behind every number.

Change since the day opened — who has gained and who has given ground today, measured from the broker's daily open.


FAST

The whole board — 28 pairs across four timeframes — is rebuilt from scratch in a few milliseconds. Switch symbol or timeframe and it is simply there.


SETTINGS

Total: timeframe 1 / 2 / 3 — the three timeframes that make up the Total column. H1, H4 and D1 by default. Set them to whatever you trade.

Bars of strength history — how much history to draw and to read structure from. Default 200.

Oversized bar threshold (x ATR) — bars far larger than average are news, not structure, and are handled separately so a single spike cannot invent a trend. Default 2.2. Raise it to treat fewer bars as oversized, lower it to treat more.

ATR period — default 14.

Marker offset, pips — how far the cycle markers sit from the high or low. Default 2. Cosmetic only; it does not affect any score.

Broker suffix — advanced. Leave blank and the indicator works out your broker's naming from EURUSD (".p", ".raw", ".m" and so on). Only set it if your broker uses more than one variant of the same pair.

Panel — show or hide it, position, font size (everything scales from it), background and text colour, and whether the sorted list and buttons appear in the strength window.

Markers — show or hide, high and low colours, size.

Strength line width and the eight currency colours — set these here in the Inputs tab, not the Colors tab, so they survive a timeframe change.


HOW TO TRADE IT

  1. Trade the extremes. Pair a currency with a high positive Total against one with a high negative Total. Both timeframes and structure agree; you are going with the market, not predicting it.
  2. Trade the crossings. When two currencies cross the zero line in opposite directions, the pair between them is changing hands. The strength history makes these easy to spot as they form.
  3. Trade the early turn. A strong currency losing strength against a weak one gaining it is the earliest, most aggressive entry the board offers — and the Total column tells you whether the bigger picture supports it or not.
  4. Use Total as a filter. Before taking any of the above, check the Total. Strength without Total is a short-term move inside a bigger trend going the other way.

REQUIREMENTS

MetaTrader 5. Works on any chart — forex, indices, metals — since the strength is always computed from the 28 major pairs regardless of what you are looking at. Your broker must offer the 28 major pairs for a complete board; the panel tells you if any are missing.


WHAT'S NEW IN v6

  • Total column across three timeframes of your choosing.
  • Strength matrix — all 28 pairings as a grid of arrows, collapsible.
  • Strength history for the last 200 bars, with click-to-isolate on any currency.
  • Timeframe buttons — see another timeframe without leaving your chart.
  • Cycle markers drawn on the chart, showing the structure behind the scores.
  • Change since the daily open.
  • Rebuilt calculation engine. The full board now takes milliseconds instead of minutes. Symbol and timeframe switching is instant and there is no background load.
  • Scales correctly on high-DPI displays.
Prodotti consigliati
La Master Edition è uno strumento analitico di livello professionale progettato per visualizzare la struttura del mercato attraverso l'obiettivo del volume e del flusso di denaro. A differenza degli indicatori di volume standard, questo strumento visualizza un Profilo di Volume Giornaliero direttamente sul tuo grafico, permettendoti di vedere esattamente dove si è verificata la scoperta dei prezzi e dove è posizionato il "denaro intelligente". Questa Master Edition è progettata per chiarezza e v
Advanced Volume Profile
Henry Armando Baltazar
Advanced Volume Profile Liquidity Analysis via Custom Area Selection The Advanced Manual Volume Profile is a precision tool for MetaTrader 5 designed to deconstruct market structure through price-level volume analysis. Unlike static profiles, this indicator exclusively processes the price and time range defined by the user via a rectangle object, offering a surgical view of the market auction. Elite Technical Specifications Dynamic Algorithm: Real-time calculation (400ms refresh rate) based on t
FREE
Ospe POC Volume Profile
Nur Azureen Binti Ab Aziz
A volume-at-price heatmap with POC, value area, estimated buy/sell pressure, confirmed signals and alerts. POC Volume Profile Heatmap is a MetaTrader 5 indicator that organizes historical volume across price levels. It identifies the Point of Control, displays the selected value area, and estimates buying and selling pressure at the POC. The indicator is intended for traders who use volume-at-price structure to study acceptance, rejection and interaction around high-activity price levels. It c
FREE
Volume Profile OrderFlow Suite puts volume profiles, VWAP and tick order flow on one MetaTrader 5 chart, with one panel. It also measures how price actually reacted at the profile levels on your symbol, so you can see from your broker's own data whether a level has been worth watching. The panel always shows which data is used. Forex and CFD symbols in MT5 only have tick volume (the number of price changes), so on those symbols the buy/sell side is an estimate. Symbols with exchange trades use r
Makito NASDAQ
Riel Arthur Soliven
Makito NASDAQ is a professional market-analysis indicator for MetaTrader 5 designed for NASDAQ traders. It combines market structure, higher-timeframe trend, Mag7 stock participation, support and resistance, VIX sentiment, liquidity behavior, and multi-timeframe buying and selling pressure into one organized on-chart panel. The indicator summarizes current conditions with a simple: BUY – bullish conditions have sufficient alignment SELL – bearish conditions have sufficient alignment HOLD – confi
Correlation Matrix Pro - Scanner Multi-Valuta per Copertura Comprendi le relazioni tra le coppie di valute in tempo reale! Un potente strumento di analisi che ti aiuta a visualizzare le relazioni statistiche tra fino a 6 coppie di valute contemporaneamente. Perfetto per la gestione del portafoglio, la diversificazione del rischio e le strategie di copertura. CARATTERISTICHE PRINCIPALI - Correlazione di Pearson in tempo reale con rendimenti logaritmici - Monitoraggio di fino a 6 coppie di valute
FREE
Daily & Composite Volume Profile   This is a professional-grade market profile tool designed for MetaTrader 5. It utilizes a   Dual-Profile System   to visualize supply, demand, and liquidity concentrations. Key Features Left Side: Daily Session Profiles Automatically identifies the start and end of every trading day. Generates a unique Volume Profile for each individual day. Allows you to see how value migrated from yesterday to today (e.g., Is today's volume higher or lower than yesterday?).
Spike Blast Pro
Israr Hussain Shah
Here   our more valuable tools SMC Trend Trading   ,  Easy SMC Trading  ,  Institutional SMC Architect Volume Analysis Tools  ,  Volume flow Profile  ,  Market volume profile  , FVG with Volume  , Liquidity Heatmap Profile  ,  Volume Spread Analysis Spike Blaster Pro is a next-generation MT5 indicator designed specifically for synthetic markets. It works seamlessly on Boom Index and Weltrade Index , providing traders with sharp, reliable spike detection signals. What makes Spike Blaster Pro po
RSI Currency Strength Meter is a powerful and elegant multi-currency indicator that measures the real-time relative strength of the 8 major currencies using RSI logic. By calculating the smoothed performance of each currency across its major pairs and applying the RSI formula, it delivers clean and responsive strength lines that make it easy to spot which currencies are truly strong or weak at any moment. This indicator is particularly useful for visualizing currency correlations and divergence
Volume Profile FREE — Multi-Session Heatmap (POC · VAH · VAL) See where trading activity actually occurs—not just where price moves. This indicator builds a clear, color-coded Volume Profile Heatmap directly on your chart and highlights the market's most important price levels: the Point of Control (POC) and the Value Area (VAH/VAL) , where price is most likely to react.
FREE
Here   our more valuable tools SMC Trend Trading   ,  Easy SMC Trading  ,  Institutional SMC Architect Volume Analysis Tools  ,  Volume flow Profile  ,  Market volume profile  , FVG with Volume  , Liquidity Heatmap Profile  ,  Volume Spread Analysis Automatically detects major swing points not internal noise Generates buy/sell signals at key Fibonacci levels Displays professional GUI panel with real-time analysis Marks major swings with visual indicators Trading Strategy BUY at 38.2%-61.8% Fib
FREE
Here   our more valuable tools SMC Trend Trading   ,  Easy SMC Trading  ,  Institutional SMC Architect Volume Analysis Tools  ,  Volume flow Profile  ,  Market volume profile  , FVG with Volume  , Liquidity Heatmap Profile  ,  Volume Spread Analysis 1. Institutional Supply & Demand Zones Auto-Detection:   Automatically draws zones at valid pivot points. Smart Extension:   Zones extend into the future for easy visibility but automatically cut off when price breaks them. Mitigation Logic:   When
Gold Venamax MT5
Sergei Linskii
3.5 (2)
Gold Venamax : questo è il miglior indicatore tecnico azionario. L'algoritmo dell'indicatore analizza il movimento dei prezzi di un asset e riflette la volatilità e le potenziali zone di ingresso. Caratteristiche dell'indicatore: Questo è un super indicatore con Magic e due blocchi di frecce di tendenza per un trading comodo e redditizio. Sul grafico viene visualizzato il pulsante rosso per cambiare blocco. Magic è impostato nelle impostazioni dell'indicatore, in modo da poter installare l'indi
Fixed Volume Profile
Carlos Pascual Perez Maturano
This indicator, titled "Fixed Volume Profile.mq5", is a custom tool for MetaTrader 5 (MQL5) designed to calculate and display a Volume Profile over a user-defined fixed time range. The Volume Profile shows the distribution of trading volume at different price levels during a specific period, helping to identify areas of high activity (such as Points of Control or POCs) and volume-based support/resistance areas. Main Functionality: Interactive Range: The indicator creates two vertical lines on
FREE
VSA Smart Engine
Jean Carlos Martins Roso
VSASmartEngine - VSA Volume Intelligence System VSASmartEngine is a technical indicator for MetaTrader 5 based on VSA (Volume Spread Analysis) methodology. The system is designed to provide an objective reading of market activity, helping traders identify aggression, absorption, and exhaustion states by analyzing the relationship between volume and price action. The indicator features a dual-processing architecture, allowing the user to switch between the full VSA logic engine or a simplified h
The Dynamic Market Profile allows you to analyze the volume of any specific chart region manually and instantly. No more being restricted to fixed daily or weekly profiles: you choose the exact move, consolidation, or trend leg you want to analyze . The indicator lets you draw up to 5 independent areas at the same time using interactive rectangles . How It Works on a Daily Basis Create the zone: Press keys 1, 2, 3, 4, or 5 on your keyboard (or use the on-screen buttons) to plot a rectangle . A
Delta Profile Volume
Teresinha Moraes Correia
Technical Description of the Indicator – Delta Profile for MetaTrader 5 The Delta Profile is an indicator developed for MetaTrader 5 focused on detailed analysis of volume flow within a defined range of candles. It organizes and displays information about the imbalance of positive volumes (associated with upward movements) and negative volumes (associated with downward movements) at different price levels. The result is a clear view of the chart points where the highest concentration of trades o
Proxy OrderFlow MT5
Vincent Jose Proenca
Indicatore basato sul disequilibrio del tick-spread. TF: Funziona su tutti i timeframe (da M1 a D1). Coppie: Compatibile con Forex, indici, oro e CFD (regolazione automatica per JPY, Oro e CFD). Impostazioni: TickWindow (200) – finestra di osservazione dei tick SpreadWeight (1.5) – peso dello spread NormalizationPeriod (20) – periodo di normalizzazione (z-score) Overbought / Oversold (±3.0) – soglie di allerta AlertCooldown (300s) – tempo di raffreddamento tra gli avvisi Conclusione: Proxy Or
SMCtarget
Zheng Quan He
SMC Pro is a chart-window indicator for traders who work with Smart Money Concepts: structure first, then wait for price to return into a high-quality POI. What it shows ZigZag swings on higher-timeframe structure (default H1) and on the chart timeframe BOS (break of structure) and CHoCH (change of character) Equal Highs / Equal Lows (liquidity pools) and an equilibrium midpoint Fair Value Gaps (FVG) filtered by ATR Order Blocks (OB) defined from a strong impulse candle Confluence score: structu
Radar Trade Analytic
Jeverson Rodrigues Ferreira
Radar Trade Analytic 2.0 – Pannello Quantitativo per MT5 Cos'è Radar Trade Analytic? Radar Trade Analytic è il modulo quantitativo dell'ecosistema Radar Trade. Si apre in una finestra separata sotto il grafico principale e mostra quattro livelli sincronizzati, tutti costruiti con lo stesso motore proprietario Sigma, garantendo una corrispondenza diretta tra ciò che vedi sul grafico e ciò che leggi nel pannello. Nessun segnale di acquisto o vendita. Nessun target. Nessun alert. Radar Trade
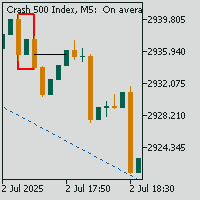
Here   our more valuable tools SMC Trend Trading   ,  Easy SMC Trading  ,  Institutional SMC Architect Volume Analysis Tools  ,  Volume flow Profile  ,  Market volume profile  , FVG with Volume  , Liquidity Heatmap Profile  ,  Volume Spread Analysis A professional spike pattern indicator built for synthetic traders who scalp and swing Crash 500/300/1000 with precision.  This indicator: Detects powerful 3-candle spike formations (Spike → Pullback → Spike) Automatically draws a clean box a
FREE
Enhanced Volume Profile: The Ultimate Order Flow & Liquidity Analysis Tool Overview Enhanced Volume Profile is an indicator for MetaTrader 5 that displays the traded volume at specific price levels over a defined period. It separates the total volume into buy and sell components, presenting them as a side-by-side histogram on the chart. This allows users to observe the volume distribution and the proportion of buy and sell volumes at each price level. Graphics Rendering The indicator uses the
FREE
Adaptive Volume Profile disegna il Volume Profile delle ultime barre direttamente sul grafico: il Point of Control (POC), la Value Area (VAH / VAL), i nodi ad alto volume (HVN), i nodi a basso volume (LVN) e un istogramma del volume opzionale. La dimensione delle righe di prezzo si adatta alla volatilità corrente (ATR), così il profilo resta leggibile su qualsiasi simbolo e timeframe. Caratteristiche POC - il livello di prezzo con il maggior volume scambiato nella finestra Value Area (VAH / VAL)
FREE
Smart SMC FVG
Ekkasawat Pitichalermroch
SMC + Volume Profile + FVG: Indicator Guide Overview SMC + Volume Profile + FVG is an all-in-one indicator for MetaTrader 5. It combines three popular price-action tools on a single chart: Smart Money Concepts (SMC): market structure (swings, BOS, CHoCH) and Order Blocks Fair Value Gaps (FVG): price imbalances left behind by fast moves Volume Profile: where the most trading happened, shown as POC, Value Area High and Value Area Low Everything is drawn automatically. You can turn each part on or
VibeFox Volume Profile — Volume Profile per MetaTrader 5 VibeFox Volume Profile è un set di strumenti completo di Volume Profile per MetaTrader 5. Costruisce la distribuzione orizzontale del volume scambiato lungo il prezzo, così puoi vedere istantaneamente dove il mercato ha concentrato la maggiore attività, dove ha scambiato poco e quali livelli di prezzo agiranno probabilmente come magneti o barriere. Ogni profilo viene disegnato direttamente sul grafico e controllato da un pannello moderno,
Profilo di volume multimodale: analizza il volume a modo tuo, non a modo del tuo indicatore. La maggior parte degli indicatori Volume Profile limita i trader a intervalli di analisi predefiniti. Ma il mercato non si muove all'interno di schemi fissi, quindi perché dovrebbe farlo la tua analisi? Volume Profile Multi-Mode ti offre la massima libertà di decidere dove, quando e come analizzare i volumi. Che tu stia studiando la struttura del mercato, profilando le sessioni di trading, monitorando l'
Relative Volume Profile (RVP) Stop guessing where the smart money is trading. See the exact price levels that matter. Overview Traditional Volume Profiles tell you where volume occurred, but they leave out a crucial piece of the puzzle: intensity . The Relative Volume Profile (RVP) is a next-generation charting tool that fuses standard price profiling with Relative Volume (RVOL) analysis. Instead of drawing plain, monotone blocks, RVP color-codes every single price level based on aggressive buyi
Technical Analysis Dashboard Pro
Andres Felipe Carvajal Rodriguez
Technical Analysis Dashboard Pro (TADashboard Pro) – Sistema Unificato di Analisi Tecnica TADashboard Pro è un pannello di analisi tecnica avanzato che consolida più indicatori e timeframe in un'unica interfaccia visiva. Progettato per i trader che richiedono precisione ed efficienza , il sistema analizza simultaneamente 7 oscillatori e 4 medie mobili su 8 timeframe differenti , generando punteggi normalizzati che semplificano il processo decisionale. Caratteristiche Principali: Analisi Multi-Ti
FREE
Here   our more valuable tools SMC Trend Trading   ,  Easy SMC Trading  ,  Institutional SMC Architect Volume Analysis Tools  ,  Volume flow Profile  ,  Market volume profile  , FVG with Volume  , Liquidity Heatmap Profile  ,  Volume Spread Analysis The    Liquidity Heatmap   is a sophisticated institutional trading tool designed to reveal where over-leveraged traders are trapped. By calculating estimated liquidation levels based on volume spikes and leverage, this indicator draws a dynamic "h
Spike Phantom
Niccyril Chirindo
1 (1)
Spike Phantom Spike Phantom is a specialized indicator for PainX and GainX synthetic indices that generates trading signals with automatic alert notifications. Features The indicator analyzes market conditions using proprietary algorithms and displays buy/sell arrows directly on the chart. It works specifically with PainX and GainX indices on M5 timeframe. Signal generation combines multiple technical analysis methods to identify potential trading opportunities. The system provides two TP leve
Gli utenti di questo prodotto hanno anche acquistato
Trend Sniper X
Sarvarbek Abduvoxobov
4.86 (44)
Trend Sniper X è un indicatore trend-following multi-timeframe per MetaTrader 5 che aiuta i trader a identificare la direzione del trend e i potenziali punti di inversione con chiarezza e precisione. per MT4: https://www.mql5.com/en/market/product/193245 Informazioni sul prezzo: Il prezzo attuale è promozionale ed è soggetto a modifiche con il rilascio di futuri aggiornamenti e nuove funzionalità. Offerta Bonus: Per ricevere GRATIS l'Auto-Trade Assistant EA per questo indicatore, invia un messa
Entry Points Pro vi mostra dove entrare, dove mettere lo stop e con quale lotto operare — prima di piazzare l'ordine. PREZZO Ora 199 USD: 10 copie a questo prezzo, poi 249 USD. Il prezzo finale è di 349 USD. Guadagno facendo trading sui mercati e lo dimostro, quindi non ho bisogno di vendere questo indicatore a tutti. È uno strumento per trader che ragionano con la propria testa, non un pulsante magico. Nessuna rottura, nessun trade. Una freccia grigia è un segnale annullato: il prezzo non ha r
Ultra Indicator
Ihor Otkydach
5 (1)
ULTRA è un indicatore tecnico che funziona secondo un approccio “tutto in uno”: analizza autonomamente il mercato, genera segnali di trading, visualizza i livelli per l’impostazione degli ordini stop-loss e suggerisce quando chiudere le operazioni per realizzare profitti o ridurre al minimo le perdite. In altre parole, non importa se non sai come analizzare il mercato, determinare i livelli — dove impostare lo stop-loss — o se hai difficoltà con la gestione del capitale. ULTRA farà tutto questo
Gann Made Easy è un sistema di trading Forex professionale e facile da usare che si basa sui migliori principi del trading utilizzando la teoria di mr. WD Gann. L'indicatore fornisce segnali ACQUISTA e VENDI accurati, inclusi i livelli di Stop Loss e Take Profit. Puoi fare trading anche in movimento utilizzando le notifiche PUSH. CONTATTAMI DOPO L'ACQUISTO PER RICEVERE GRATUITAMENTE LE ISTRUZIONI DI TRADING E OTTIMI INDICATORI EXTRA! Probabilmente hai già sentito parlare molte volte dei metodi d
Boba Analysis Suite
Trade Ready Solutions LLC
5 (2)
Boba Analysis Suite Boba Analysis Suite è un indicatore di analisi per MetaTrader 5. Riunisce la struttura del mercato, le zone di prezzo rilevanti e il contesto generale del mercato in un’unica visualizzazione del grafico. Sviluppato sulla base dell’esperienza pratica come trader e formatore di trading, supporta un processo di analisi strutturato: valutare la direzione del mercato, individuare livelli importanti e analizzare congiuntamente più intervalli temporali. Analisi nel contesto del merc
M1 Sniper MT5
Oleg Rodin
5 (7)
M1 SNIPER   è un sistema di indicatori di trading facile da usare. Si tratta di un indicatore a freccia progettato per l'intervallo temporale M1. L'indicatore può essere utilizzato come sistema autonomo per lo scalping sull'intervallo temporale M1 e come parte del tuo sistema di trading esistente. Sebbene questo sistema di trading sia stato progettato specificamente per il trading sull'intervallo temporale M1, può comunque essere utilizzato anche con altri intervalli temporali. Inizialmente ho p
FiboSniper Pro
Van Minh Nguyen
5 (4)
FiboSniper Pro – Multi-Filter Fibonacci System with Auto SL/TP and Control Panel FiboSniper Pro è un indicatore tecnico che combina Fibonacci Envelopes dinamici con diversi filtri di conferma per generare segnali Buy e Sell selezionati. I livelli di Fibonacci vengono calcolati sulla base di Moving Average e ATR e successivamente filtrati tramite ADX, EMA, RSI, ATR, Volume, Time e struttura delle candele. L’indicatore visualizza direttamente sul grafico i livelli automatici di Stop Loss e Take Pr
Auto Optimized SpeedAngle è un sistema di vettorizzazione del momento di livello istituzionale che elimina l'overfitting ( curve-fitting ) attraverso l'ottimizzazione continua Walk-Forward (WFO). Invece di affidarsi a input statici che si degradano quando i regimi di mercato cambiano, l'indicatore recalibra dinamicamente i suoi parametri utilizzando la validazione Out-of-Sample (OOS), assicurando che i segnali visualizzati rappresentino reali vantaggi statistici anziché anomalie storiche. Quadro
SQN Max indicator for MT5 by ITC
Renaud Herve Francois Candel
Sqn Max Indicator Sqn Max is an exclusive indicator to trade the market with high effectiveness. The indicator is based on price action, volatility and trend. This indicator is as simple as possible but not too simple. The indicator can generate alerts to ease the trading process. You don't have to stay all day in front of your screen. The indicator can be used with any class of assets and with any time frame. It is possible to achieve better results trading our list of selected assets. We achi
SIO Oscillator: oscillatore auto-ottimizzante dello squilibrio di semivarianza Acquista l’indicatore e ricevi GRATIS l’Expert Advisor (EA) basato su di esso. La maggior parte degli oscillatori tratta ogni movimento di prezzo allo stesso modo. SIO separa la pressione rialzista da quella ribassista e misura lo squilibrio tra le due, mostrando quale parte controlla davvero il mercato: compratori o venditori. Quando lo squilibrio raggiunge un estremo, SIO genera un segnale chiaro con livelli di ingr
Power Candles MT5
Daniel Stein
4.58 (12)
Power Candles V3 - Indicatore di forza ad ottimizzazione automatica Power Candles V3 trasforma la forza delle valute e degli strumenti in un piano di trading attuabile su ogni grafico a cui è collegato. Invece di limitarsi a colorare le candele, esegue un'auto-ottimizzazione in tempo reale in background e ti fornisce i migliori valori di Stop Loss, Take Profit e soglia di segnale per il simbolo che hai davanti. Basta un clic per adottarlo nel trading live: i raggi di ingresso, Stop Loss e Take P
Astral Structure
Ottaviano De Cicco
Astral Structure Valuta il setup. Osserva il piano iniziale. Offerta di lancio - $99. $149 dopo il lancio. Un setup di struttura pone più domande insieme: il quadro più ampio concorda, dove si trova il riferimento di stop e come sono definiti i target? Astral Structure riunisce queste domande in un unico spazio per i trader discrezionali che basano le proprie decisioni sulla struttura del mercato. Concentrati sul setup rilevante. Esamina insieme l'ultimo setup idoneo, la sua direzione e la sua q
Indicatore multi-valuta di forza e momentum MT5 Dynamic Forex28 Navigator è l'evoluzione dei nostri indicatori popolari da lunga data, che riunisce la potenza di cinque in uno: Advanced Currency Strength28 Indicator (700 recensioni) Advanced Currency IMPULSE with ALERT (530 recensioni) Currency Strength EXOTICS GOLD Impulse with Alert CS28 Combo Signals (bonus attuale) Non serve acquistare quattro indicatori e impilarli sui grafici. Tutto è riunito in un solo indicatore potente: la forza delle 2
Scalper Vault è un sistema di trading potente e completo, progettato per i trader che desiderano ottenere risultati costanti nel trading intraday. Questo indicatore ad alta precisione funge da sistema di trading autonomo, offrendo analisi di livello istituzionale sia per il mercato Forex che per le Opzioni Binarie. CONTATTAMI DOPO L'ACQUISTO PER RICEVERE I MIEI CONSIGLI DI TRADING E UN FANTASTICO BONUS! Eliminando le congetture e le complesse analisi manuali, Scalper Vault ti permette di concen
Azimuth Pro
Ottaviano De Cicco
5 (7)
Azimuth Pro V2: Synthetic Fractal Structure and Confirmed Entries for MT5 Overview Azimuth Pro is a multi-level swing structure indicator by Merkava Labs . Four nested swing layers, swing-anchored VWAP, ABC pattern detection, three-timeframe structural filtering, and closed-bar confirmed entries — one chart, one workflow from micro-swings to macro-cycles. This is not a blind signal product. It is a structure-first workflow for traders who care about location, context, and timing. Halloween P
Neuro Poseidon MT5
Daria Rezueva
4.68 (53)
Neuro Poseidon is a new indicator by Daria Rezueva. It combines precise trading signals with adaptive TP/SL levels - creating best possible trades as a result! Message me and get  Neuro Poseidon Assistant  as a gift to automize your trading process! What makes it stand out? 1. Proven profitability on all assets and timeframes 2. Only confirmed BUY and SELL signals present on the chart 3. Adaptive TP & SL levels generated by the software for each trade 4. Easy to understand - suitable for al
Adaptive Price Action Engine Acquista un indicatore, ricevi l'EA gratis Analisi Auto-Ottimizzata del Trend e dei Pattern Candlestick Multi-Timeframe I mercati cambiano continuamente e non tutti i pattern di Price Action hanno lo stesso valore in ogni condizione di mercato. Adaptive Price Action Engine è progettato per adattarsi alle condizioni di mercato in continua evoluzione, combinando struttura del trend, analisi Multi-Timeframe, pattern Candlestick e ottimizzazione statistica in un unico fr
PZ Swing Trading MT5
PZ TRADING SLU
5 (5)
Protect against whipsaws: revolutionize your swing trading approach Swing Trading is the first indicator designed to detect swings in the direction of the trend and possible reversal swings. It uses the baseline swing trading approach, widely described in trading literature. The indicator studies several price and time vectors to track the aggregate trend direction and detects situations in which the market is oversold or overbought and ready to correct. [ Installation Guide | Update Guide | Tro
Advance AI Scanner
Mohamed Samsudeen
5 (1)
Advance AI Scanner is a multi-symbol analysis indicator for MetaTrader 5. It scans Forex pairs, metals, energy, stock indices and cryptocurrencies at the same time and rates each instrument with its own self-training model. It explains in plain English what moved each market and why, and it estimates how far upcoming economic news usually moves each symbol, measured on your broker's own price history. $199 instead of $499. 10 copies left at this price. One time purchase  Installation and User
Apex Patterns PRO Acquista l'indicatore - Ottieni GRATUITAMENTE l'Expert Advisor basato su di esso. Intelligenza auto-ottimizzante per pattern grafici e breakout Gli scanner di pattern tradizionali si basano su input fissi, registrando spesso prestazioni inferiori quando la volatilità e le strutture del mercato cambiano. Apex Patterns PRO è progettato per adattarsi alle mutevoli condizioni di mercato combinando il riconoscimento dei pattern grafici strutturali, il filtraggio del momentum e l'au
Advanced Supply Demand MT5
Bernhard Schweigert
4.53 (15)
La migliore soluzione per qualsiasi principiante o trader esperto! Questo indicatore è uno strumento di trading unico, di alta qualità e conveniente perché abbiamo incorporato una serie di funzionalità proprietarie e una nuova formula. Con questo aggiornamento, sarai in grado di mostrare fusi orari doppi. Non solo potrai mostrare una TF più alta, ma anche entrambe, la TF del grafico, PIÙ la TF più alta: SHOWING NESTED ZONES. Tutti i trader di domanda di offerta lo adoreranno. :) Informazioni imp
Superhero
Ihor Otkydach
5 (3)
L'indicatore SUPERHERO è un sistema di trading multivaluta progettato secondo un approccio "all-inclusive". L'indicatore analizza autonomamente il mercato e fornisce segnali su quando aprire e chiudere le posizioni. Utilizza ordini Stop Loss e Take Profit. Il rapporto R:R è 1:1. Questo sistema è in grado di inviare notifiche push sul tuo smartphone, consentendoti di effettuare operazioni "in mobilità" senza dover rimanere incollato al PC. È perfetto per le società di trading proprietario. UN OMA
Bill Williams Advanced
Siarhei Vashchylka
5 (11)
Bill Williams Advanced is designed for automatic chart analysis using Bill Williams' "Profitunity" system. The indicator analyzes four timeframes at once. Manual (Be sure to read before purchasing) Advantages 1. Analyzes the chart using Bill Williams' "Profitunity" system. Signals are displayed in a table in the corner of the screen and on the price chart. 2. Finds all known AO and AC signals, as well as zone signals. Equipped with a trend filter based on the Alligator. 3. Finds "Divergence Bar
Naked Forex Kangaroo Tail Pro Indicator Kangaroo Tail Pro Indicator is a pattern recognition indicator for Forex, Stocks, Indices, Futures, Commodities and Cryptos. The Kangaroo Tail is a multi-bar pattern. The Kangaroo Tail pattern is very effective and is very simple to trade. The strategy that comes with the Kangaroo Tail is based on price action. The indicator does what it was designed for: displaying Kangaroo Tail patterns.     Don't expect to follow the up and down arrows and make mone
Murrey Math Classic
Sarvarbek Abduvoxobov
5 (2)
Murrey Math Classic Murrey Math Classic è un indicatore di trading professionale e dinamico, progettato per prevedere i movimenti dei prezzi nei mercati finanziari con precisione matematica. Il sistema modernizza la leggendaria geometria del prezzo-tempo, trasformandola in un modello matematico altamente strutturato e adatto ai moderni mercati finanziari. La logica alla base di Murrey Math è che os mercati finanziari non si muovono in modo casuale, ma seguono un ritmo specifico. Proprio come la
Volatility Master for MetaTrader is a real-time dashboard tool that scans up to  50 symbols  to identify high-volatility , trending markets instantly. With bullish/bearish signals, customizable alerts, and a user-friendly interface, it helps you avoid range-bound conditions and focus on high-probability trades. Clarity leads to confidence. Trade confidently and protect your capital effectively with this powerful dashboard. We don't offer free or bonus indicators in exchange of reviews from you.
Divergence Bomber
Ihor Otkydach
4.89 (94)
Ogni acquirente dell’indicatore riceverà inoltre gratuitamente: L’utilità esclusiva “Bomber Utility”, che gestisce automaticamente ogni operazione, imposta i livelli di Stop Loss e Take Profit e chiude le posizioni secondo le regole della strategia I file di configurazione (set file) per adattare l’indicatore a diversi asset I set file per configurare il Bomber Utility in tre modalità: “Rischio Minimo”, “Rischio Bilanciato” e “Strategia di Attesa” Una guida video passo-passo per installare, con
FX Sniper Orange Indicator FX Sniper Orange is an exclusive indicator to spot situations where market has gone too far and market could reverse soon after. The indicator displays arrows in your chart indicating probable future price action (see screenshot attached). FX Sniper Orange never repaints. Once candle is closed signal is confirmed and arrow will never disappear. Users of the indicator can setup alerts when new arrows are displayed in the chart. Inputs of the indicator are: Distanc
Currency Strength Wizard   è un indicatore molto potente che ti fornisce una soluzione all-in-one per un trading di successo. L'indicatore calcola la potenza di questa o quella coppia forex utilizzando i dati di tutte le valute su più intervalli di tempo. Questi dati sono rappresentati in una forma di indice di valuta facile da usare e linee elettriche di valuta che puoi utilizzare per vedere il potere di questa o quella valuta. Tutto ciò di cui hai bisogno è collegare l'indicatore al grafico ch
ARIPoint
Temirlan Kdyrkhan
1 (4)
ARIPoint is a powerful trading companion designed to generate high-probability entry signals with dynamic TP/SL/DP levels based on volatility. Built-in performance tracking shows win/loss stats, PP1/PP2 hits, and success rates all updated live. Key Features: Buy/Sell signals with adaptive volatility bands Real-time TP/SL/DP levels based on ATR Built-in MA Filter with optional ATR/StdDev volatility Performance stats panel (Success, Profit/Loss, PP1/PP2) Alerts via popup, sound, push, or email Cu
Altri dall’autore
SEE THE TREND ON EVERY TIME FRAME. INTELLIGENT INDICATOR READS PRICE ACTION TO SPOT TRUE MARKET CYCLES AND TREND. This advanced multi-currency and multi-time frame indicator,   reads trend in real-time   so you always know the trends of the markets   you want to trade.  ​Trend-Viewer Pro has been specifically designed to read the trend of   every time frame   and   every market , simultaneously, making it much easier for you to find markets with   time frame correlation , so you can focus on th
Cycle Finder Pro
Raymond Gilmour
5 (11)
## THE CHART, READ FOR YOU. Chart reading is slow, and it is easy to get wrong. You need to know which highs and lows actually matter, which ones the market has already invalidated, and what the ones that remain are telling you. Miss a point and the whole read changes. Cycle Finder Pro marks TRUE highs and lows, and nothing else. A high is confirmed when two subsequent bars each take out the low beneath them. A low when two take out the high above. The bars need not be consecutive — the marke
Currency Strength Matrix
Raymond Gilmour
4.5 (26)
THE ONLY CURRENCY STRENGTH INDICATOR BUILT ON PRICE ACTION Most currency strength meters average an oscillator, or measure how far price has travelled. But these are not accurate measures of trend, Currency Strength Matrix measures trend strength, not just if a currency price has gone up or down. Currency Strength Matrix reads market structure . For each of the 28 major pairs it finds the confirmed cycle highs and lows, and decides whether that pair is in an uptrend, a downtrend, or neither. A
CycleFinderPro
Raymond Gilmour
5 (1)
## THE CHART, READ FOR YOU. Chart reading is slow, and it is easy to get wrong. You need to know which highs and lows actually matter, which ones the market has already invalidated, and what the ones that remain are telling you. Miss a point and the whole read changes. Cycle Finder Pro marks TRUE highs and lows, and nothing else. A high is confirmed when two subsequent bars each take out the low beneath them. A low when two take out the high above. The bars need not be consecutive — the marke
Trend Viewer Pro
Raymond Gilmour
5 (4)
EVERY MARKET YOU FOLLOW, ON YOUR TIMEFRAMES, IN ONE TABLE If you follow the trend on more than one timeframe, checking every market chart by chart is  slow, and it is easy to miss one. Trend Viewer Pro reads it for you. For every market on your list it shows the trend on up  to three timeframes of your choosing, in one table on any chart, and sums each market up in  a single word: **STRONG**, **BULL**, **BEAR** or **MIXED**. Every reading is Cycle Finder Pro's. A high is confirmed when two late
Filtro:
Nessuna recensione
Rispondi alla recensione