Currency Strength Matrix MT5

THE ONLY CURRENCY STRENGTH INDICATOR BUILT ON PRICE ACTION


Most currency strength meters average an oscillator, or measure how far price has travelled. But these are not accurate measures of trend, Currency Strength Matrix measures trend strength, not just if a currency price has gone up or down.

Currency Strength Matrix reads market structure. For each of the 28 major pairs it finds the confirmed cycle highs and lows, and decides whether that pair is in an uptrend, a downtrend, or neither. A currency's score is simply the number of pairs it is beating minus the number it is losing to.


+7 is the maximum + score and means that currency is in an uptrend against all seven other majors. -7 means the opposite.

Because it reads structure rather than just price changes, a score only changes when the market CHANGES TREND.


THE TOTAL COLUMN

Strength is the score on your chart's timeframe. Total is the sum of the scores across the three timeframes you choose — H1, H4 and D1 by default. One number, from -21 to +21, that tells you whether a currency is strong everywhere or strong in only one place.

It sounds trivial but it stops one of the biggest causes of bad trades, taking a trend trade which is actually against the trend of another time frame. This helps to separate trades that work from trades that fight the market. Look at a real reading:

Currency Strength (D1) Total
AUD +4 +6
CAD +3 +3
JPY +3 -1
USD +2 +10
NZD -4 -17


On the daily alone, JPY (+3) looks stronger than USD (+2). The Total says the opposite. USD is +10 — it is being bought on the hourly, the four-hour and the daily at once. JPY is -1 — its daily strength is running against the shorter timeframes, which is exactly the kind of move that stalls.

And NZD at -17 out of a possible -21 is weak on every timeframe there is. So the trade the board is pointing at is not the one the daily column suggests. Pair the strongest Total against the weakest Total and you are trading with every timeframe you look at, not just the one on your screen.

Strength tells you what is happening now. Total tells you whether it is likely to continue.


WHAT YOU GET

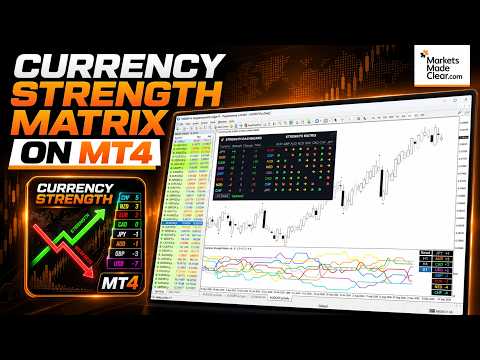
The dashboard — all eight currencies, sorted strongest to weakest automatically. Strength on your chart's timeframe, Change since the trading day opened, and the Total across your three timeframes.

The strength matrix — every one of the 28 pairings in a single grid. An arrow shows which side is winning: up if the row currency is beating the column currency, down if it is losing, sideways if there is no trend. Reading down a column shows you at a glance exactly which pairs are driving a currency's score. Collapse it with one click when you want the chart space back.

Strength history — the scores plotted for the last 200 bars, not just this moment. You can see which currency has been building strength for a week and which one turned this morning. Click any currency to isolate its line, or hide the ones you don't care about.

Timeframe buttons — inspect the H1, H4 or D1 picture without changing your chart. The chart stays where it is; only the panel and the lines switch.

Cycle markers on your chart — the confirmed highs and lows the scores are actually built from, drawn on the symbol you are looking at, plus its own trend reading. Nothing is hidden: you can see the structure behind every number.

Change since the day opened — who has gained and who has given ground today, measured from the broker's daily open.


FAST

The whole board — 28 pairs across four timeframes — is rebuilt from scratch in a few milliseconds. Switch symbol or timeframe and it is simply there.


SETTINGS

Total: timeframe 1 / 2 / 3 — the three timeframes that make up the Total column. H1, H4 and D1 by default. Set them to whatever you trade.

Bars of strength history — how much history to draw and to read structure from. Default 200.

Oversized bar threshold (x ATR) — bars far larger than average are news, not structure, and are handled separately so a single spike cannot invent a trend. Default 2.2. Raise it to treat fewer bars as oversized, lower it to treat more.

ATR period — default 14.

Marker offset, pips — how far the cycle markers sit from the high or low. Default 2. Cosmetic only; it does not affect any score.

Broker suffix — advanced. Leave blank and the indicator works out your broker's naming from EURUSD (".p", ".raw", ".m" and so on). Only set it if your broker uses more than one variant of the same pair.

Panel — show or hide it, position, font size (everything scales from it), background and text colour, and whether the sorted list and buttons appear in the strength window.

Markers — show or hide, high and low colours, size.

Strength line width and the eight currency colours — set these here in the Inputs tab, not the Colors tab, so they survive a timeframe change.


HOW TO TRADE IT

  1. Trade the extremes. Pair a currency with a high positive Total against one with a high negative Total. Both timeframes and structure agree; you are going with the market, not predicting it.
  2. Trade the crossings. When two currencies cross the zero line in opposite directions, the pair between them is changing hands. The strength history makes these easy to spot as they form.
  3. Trade the early turn. A strong currency losing strength against a weak one gaining it is the earliest, most aggressive entry the board offers — and the Total column tells you whether the bigger picture supports it or not.
  4. Use Total as a filter. Before taking any of the above, check the Total. Strength without Total is a short-term move inside a bigger trend going the other way.

REQUIREMENTS

MetaTrader 5. Works on any chart — forex, indices, metals — since the strength is always computed from the 28 major pairs regardless of what you are looking at. Your broker must offer the 28 major pairs for a complete board; the panel tells you if any are missing.


WHAT'S NEW IN v6

  • Total column across three timeframes of your choosing.
  • Strength matrix — all 28 pairings as a grid of arrows, collapsible.
  • Strength history for the last 200 bars, with click-to-isolate on any currency.
  • Timeframe buttons — see another timeframe without leaving your chart.
  • Cycle markers drawn on the chart, showing the structure behind the scores.
  • Change since the daily open.
  • Rebuilt calculation engine. The full board now takes milliseconds instead of minutes. Symbol and timeframe switching is instant and there is no background load.
  • Scales correctly on high-DPI displays.
Рекомендуем также
Master Edition — это профессиональный аналитический инструмент, предназначенный для визуализации структуры рынка через призму объема и денежного потока. В отличие от стандартных индикаторов объема, этот инструмент отображает Daily Volume Profile (Дневной Профиль Объема) прямо на вашем графике, позволяя видеть, где именно происходило открытие цены и где позиционируются «умные деньги». Эта версия Master Edition разработана для ясности и скорости, оснащенная уникальной системой Auto-Theme Sync, кот
Advanced Volume Profile Liquidity Analysis via Custom Area Selection The Advanced Manual Volume Profile is a precision tool for MetaTrader 5 designed to deconstruct market structure through price-level volume analysis. Unlike static profiles, this indicator exclusively processes the price and time range defined by the user via a rectangle object, offering a surgical view of the market auction. Elite Technical Specifications Dynamic Algorithm: Real-time calculation (400ms refresh rate) based on t
FREE
A volume-at-price heatmap with POC, value area, estimated buy/sell pressure, confirmed signals and alerts. POC Volume Profile Heatmap is a MetaTrader 5 indicator that organizes historical volume across price levels. It identifies the Point of Control, displays the selected value area, and estimates buying and selling pressure at the POC. The indicator is intended for traders who use volume-at-price structure to study acceptance, rejection and interaction around high-activity price levels. It c
FREE
Volume Profile OrderFlow Suite puts volume profiles, VWAP and tick order flow on one MetaTrader 5 chart, with one panel. It also measures how price actually reacted at the profile levels on your symbol, so you can see from your broker's own data whether a level has been worth watching. The panel always shows which data is used. Forex and CFD symbols in MT5 only have tick volume (the number of price changes), so on those symbols the buy/sell side is an estimate. Symbols with exchange trades use r
Makito NASDAQ is a professional market-analysis indicator for MetaTrader 5 designed for NASDAQ traders. It combines market structure, higher-timeframe trend, Mag7 stock participation, support and resistance, VIX sentiment, liquidity behavior, and multi-timeframe buying and selling pressure into one organized on-chart panel. The indicator summarizes current conditions with a simple: BUY – bullish conditions have sufficient alignment SELL – bearish conditions have sufficient alignment HOLD – confi
Correlation Matrix Pro - Мультивалютный Анализ Корреляции Понимайте взаимосвязи между валютными парами в реальном времени! Мощный аналитический инструмент, который помогает визуализировать статистические связи между 6 валютными парами одновременно. Идеально подходит для управления портфелем, диверсификации рисков и стратегий хеджирования. ОСНОВНЫЕ ФУНКЦИИ - Корреляция Пирсона в реальном времени с логарифмической доходностью - Мониторинг до 6 валютных пар одновременно - Автоматическое определени
FREE
Daily & Composite Volume Profile   This is a professional-grade market profile tool designed for MetaTrader 5. It utilizes a   Dual-Profile System   to visualize supply, demand, and liquidity concentrations. Key Features Left Side: Daily Session Profiles Automatically identifies the start and end of every trading day. Generates a unique Volume Profile for each individual day. Allows you to see how value migrated from yesterday to today (e.g., Is today's volume higher or lower than yesterday?).
Here   our more valuable tools SMC Trend Trading   ,  Easy SMC Trading  ,  Institutional SMC Architect Volume Analysis Tools  ,  Volume flow Profile  ,  Market volume profile  , FVG with Volume  , Liquidity Heatmap Profile  ,  Volume Spread Analysis Spike Blaster Pro is a next-generation MT5 indicator designed specifically for synthetic markets. It works seamlessly on Boom Index and Weltrade Index , providing traders with sharp, reliable spike detection signals. What makes Spike Blaster Pro po
RSI Currency Strength Meter is a powerful and elegant multi-currency indicator that measures the real-time relative strength of the 8 major currencies using RSI logic. By calculating the smoothed performance of each currency across its major pairs and applying the RSI formula, it delivers clean and responsive strength lines that make it easy to spot which currencies are truly strong or weak at any moment. This indicator is particularly useful for visualizing currency correlations and divergence
Volume Profile FREE — Multi-Session Heatmap (POC · VAH · VAL) See where trading activity actually occurs—not just where price moves. This indicator builds a clear, color-coded Volume Profile Heatmap directly on your chart and highlights the market's most important price levels: the Point of Control (POC) and the Value Area (VAH/VAL) , where price is most likely to react.
FREE
Here   our more valuable tools SMC Trend Trading   ,  Easy SMC Trading  ,  Institutional SMC Architect Volume Analysis Tools  ,  Volume flow Profile  ,  Market volume profile  , FVG with Volume  , Liquidity Heatmap Profile  ,  Volume Spread Analysis Automatically detects major swing points not internal noise Generates buy/sell signals at key Fibonacci levels Displays professional GUI panel with real-time analysis Marks major swings with visual indicators Trading Strategy BUY at 38.2%-61.8% Fib
FREE
Here   our more valuable tools SMC Trend Trading   ,  Easy SMC Trading  ,  Institutional SMC Architect Volume Analysis Tools  ,  Volume flow Profile  ,  Market volume profile  , FVG with Volume  , Liquidity Heatmap Profile  ,  Volume Spread Analysis 1. Institutional Supply & Demand Zones Auto-Detection:   Automatically draws zones at valid pivot points. Smart Extension:   Zones extend into the future for easy visibility but automatically cut off when price breaks them. Mitigation Logic:   When
Gold Venamax – это лучший биржевой технический индикатор. Алгоритм индикатора анализирует движение цены актива и отражает волатильность и потенциальные зоны для входа. Live Signal of manual trading >>>   [ Click Here ] Особенности индикатора: Это супер индикатор с Magic и двумя Блоками трендовых стрелочников для комфортной и профитной торговли. Красная Кнопка переключения по блокам выведена на график. Magic задается в настройках индикатора, так чтобы можно было установить индикатор на два график
Fixed Volume Profile
Carlos Pascual Perez Maturano
This indicator, titled "Fixed Volume Profile.mq5", is a custom tool for MetaTrader 5 (MQL5) designed to calculate and display a Volume Profile over a user-defined fixed time range. The Volume Profile shows the distribution of trading volume at different price levels during a specific period, helping to identify areas of high activity (such as Points of Control or POCs) and volume-based support/resistance areas. Main Functionality: Interactive Range: The indicator creates two vertical lines on
FREE
VSA Smart Engine
Jean Carlos Martins Roso
VSASmartEngine - VSA Volume Intelligence System VSASmartEngine is a technical indicator for MetaTrader 5 based on VSA (Volume Spread Analysis) methodology. The system is designed to provide an objective reading of market activity, helping traders identify aggression, absorption, and exhaustion states by analyzing the relationship between volume and price action. The indicator features a dual-processing architecture, allowing the user to switch between the full VSA logic engine or a simplified h
Вот краткая, практичная и удобная версия описания на русском языке для публикации на MQL5: Dynamic Market Profile (DMP) — Настраиваемые профили объема Dynamic Market Profile позволяет мгновенно и вручную анализировать профиль объема любого участка графика. Больше не нужно ограничиваться жесткими рамками дневных или недельных профилей — вы сами выбираете конкретное движение, консолидацию или волну тренда для анализа. Индикатор позволяет одновременно строить до 5 независимых зон с помощью интеракт
Техническое описание индикатора – Delta Profile для MetaTrader 5 Delta Profile – это индикатор, разработанный для MetaTrader 5, предназначенный для детального анализа потока объёмов в пределах заданного диапазона свечей. Он структурирует и отображает информацию о дисбалансе положительных объёмов (связанных с движением вверх) и отрицательных объёмов (связанных с движением вниз) на различных ценовых уровнях. В результате пользователь получает чёткое представление о тех участках графика, где сосред
Индикатор на основе дисбаланса тик-спреда. TF: Работает на всех таймфреймах (от M1 до D1). Пары: Совместим с Forex, индексами, золотом и CFD (автоматическая настройка для инструментов JPY, Gold, CFD). Параметры: TickWindow (200) – окно наблюдения тиков SpreadWeight (1.5) – вес спреда NormalizationPeriod (20) – период нормализации (z-score) Overbought / Oversold (±3.0) – уровни оповещения AlertCooldown (300s) – интервал между оповещениями Заключение: Proxy Order Flow – Imbalance Tick-Spread v2
SMC Pro is a chart-window indicator for traders who work with Smart Money Concepts: structure first, then wait for price to return into a high-quality POI. What it shows ZigZag swings on higher-timeframe structure (default H1) and on the chart timeframe BOS (break of structure) and CHoCH (change of character) Equal Highs / Equal Lows (liquidity pools) and an equilibrium midpoint Fair Value Gaps (FVG) filtered by ATR Order Blocks (OB) defined from a strong impulse candle Confluence score: structu
Radar Trade Analytic
Jeverson Rodrigues Ferreira
Radar Trade Analytic 2.0 – Количественная панель для MT5 Что такое Radar Trade Analytic? Radar Trade Analytic — это количественный модуль экосистемы Radar Trade. Он открывается в отдельном окне под основным графиком и отображает четыре синхронизированных слоя, построенных на едином фирменном движке Sigma, что обеспечивает прямое соответствие между тем, что вы видите на графике, и тем, что читаете на панели. Никаких сигналов на покупку или продажу. Никаких целей. Никаких алертов. Radar Tra
Here   our more valuable tools SMC Trend Trading   ,  Easy SMC Trading  ,  Institutional SMC Architect Volume Analysis Tools  ,  Volume flow Profile  ,  Market volume profile  , FVG with Volume  , Liquidity Heatmap Profile  ,  Volume Spread Analysis A professional spike pattern indicator built for synthetic traders who scalp and swing Crash 500/300/1000 with precision.  This indicator: Detects powerful 3-candle spike formations (Spike → Pullback → Spike) Automatically draws a clean box a
FREE
Enhanced Volume Profile: The Ultimate Order Flow & Liquidity Analysis Tool Overview Enhanced Volume Profile is an indicator for MetaTrader 5 that displays the traded volume at specific price levels over a defined period. It separates the total volume into buy and sell components, presenting them as a side-by-side histogram on the chart. This allows users to observe the volume distribution and the proportion of buy and sell volumes at each price level. Graphics Rendering The indicator uses the
FREE
Adaptive Volume Profile рисует профиль объёма последних баров прямо на графике: точку контроля (POC), область стоимости (VAH / VAL), узлы высокого объёма (HVN), узлы низкого объёма (LVN) и необязательную гистограмму объёма. Размер ценовых строк подстраивается под текущую волатильность (ATR), поэтому профиль остаётся читаемым на любом символе и таймфрейме. Возможности POC - ценовой уровень с наибольшим торговым объёмом в окне Value Area (VAH / VAL) - ценовой диапазон, содержащий выбранную долю об
FREE
Smart SMC FVG
Ekkasawat Pitichalermroch
SMC + Volume Profile + FVG: Indicator Guide Overview SMC + Volume Profile + FVG is an all-in-one indicator for MetaTrader 5. It combines three popular price-action tools on a single chart: Smart Money Concepts (SMC): market structure (swings, BOS, CHoCH) and Order Blocks Fair Value Gaps (FVG): price imbalances left behind by fast moves Volume Profile: where the most trading happened, shown as POC, Value Area High and Value Area Low Everything is drawn automatically. You can turn each part on or
VibeFox Volume Profile — Volume Profile для MetaTrader 5 VibeFox Volume Profile — это полный набор инструментов Volume Profile для MetaTrader 5. Он строит горизонтальное распределение торгуемого объёма по цене, поэтому вы сразу видите, где рынок проявил наибольшую активность, где торговал слабо и какие ценовые уровни, вероятно, будут действовать как магниты или барьеры. Каждый профиль рисуется прямо на графике и управляется из современной панели с управлением мышью — никаких меню, в которых нужн
Многорежимный анализ объема: анализируйте объем по-своему, а не по алгоритму индикатора. Большинство индикаторов профиля объема ограничивают трейдеров заранее определенными диапазонами анализа. Но рынок не движется в рамках фиксированных шаблонов, так почему же ваш анализ должен двигаться в их рамках? Индикатор Volume Profile Multi-Mode предоставляет вам полную свободу выбора места, времени и способа анализа объема. Независимо от того, изучаете ли вы структуру рынка, составляете профилю торговые
Relative Volume Profile (RVP) Stop guessing where the smart money is trading. See the exact price levels that matter. Overview Traditional Volume Profiles tell you where volume occurred, but they leave out a crucial piece of the puzzle: intensity . The Relative Volume Profile (RVP) is a next-generation charting tool that fuses standard price profiling with Relative Volume (RVOL) analysis. Instead of drawing plain, monotone blocks, RVP color-codes every single price level based on aggressive buyi
Technical Analysis Dashboard Pro (TADashboard Pro) – Единая Система Технического Анализа (Unified Technical Analysis System) TADashboard Pro – это продвинутая панель технического анализа, которая объединяет множество индикаторов и таймфреймов в едином визуальном интерфейсе. Разработанная для трейдеров, которым требуются точность и эффективность , система одновременно анализирует 7 осцилляторов и 4 скользящие средние на 8 различных таймфреймах , генерируя нормализованные баллы, которые упрощают п
FREE
Here   our more valuable tools SMC Trend Trading   ,  Easy SMC Trading  ,  Institutional SMC Architect Volume Analysis Tools  ,  Volume flow Profile  ,  Market volume profile  , FVG with Volume  , Liquidity Heatmap Profile  ,  Volume Spread Analysis The    Liquidity Heatmap   is a sophisticated institutional trading tool designed to reveal where over-leveraged traders are trapped. By calculating estimated liquidation levels based on volume spikes and leverage, this indicator draws a dynamic "h
Spike Phantom
Niccyril Chirindo
1 (1)
Spike Phantom Spike Phantom is a specialized indicator for PainX and GainX synthetic indices that generates trading signals with automatic alert notifications. Features The indicator analyzes market conditions using proprietary algorithms and displays buy/sell arrows directly on the chart. It works specifically with PainX and GainX indices on M5 timeframe. Signal generation combines multiple technical analysis methods to identify potential trading opportunities. The system provides two TP leve
С этим продуктом покупают
Trend Sniper X
Sarvarbek Abduvoxobov
4.86 (44)
Trend Sniper X — это трендовый индикатор для MetaTrader 5, работающий на нескольких таймфреймах, который помогает трейдерам точно и ясно определять направление тренда и потенциальные точки разворота. для MT4: https://www.mql5.com/en/market/product/193245 Информация о цене: Текущая цена является промо-ценой и может измениться по мере выхода предстоящих обновлений и новых функций. Бонусное предложение: Чтобы получить БЕСПЛАТНЫЙ авто-трейд советник Assistant EA для этого индикатора, пожалуйста, на
Entry Points Pro показывает, где входить, где ставить стоп и каким лотом торговать — до того, как вы поставите ордер. ЦЕНА Сейчас 199 USD: 8 копий по этой цене, затем 249 USD. Финальная цена — 349 USD. Я зарабатываю торговлей на рынке и показываю это, поэтому мне не нужно продавать этот индикатор всем подряд. Это инструмент для трейдеров, которые думают своей головой, а не волшебная кнопка. Нет пробоя — нет сделки. Серая стрелка — отменённый сигнал: цена не пробила сигнальную свечу, значит, н
ULTRA - это технический индикатор, который который работает по принципу “Все включено” - самостоятельно анализирует рынок, дает торговые сигналы, показывает уровни для установки стоп лосс, а также подсказывает когда нужно закрывать сделки, чтобы получить профит или минимизировать убыток. То есть, не важно, что ты не умеешь анализировать рынок, определять уровни - где поставить SL или плохо совладаешь с мани-менеджментом. ULTRA все это сделает вместо тебя! БОНУС ДЛЯ ПОКУПАТЕЛЯ : После покупки ULT
Gann Made Easy   - это профессиональная, но при этом очень простая в применении Форекс система, основанная на лучших принципах торговли по методам господина У.Д. Ганна. Индикатор дает точные BUY/SELL сигналы, включающие в себя уровни Stop Loss и Take Profit. ПОЖАЛУЙСТА, СВЯЖИТЕСЬ СО МНОЙ ПОСЛЕ ПОКУПКИ, ЧТОБЫ ПОЛУЧИТЬ ТОРГОВЫЕ ИНСТРУКЦИИ И ОТЛИЧНЫЕ ДОПОЛНИТЕЛЬНЫЕ ИНДИКАТОРЫ БЕСПЛАТНО! Вероятно вы уже не раз слышали о торговли по методам Ганна. Как правило теория Ганна отпугивает от себя не только
Boba Analysis Suite
Trade Ready Solutions LLC
5 (2)
Boba Analysis Suite Boba Analysis Suite — аналитический индикатор для MetaTrader 5. Он объединяет структуру рынка, значимые ценовые зоны и общий рыночный контекст в одном представлении на графике. Индикатор разработан на основе практического опыта трейдера и наставника по трейдингу. Он помогает выстроить последовательный процесс анализа: оценивать направление рынка, определять важные уровни и рассматривать несколько таймфреймов в совокупности. Анализ с учётом контекста Значение отдельных сигнало
Azimuth Pro
Ottaviano De Cicco
5 (7)
Azimuth Pro V2: Синтетический фрактальный структурный анализ и подтверждённые входы для MT5 Обзор Azimuth Pro — многоуровневый индикатор свинговой структуры от Merkava Labs . Четыре вложенных уровня свингов, привязанный к свингам VWAP, определение ABC-паттернов, трёхтаймфреймная структурная фильтрация и подтверждённые входы на закрытой свече — один график, один рабочий процесс от микро-свингов до макро-циклов. Это не слепой сигнальный продукт. Это рабочий процесс, основанный на структуре, для т
FiboSniper Pro – Multi-Filter Fibonacci System with Auto SL/TP and Control Panel FiboSniper Pro — это технический индикатор, который объединяет динамические Fibonacci Envelopes с несколькими фильтрами подтверждения для формирования отборных сигналов Buy и Sell. Уровни Fibonacci рассчитываются на основе Moving Average и ATR, а затем фильтруются с помощью ADX, EMA, RSI, ATR, Volume, Time и структуры свечи. Индикатор отображает на графике автоматические уровни Stop Loss и Take Profit на основе ATR,
M1 SNIPER   — это простая в использовании торговая система. Это стрелочный индикатор, разработанный для тайм фрейма M1. Индикатор можно использовать как отдельную систему для скальпинга на тайм фрейме M1, а также как часть вашей существующей торговой системы. Хотя эта торговая система была разработана специально для торговли на M1, ее можно использовать и с другими тайм фреймами. Первоначально я разработал этот метод для торговли XAUUSD и BTCUSD. Но я считаю этот метод полезным и для торговли на
Apex Patterns PRO Купите индикатор — получите Expert Advisor на его основе БЕСПЛАТНО. Самооптимизирующаяся система анализа графических паттернов и пробоев Традиционные сканеры паттернов полагаются на фиксированные входные параметры, что часто приводит к снижению их эффективности при изменении рыночной волатильности и структуры. Apex Patterns PRO разработан для адаптации к меняющимся рыночным условиям, объединяя распознавание структурных графических паттернов, фильтрацию по моментуму и статистич
Sqn Max Indicator Sqn Max is an exclusive indicator to trade the market with high effectiveness. The indicator is based on price action, volatility and trend. This indicator is as simple as possible but not too simple. The indicator can generate alerts to ease the trading process. You don't have to stay all day in front of your screen. The indicator can be used with any class of assets and with any time frame. It is possible to achieve better results trading our list of selected assets. We achi
Adaptive Price Action Engine Купи индикатор — получи советник (EA) к нему бесплатно Самооптимизирующийся мульти-таймфреймовый анализ тренда и свечных моделей Рынок постоянно меняется — и не каждая модель Price Action имеет одинаковую ценность в разных рыночных режимах. Adaptive Price Action Engine создан для адаптации к изменяющимся рыночным условиям, объединяя трендовую структуру, мульти-таймфреймовый анализ, свечные модели и статистическую оптимизацию в единой аналитической системе. Два адапти
Каждый покупатель этого индикатора получает дополнительно Бесплатно: Авторскую утилиту "Bomber Utility", которая автоматически сопровождает каждю торговую операцию, устанавливает уровни Стоп Лосс и Тейк профит и закрывает сделки согласно правилам этой стратегии, Сет-файлы для настройки этого индикатора на различных активах, Сет-файлы для настройки Bomber Utility в режимы: "Минимум Риска", "Взвешенный Риск" и "Стратегия Выжидания", Пошаговый видео-мануал, который поможет вам быстро установить, н
Power Candles V3 — самооптимизирующийся индикатор силы Power Candles V3 преобразует силу валюты и инструмента в готовый к использованию торговый план на каждом графике, к которому он прикреплен. Вместо того, чтобы просто раскрашивать свечи, он выполняет автоматическую оптимизацию в режиме реального времени в фоновом режиме и предоставляет вам оптимальные значения Stop Loss, Take Profit и порог сигнала для выбранного вами символа. Один клик — и все готово для реальной торговли: на графике появляю
Currency Strength Wizard   — очень мощный индикатор, предоставляющий вам комплексное решение для успешной торговли. Индикатор рассчитывает силу той или иной форекс-пары, используя данные всех валют на нескольких тайм фреймах. Эти данные представлены в виде простых в использовании индексов валют и линий силы валют, которые вы можете использовать, чтобы увидеть силу той или иной валюты. Все, что вам нужно, это прикрепить индикатор к графику, на котором вы хотите торговать, и индикатор покажет вам
Naked Forex Tweezer Pro Indicator Tweezer Pro Indicator is a pattern recognition indicator for Forex, Stocks, Indices, Futures, Commodities and Cryptos. The standard Tweezer is a two bar pattern. Our enhanced version is a multi-bar pattern. We filter the patterns for you so that you only get the     best and most effective patterns   and ignore the noise. The Tweezer pattern is a simple and effective pattern to trade. The strategy that comes with the Tweezer is based on price action. The Twe
Auto Optimized SpeedAngle — это система векторизации импульса институционального уровня, которая исключает подгонку под исторические данные (curve-fitting) за счет непрерывной форвард-оптимизации (Walk-Forward Optimization, WFO). Вместо того чтобы полагаться на статические входные параметры, которые теряют эффективность при смене рыночных режимов, индикатор динамически перекалибрует свои настройки, используя валидацию на вневыборочных данных (Out-of-Sample, OOS). Это гарантирует, что отображаемы
Мультивалютный индикатор силы и импульса MT5 Dynamic Forex28 Navigator — развитие наших давно популярных индикаторов, объединяющее силу пяти в одном: Advanced Currency Strength28 Indicator (700 отзывов) Advanced Currency IMPULSE with ALERT (530 отзывов) Currency Strength EXOTICS GOLD Impulse with Alert CS28 Combo Signals (текущий бонус) Не нужно покупать четыре индикатора и ставить их на графики. Всё объединено в одном мощном индикаторе: сила 28 пар Forex, импульс рынка, который их ведёт, и опов
ARICoin is a powerful trading companion designed to generate high-probability entry signals with dynamic TP/SL/DP levels based on volatility. Built-in performance tracking shows win/loss stats, PP1/PP2 hits, and success rates all updated live. Key Features: Buy/Sell signals with adaptive volatility bands Real-time TP/SL/DP levels based on ATR Built-in MA Filter with optional ATR/StdDev volatility Performance stats panel (Success, Profit/Loss, PP1/PP2) Alerts via popup, sound, push, or email Cust
Свинг-трейдинг - это первый индикатор, предназначенный для обнаружения колебаний в направлении тренда и возможных разворотов. Он использует базовый подход свинговой торговли, широко описанный в торговой литературе. Индикатор изучает несколько векторов цен и времени для отслеживания направления совокупного тренда и выявляет ситуации, когда рынок перепродан или перекуплен и готов к исправлению. [ Руководство по установке | Руководство по обновлению | Устранение неполадок | FAQ | Все продукты ] П
Apollo SR Master — это индикатор уровней поддержки/сопротивления со специальными функциями, которые упрощают и повышают надежность торговли с использованием зон поддержки/сопротивления. Индикатор рассчитывает зоны поддержки/сопротивления в режиме реального времени без задержек, выявляя локальные максимумы и минимумы цены. Затем, для подтверждения сформированной зоны поддержки/сопротивления, индикатор выдаёт специальный сигнал, который сигнализирует о том, что зону поддержки/сопротивления можно у
Neuro Poseidon - новый индикатор от Дарьи Резуевой. Он сочетает точные торговые сигналы с адаптивными уровнями TP/SL , в результате создавая максимально выгодные сделки! TO SWITCH TO   ENG   PLEASE CHOOSE IT IN THE UPPER-RIGHT CORNER OF THE WEBSITE Напишите мне и получите  Neuro Poseidon Assistant  в подарок для автоматизации вашей торговли! Что отличает его от других индикаторов? 1. Доказанная прибыльность на всех активах и таймфреймах 2. На графике присутствуют только подтвержденные сигналы н
SIO Oscillator: самооптимизирующийся осциллятор дисбаланса семивариаций Купите индикатор и получите советник (EA) на его основе БЕСПЛАТНО. Большинство осцилляторов воспринимают любое движение цены одинаково. SIO разделяет давление покупателей и продавцов и измеряет дисбаланс между ними, показывая, какая сторона действительно контролирует рынок. Когда дисбаланс достигает экстремума, SIO выдаёт чёткий сигнал с уровнями входа, Stop Loss и Take Profit. Главное отличие SIO в том, что он не полагается
Этот индикатор является уникальным, качественным и доступным инструментом для торговли, включающим в себя наши собственные разработки и новую формулу. В обновленной версии появилась возможность отображать зоны двух таймфреймов. Это означает, что вам будут доступны зоны не только на старшем ТФ, а сразу с двух таймфреймов - таймфрейма графика и старшего: отображение вложенных зон. Обновление обязательно понравится всем трейдерам, торгующим по зонам спроса и предложения. Важная информация Для макс
ScalpPoint is a powerful trading companion designed to generate high-probability entry signals with dynamic TP/SL/DP levels based on volatility. Built-in performance tracking shows win/loss stats, PP1/PP2 hits, and success rates — all updated live. Key Features: Buy/Sell signals with adaptive volatility bands Real-time TP/SL/DP levels based on ATR Built-in MA Filter with optional ATR/StdDev volatility Performance stats panel (Success, Profit/Loss, PP1/PP2) Alerts via popup, sound, push, or emai
Astral Structure Оцените сетап. Посмотрите его первоначальный план. Специальная цена запуска - $99. $149 после запуска. Структурный сетап ставит сразу несколько вопросов: согласуется ли общая картина, где находится ориентир стопа и как определены цели? Astral Structure объединяет эти вопросы в одном рабочем пространстве для трейдеров, самостоятельно принимающих решения на основе структуры рынка. Сосредоточьтесь на актуальном сетапе. Рассматривайте последний подходящий сетап, его направление и кв
Superhero
Ihor Otkydach
5 (3)
SUPERHERO индикатор - это мультивалютная торговая система, которая создана по принципу "Все включено". Индикатор самостоятельно анализирует рынок и дает сигналы когда открывать и когда закрывать сделки. Используются ордера Стоп Лосс и Тейк профит. Соотношение R:R = 1:1 Эта система может присылать на смартфон PUSH-уведомления, так что вы сможете делать сделки "на ходу" без привязки к ПК. Отлично подходит для Проп Фирм трейдинга. БОНУС ДЛЯ КАЖДОГО ПОКУПАТЕЛЯ: Каждый покупатель этого индикатора пол
Bill Williams Advanced предназначен для автоматического анализа графика по системе " Profitunity " Билла Уильямса. Индикатор анализирует сразу четыре таймфрейма. Инструкция/Мануал ( Обязательно читайте перед приобретением ) Преимущества 1. Анализирует график по системе "Profitunity" Билла Уильямса. Сигналы помещает в таблицу в углу экрана и на график цены. 2. Находит все известные сигналы АО и АС, а также сигналы зон. Оснащён трендовым фильтром по Аллигатору. 3. Находит "Дивергентный бар", а та
Naked Forex Kangaroo Tail Pro Indicator Kangaroo Tail Pro Indicator is a pattern recognition indicator for Forex, Stocks, Indices, Futures, Commodities and Cryptos. The Kangaroo Tail is a multi-bar pattern. The Kangaroo Tail pattern is very effective and is very simple to trade. The strategy that comes with the Kangaroo Tail is based on price action. The indicator does what it was designed for: displaying Kangaroo Tail patterns.     Don't expect to follow the up and down arrows and make mone
AriFocus - Non-Repainting Buy/Sell Signals AriFocus - one clear signal. AriFocus marks buy and sell signals directly on the chart and suggests a stop-loss level for each one. Every signal is confirmed on bar close and never repaints. - Buy/sell arrows, confirmed on bar close - Suggested stop-loss level for every signal - Trend band and candle coloring to show direction at a glance - 10 ready-made presets, or your own settings (14 calculation methods) - Pop-up, push and email alerts with entr
RSI Thunder MT5
Muhammad Abdulrahman Omar Naima Allah Al-rais
RSI Thunder — это мощный и интеллектуальный торговый индикатор, созданный для трейдеров, которые ценят точность и качество сигналов. Индикатор формирует сигналы только после закрытия свечи, полностью исключая перерисовку и ложные входы. Он объединяет RSI, EMA, ADX и ATR в одной логической системе, дополненной строгим фильтром направления тренда SMA40. RSI Thunder анализирует последние пять свечей и подтверждает сигнал только при наличии четкой рыночной структуры. Индикатор отображает наглядные
Другие продукты этого автора
Индикатор Cycle Finder Pro (CFP) предназначен для обучения начинающих трейдеров интерпретации цикличности и тренда. Он также полезен для опытных трейдеров, желающих улучшить навык анализа графиков. Исследование графика начинается с выявления циклов , а умение делать это точно и последовательно является ключевым элементом для успешной торговли с использованием технического анализа. Большинство трейдеров ориентируются на индикаторы наподобие скользящих средних при анализе графиков или подтверждени
EVERY MARKET YOU FOLLOW, ALL YOUR TIMEFRAMES, ON ONE TABLE If you follow the trend on more than one timeframe, checking every market chart by chart is slow, and it is easy to miss one. Trend Viewer Pro reads it for you. For every market on your list it shows the trend on up to three timeframes of your choosing, in one table on any chart, and sums each market up in a single word: **STRONG**, **BULL**, **BEAR** or **MIXED**. Every reading is Cycle Finder Pro's. A high is confirmed when two lat
Индикатор силы, который измеряет движение цены для подтверждения тренда и силы. Продвинутый мультивалютный и мультитаймфреймовый индикатор, который позволяет одним взглядом на график увидеть все валютные пары в тренде , а также самые сильные и слабые валюты, движущие этими трендами. Этот индикатор интеллектуально анализирует движения цен 28 валютных пар одновременно на всех таймфреймах в режиме реального времени , поэтому вы всегда будете знать о самых сильных и слабых валютах в составе пары . C
## THE CHART, READ FOR YOU. Chart reading is slow, and it is easy to get wrong. You need to know which highs and lows actually matter, which ones the market has already invalidated, and what the ones that remain are telling you. Miss a point and the whole read changes. Cycle Finder Pro marks TRUE highs and lows, and nothing else. A high is confirmed when two subsequent bars each take out the low beneath them. A low when two take out the high above. The bars need not be consecutive — the marke
EVERY MARKET YOU FOLLOW, ON YOUR TIMEFRAMES, IN ONE TABLE If you follow the trend on more than one timeframe, checking every market chart by chart is  slow, and it is easy to miss one. Trend Viewer Pro reads it for you. For every market on your list it shows the trend on up  to three timeframes of your choosing, in one table on any chart, and sums each market up in  a single word: **STRONG**, **BULL**, **BEAR** or **MIXED**. Every reading is Cycle Finder Pro's. A high is confirmed when two late
Фильтр:
Нет отзывов
Ответ на отзыв