TrendArrowPro
- Indicators
-
Kohei Takahashi
 MQL5 developer focused on verified, test-driven delivery.
I build MetaTrader 5 Expert Advisors, indicators and utilities with an
engineering-first workflow:
- Published on MQL5 Market — 6 products: a news-event risk utility, - Version: 1.0
- Activations: 10
TrendArrow Pro - A pullback entry rule you can actually check.
WHAT IT DOES
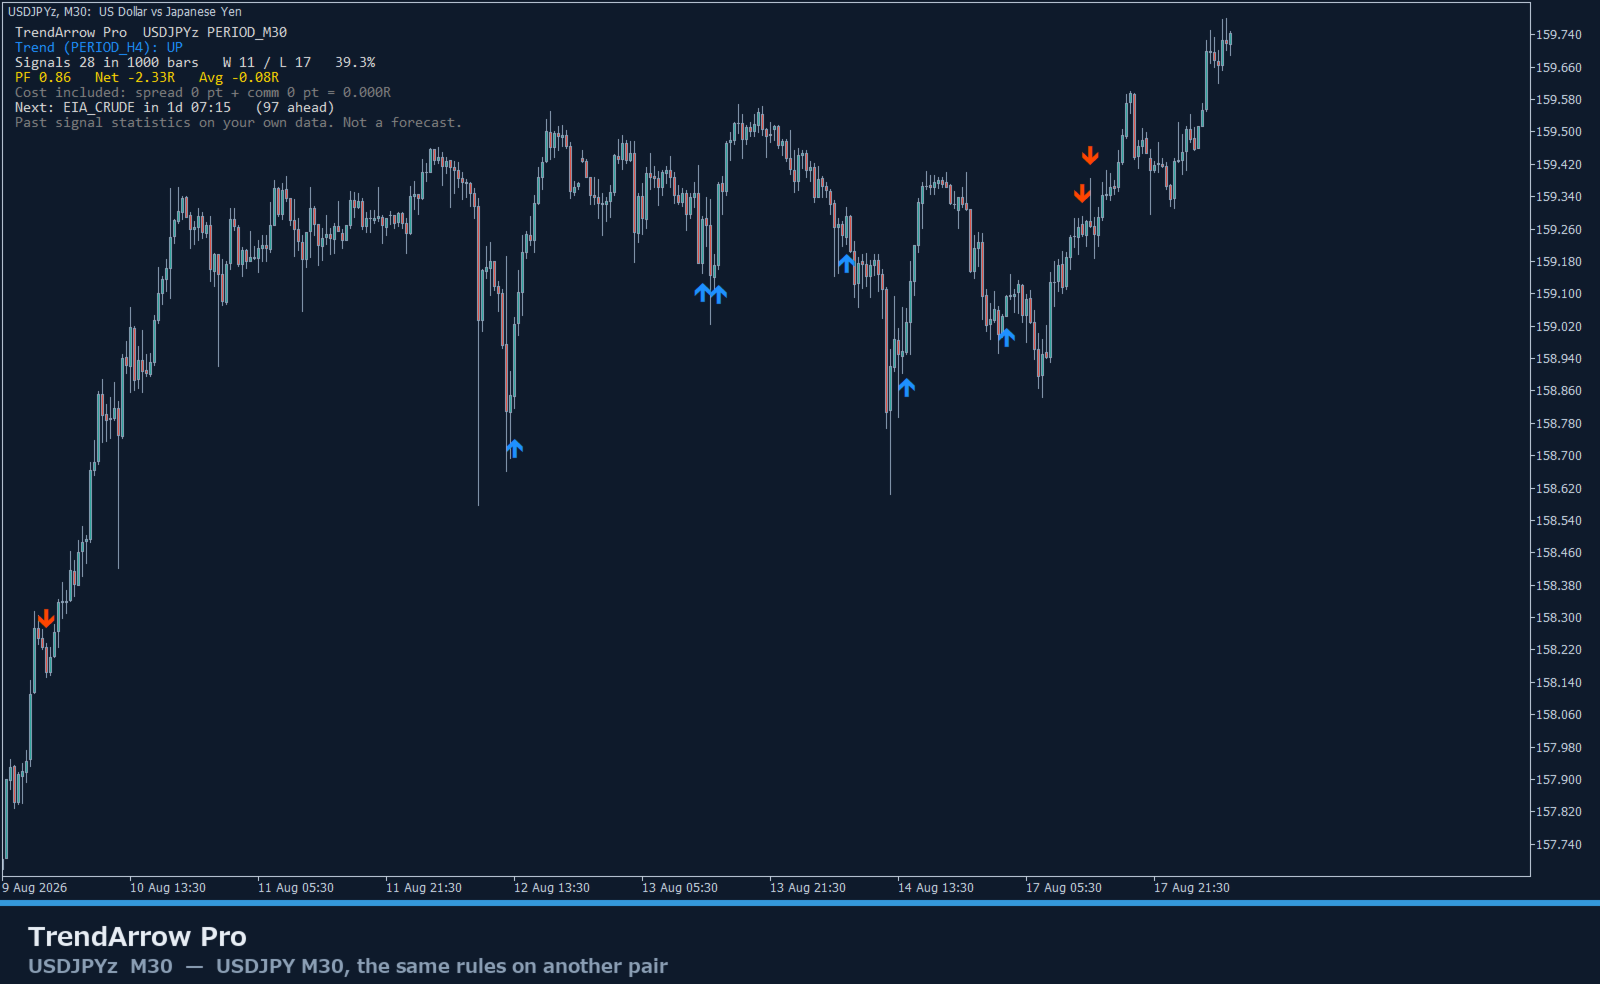
Three conditions must agree before an arrow appears:
1. Trend. The higher-timeframe moving average must be sloping AND ADX
must be above your threshold. A ranging market produces no arrows.
2. Pullback. Price must come back into an ATR band around the moving
average on the chart timeframe.
3. Trigger. RSI must cross back out of its band, or the MACD histogram
must change sign - your choice, or both together.
Optionally the last confirmed swing must agree, and the bar must not fall
inside an economic release window.
Each arrow carries a suggested stop and target at ATR multiples you set,
exposed as indicator buffers so an Expert Advisor can read them.
DOES NOT REPAINT - AND YOU CAN CHECK IT YOURSELF
Every condition is evaluated on CLOSED bars. The bar still being built is
never written to, and a value written to a closed bar is never written
again.
The higher timeframe is read from bars that had already closed at that
moment, which is where most multi-timeframe tools quietly start to move.
The cost is up to one higher-timeframe bar of freshness. That is the
price of a signal that still looks the same tomorrow.
Attach it, let a few bars pass, then reload the chart or restart the
terminal. Nothing moves.
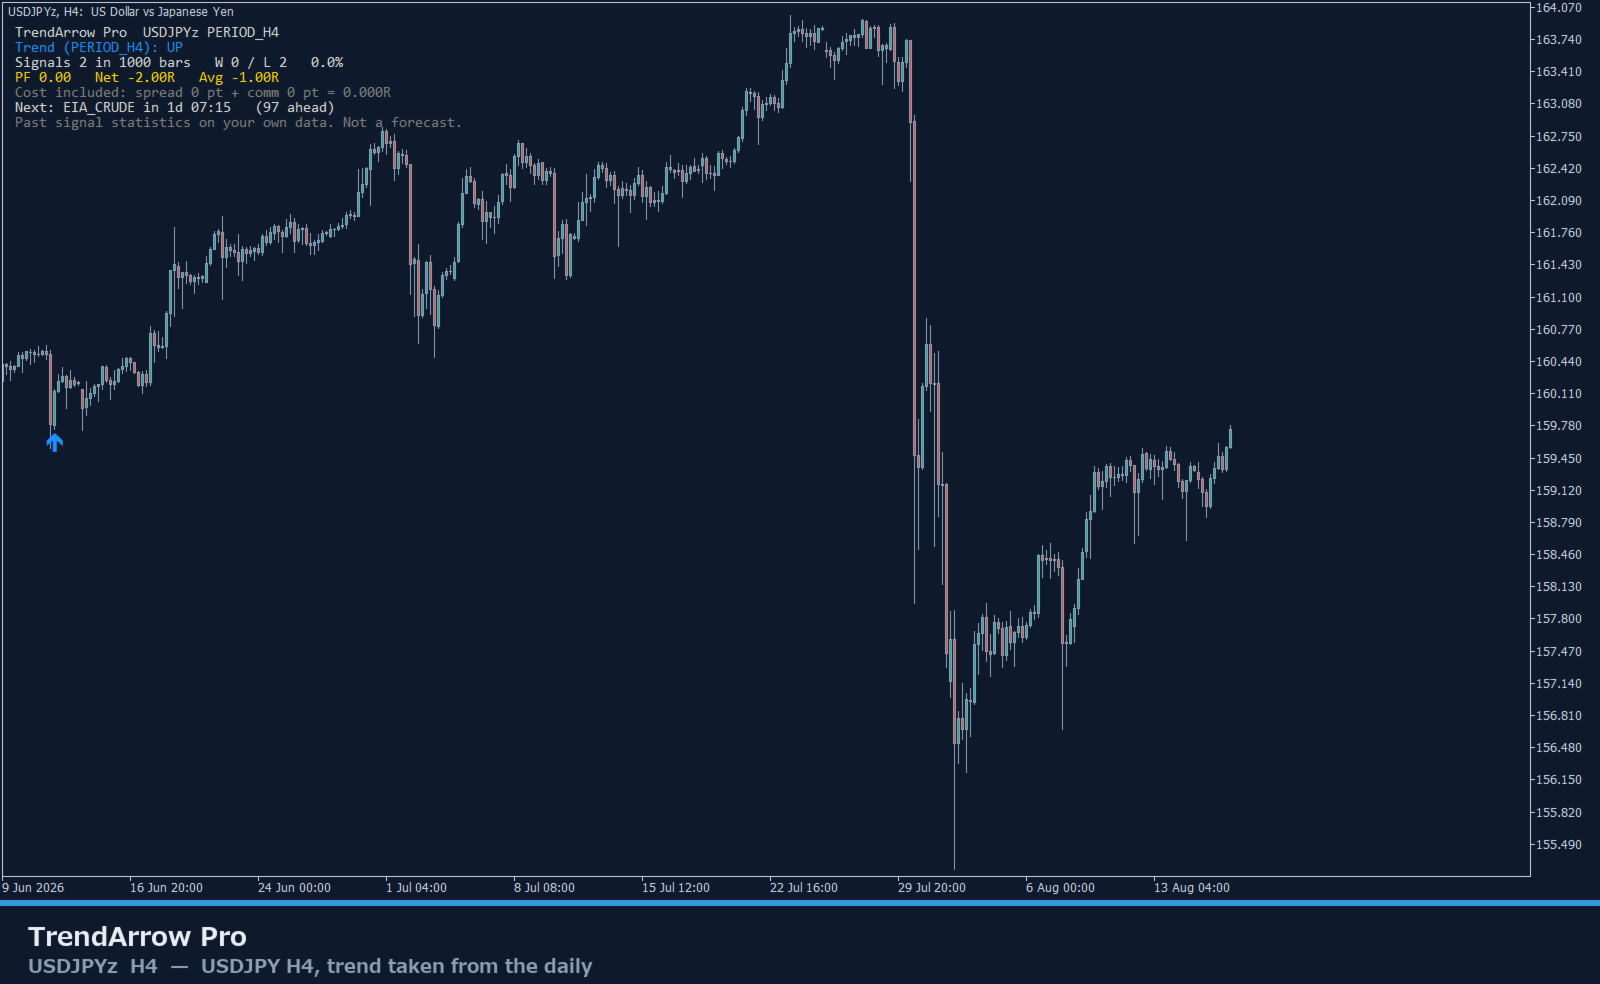
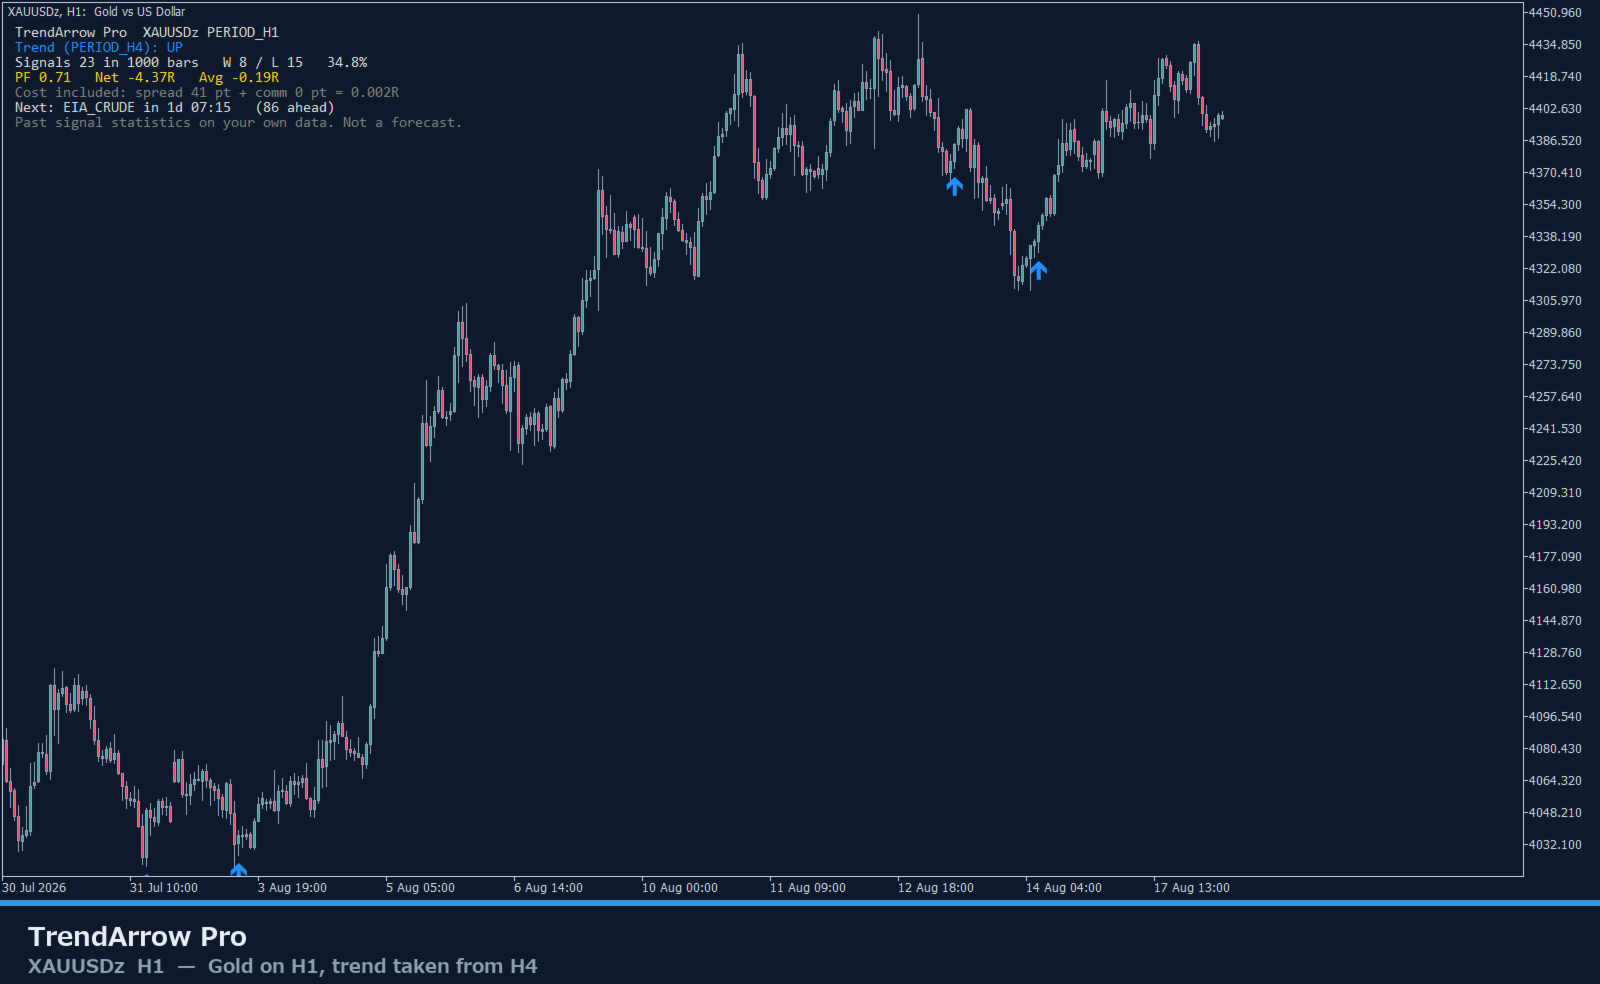
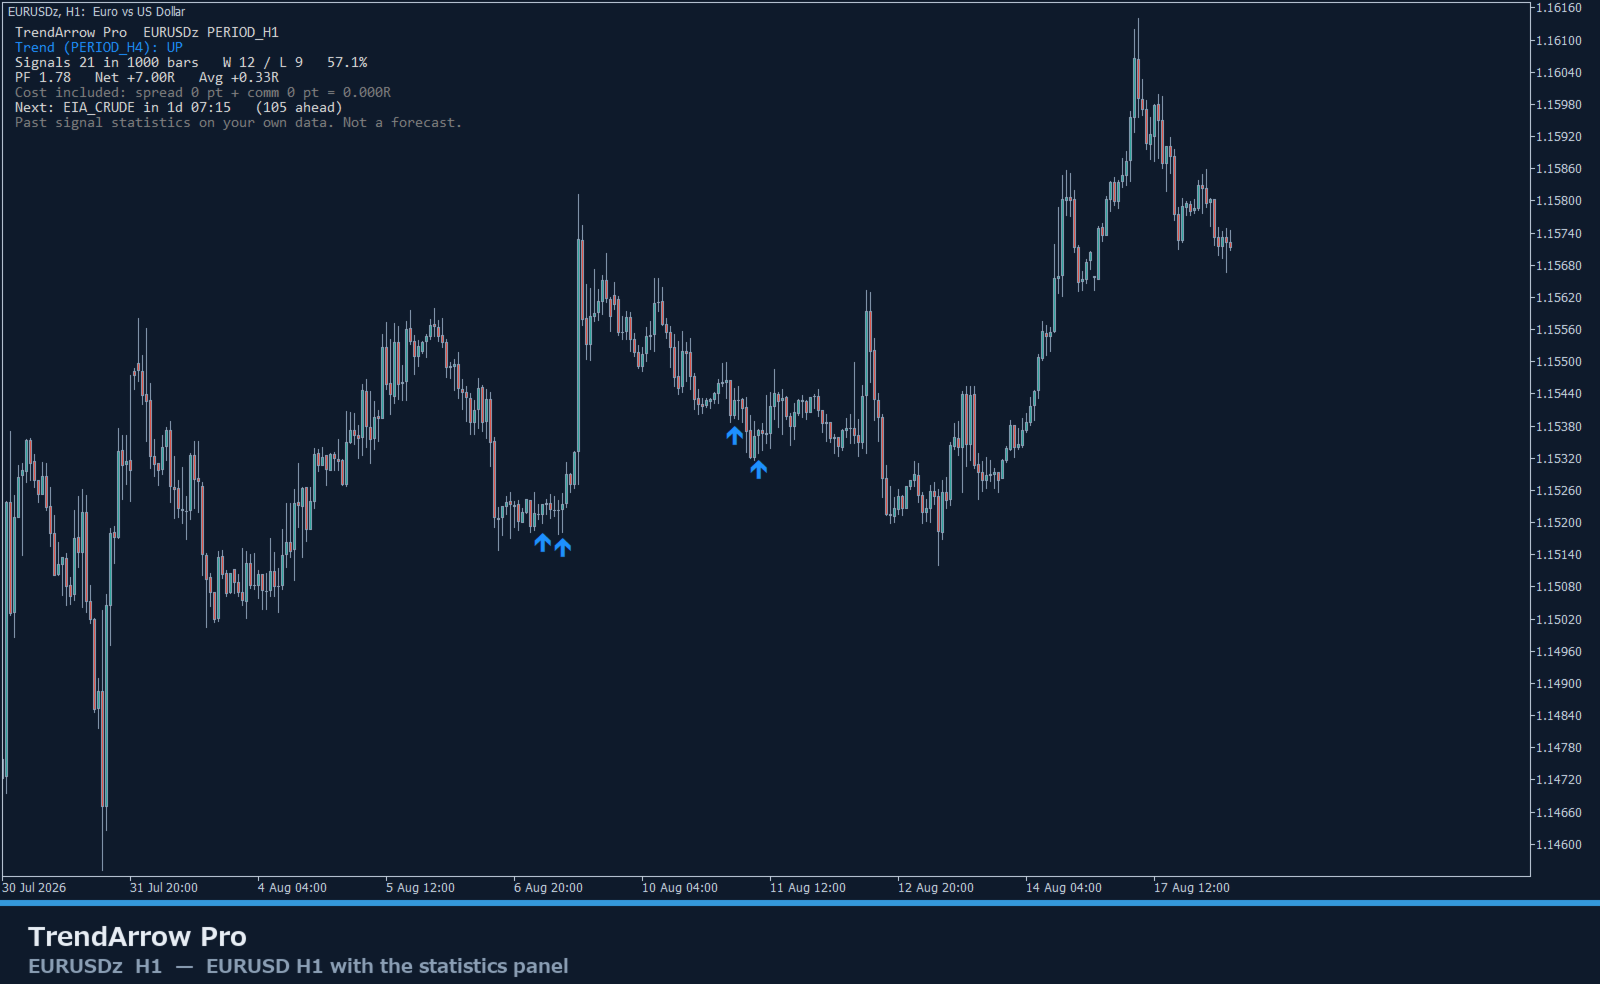
THE PANEL MEASURES ITS OWN ARROWS
Most tools in this category quote a win rate in the description and show
none on the chart. This one computes it in front of you: it follows every
arrow in a trailing window, decides whether the stop or the target came
first, and reports the count, the win rate, the profit factor and the
average R - with the spread YOUR broker recorded on each bar plus a
commission you enter. Where a single bar contains both the stop and the
target, the stop is assumed to have been hit first, because bar data
cannot resolve the order and guessing favourably is how vendors produce
fiction. Signals that have not resolved yet are shown separately, not
folded into the ratios.
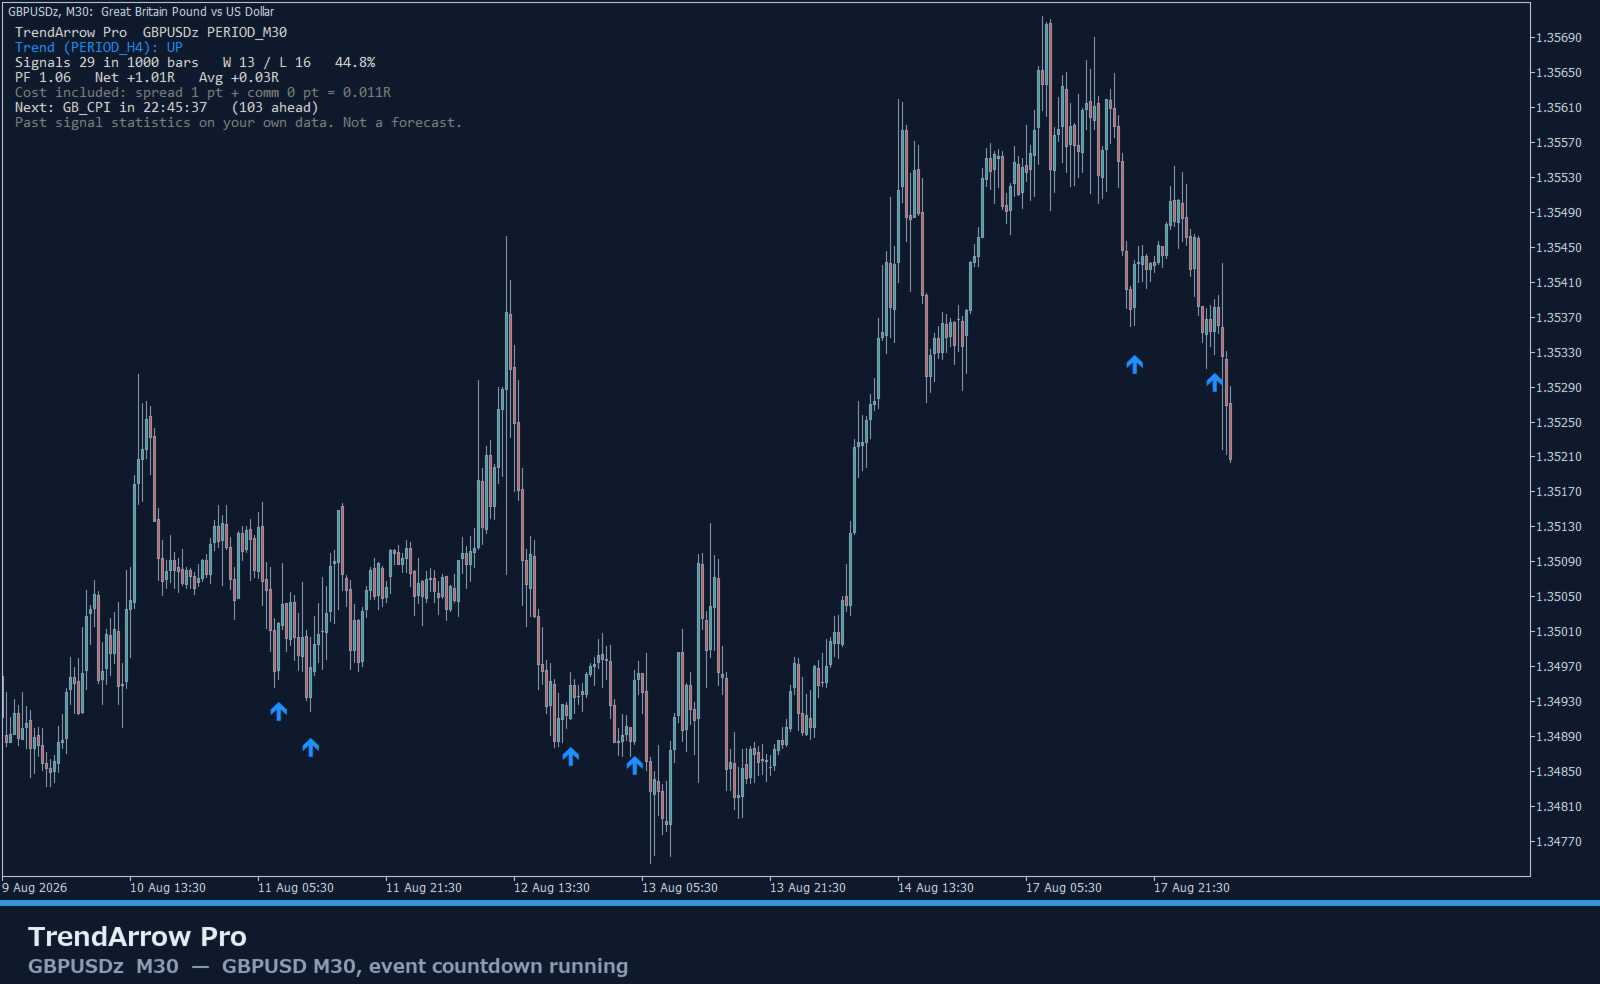
ECONOMIC EVENT FILTER
4101 releases are built into the product (2005-01-07 to 2028-12-07),
tagged by currency and matched automatically against the chart symbol:
FOMC, NFP, US_CPI, ECB, BOE, GB_CPI, BOJ, RBA, RBNZ, BOC, CH_CPI, EIA_CRUDE, USD_JOBLESS, US_RETAIL_SALES, AUCTION_LONG.
Set how many minutes before and after a release the tool should stay
quiet, and no arrows are drawn inside that window. In live trading the
terminal's own Economic Calendar extends the schedule automatically, so
the filter keeps working after the bundled dates run out. Backtests use
the bundled schedule only, so your results stay reproducible.
ALERTS
Popup, sound, email and push, each switchable. One alert per closed bar,
and nothing fires for bars that were already on the chart when you
attached it - no burst of history alerts on startup.
PRESETS INCLUDED
Gold_H1 - XAUUSD H1. Wider stop and a stricter range filter, because gold's ATR and spread are both large.
FXMajors_H1 - Major FX pairs on H1 with the H4 trend. The default starting point.
Indices_M30 - Indices on M30 with the H1 trend. Shorter holding, tighter target.
Swing_H4 - H4 chart with the daily trend. Few signals, wide brackets, both confirmations required.
NewsAvoid_Strict - Same as the default but stays out for a full hour around every bundled release.
They are starting points for the settings, not recommended entries.
WHAT THIS IS NOT
It is not a trading system and it does not predict anything. It is a way
to state a discretionary rule precisely enough to be measured, and then
to measure it on your own data. The statistics panel shows how the
drawing rule behaved in the past on your broker's feed; past behaviour is
not a forecast, and the numbers will differ on your symbol and settings.
Use it as one input to your own decision, with your own risk management.
REQUIREMENTS
MetaTrader 5, any symbol, any timeframe. 40 inputs, all documented in
the Inputs tab. No DLL calls, no external files, no internet access.