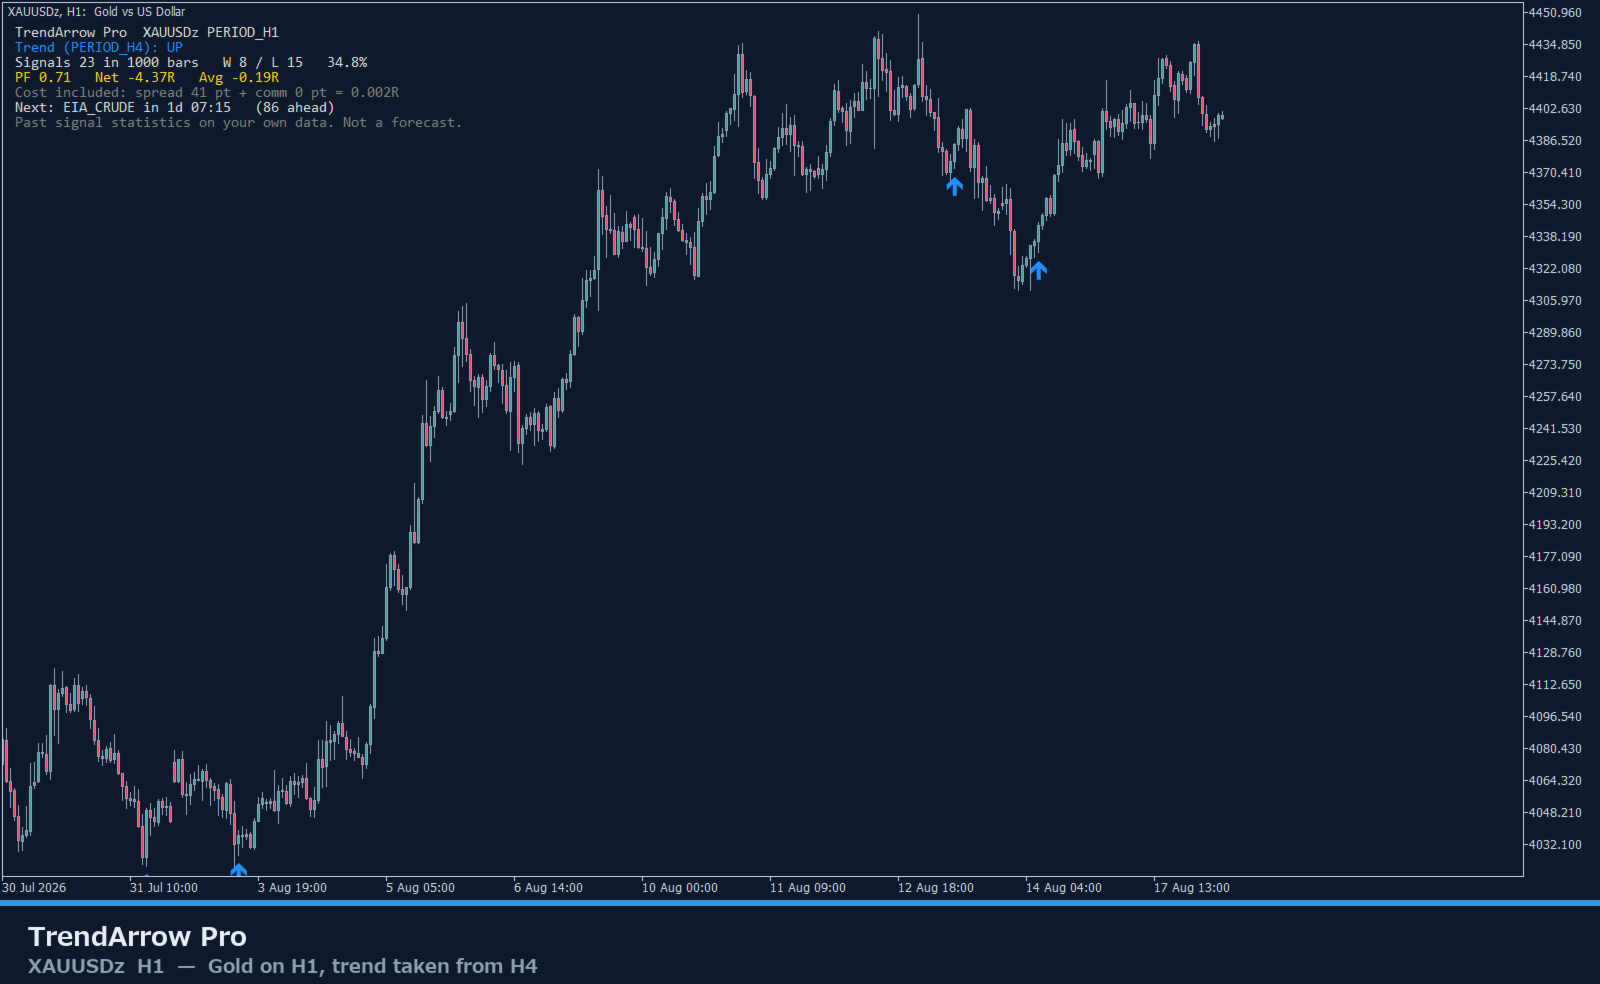
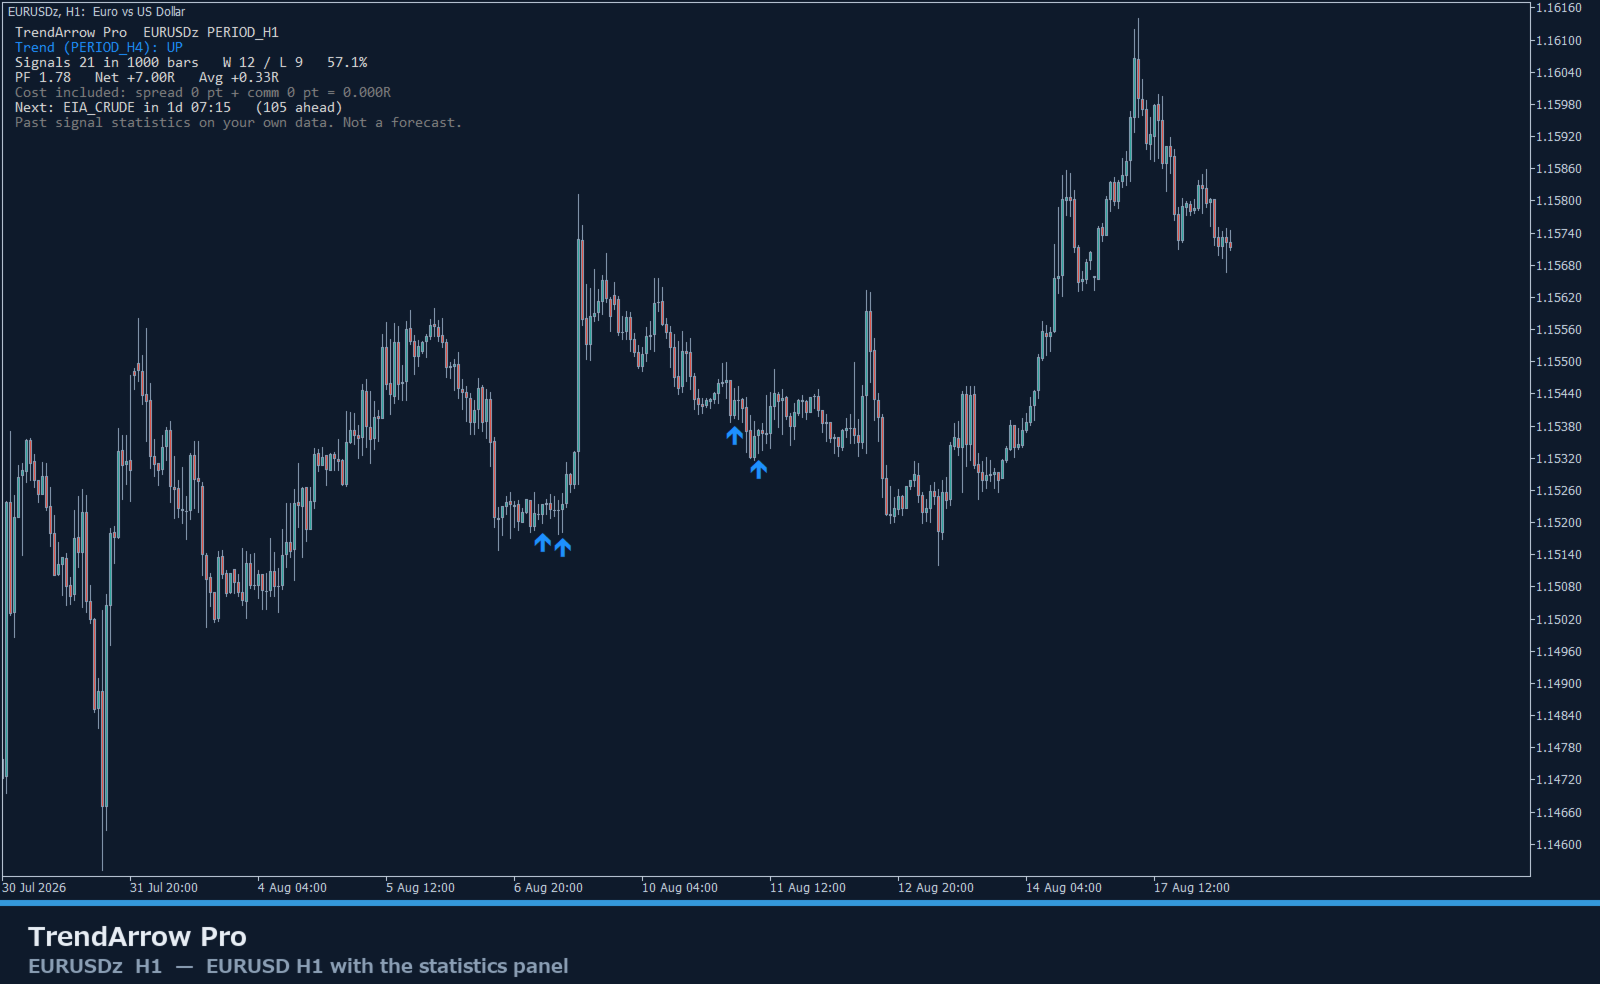
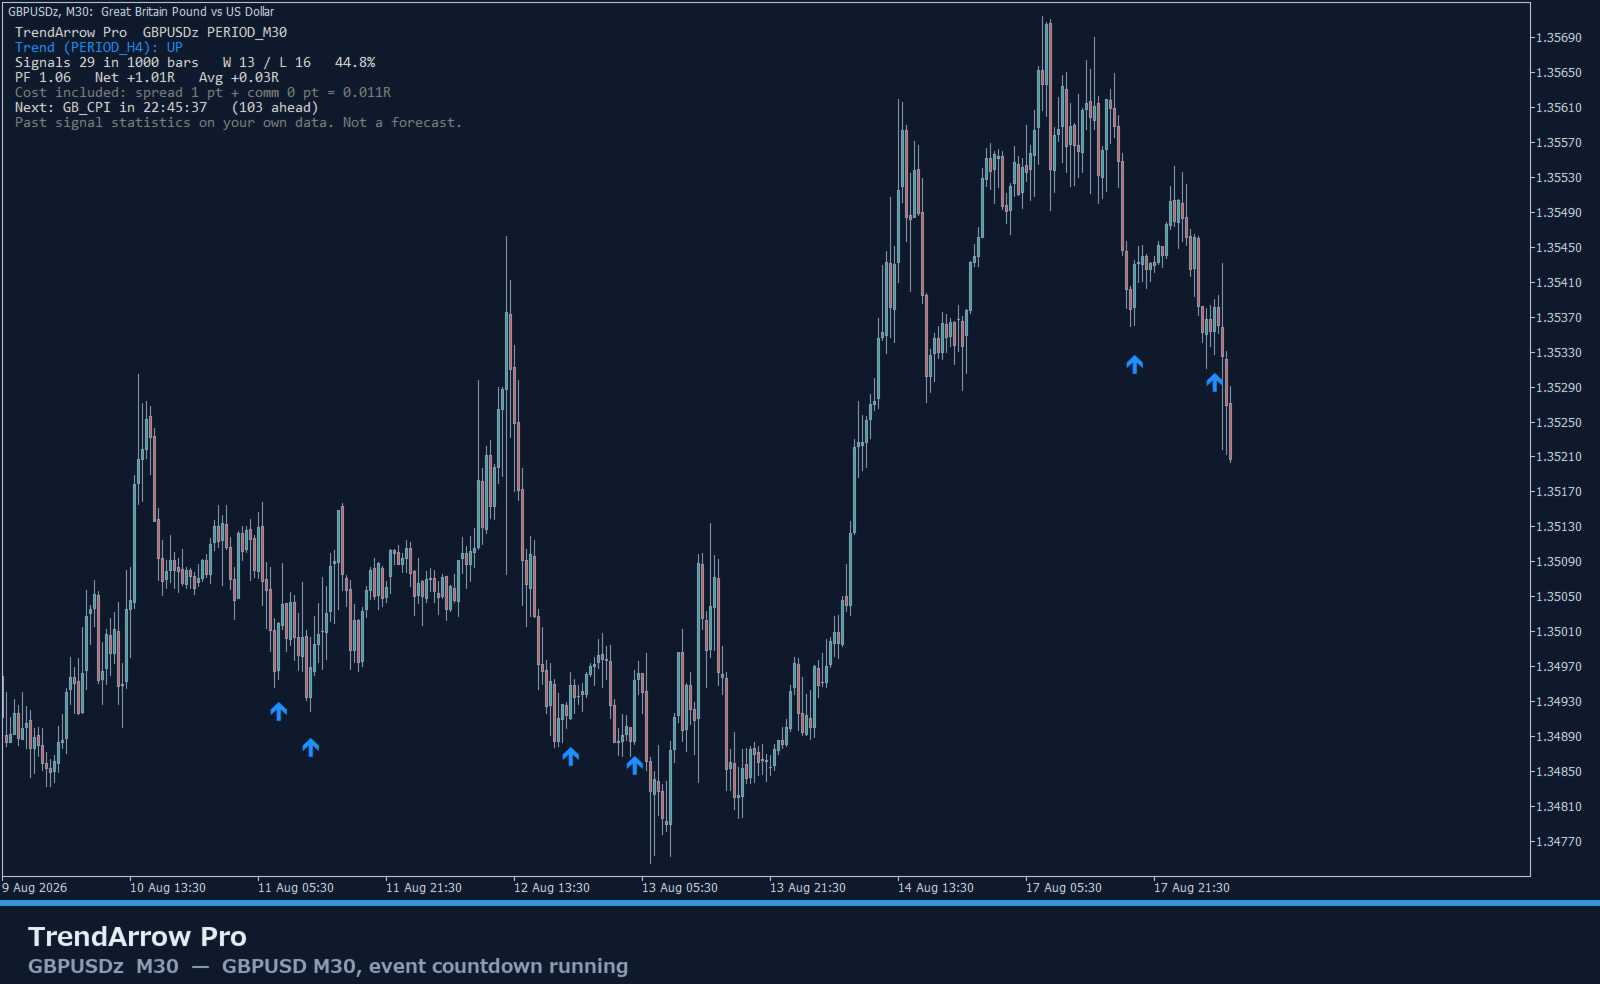
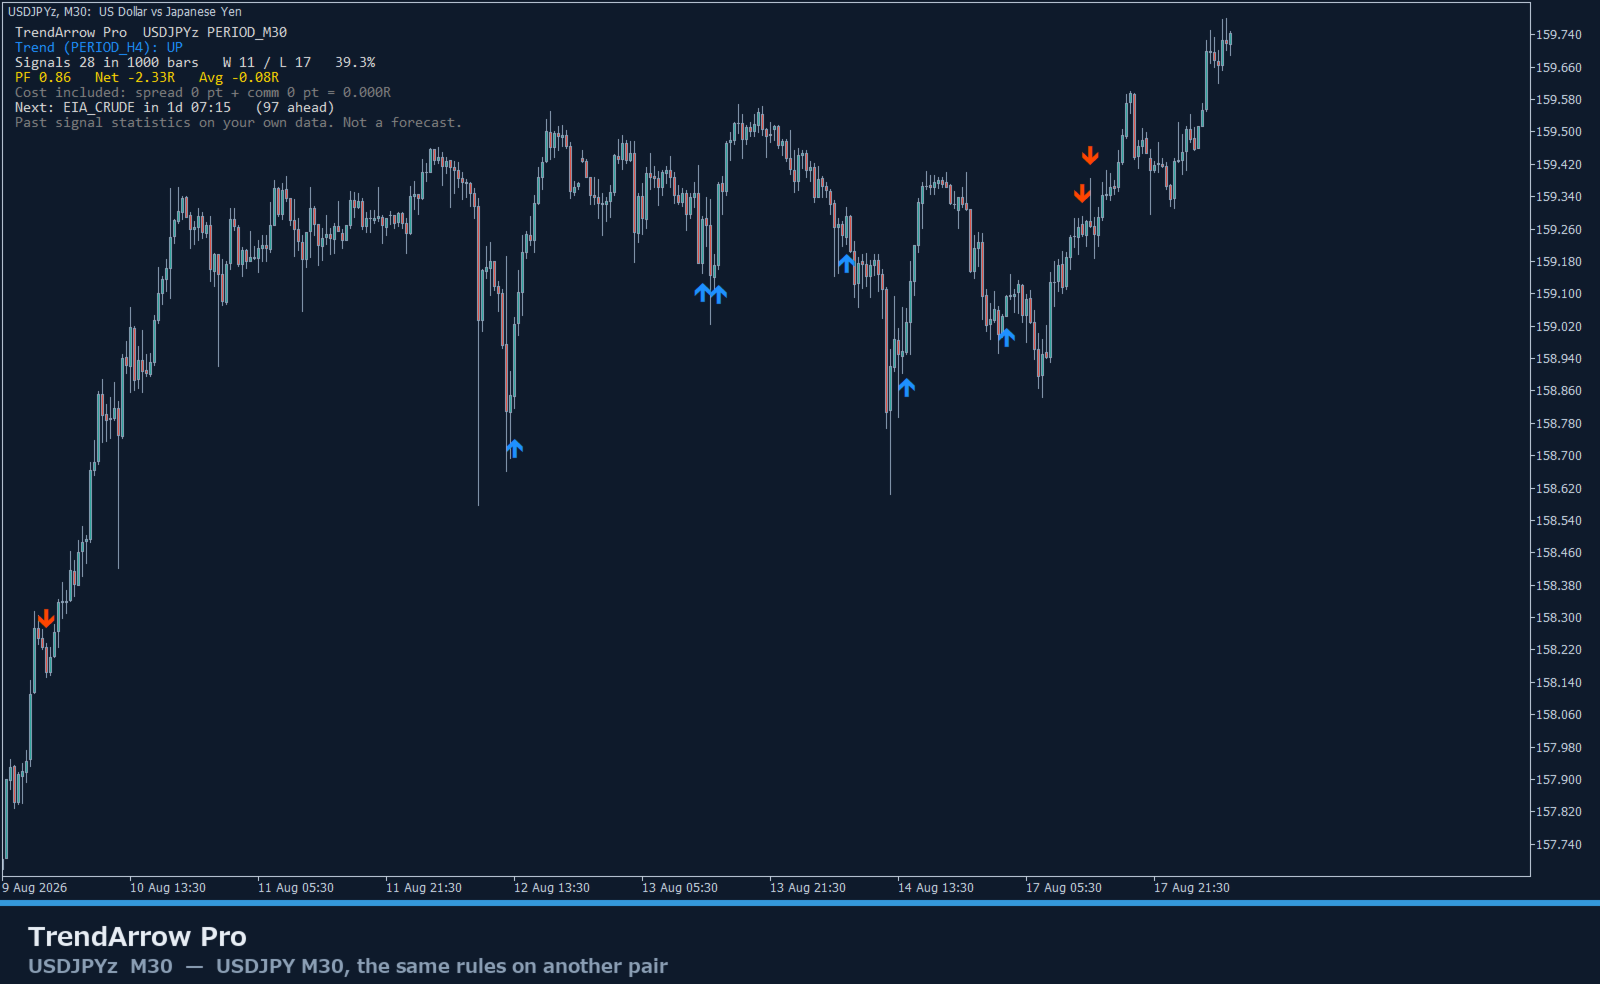
TrendArrowPro

  • インディケータ
  • Kohei Takahashi
    Kohei Takahashi
    MQL5 developer focused on verified, test-driven delivery.
    I build MetaTrader 5 Expert Advisors, indicators and utilities with an
    engineering-first workflow:
    - Published on MQL5 Market — 6 products: a news-event risk utility,
  • バージョン: 1.0
  • アクティベーション: 10
TrendArrow Pro - A pullback entry rule you can actually check.

WHAT IT DOES
Three conditions must agree before an arrow appears:
  1. Trend. The higher-timeframe moving average must be sloping AND ADX
     must be above your threshold. A ranging market produces no arrows.
  2. Pullback. Price must come back into an ATR band around the moving
     average on the chart timeframe.
  3. Trigger. RSI must cross back out of its band, or the MACD histogram
     must change sign - your choice, or both together.
Optionally the last confirmed swing must agree, and the bar must not fall
inside an economic release window.
Each arrow carries a suggested stop and target at ATR multiples you set,
exposed as indicator buffers so an Expert Advisor can read them.

DOES NOT REPAINT - AND YOU CAN CHECK IT YOURSELF
Every condition is evaluated on CLOSED bars. The bar still being built is
never written to, and a value written to a closed bar is never written
again.
The higher timeframe is read from bars that had already closed at that
moment, which is where most multi-timeframe tools quietly start to move.
The cost is up to one higher-timeframe bar of freshness. That is the
price of a signal that still looks the same tomorrow.
Attach it, let a few bars pass, then reload the chart or restart the
terminal. Nothing moves.

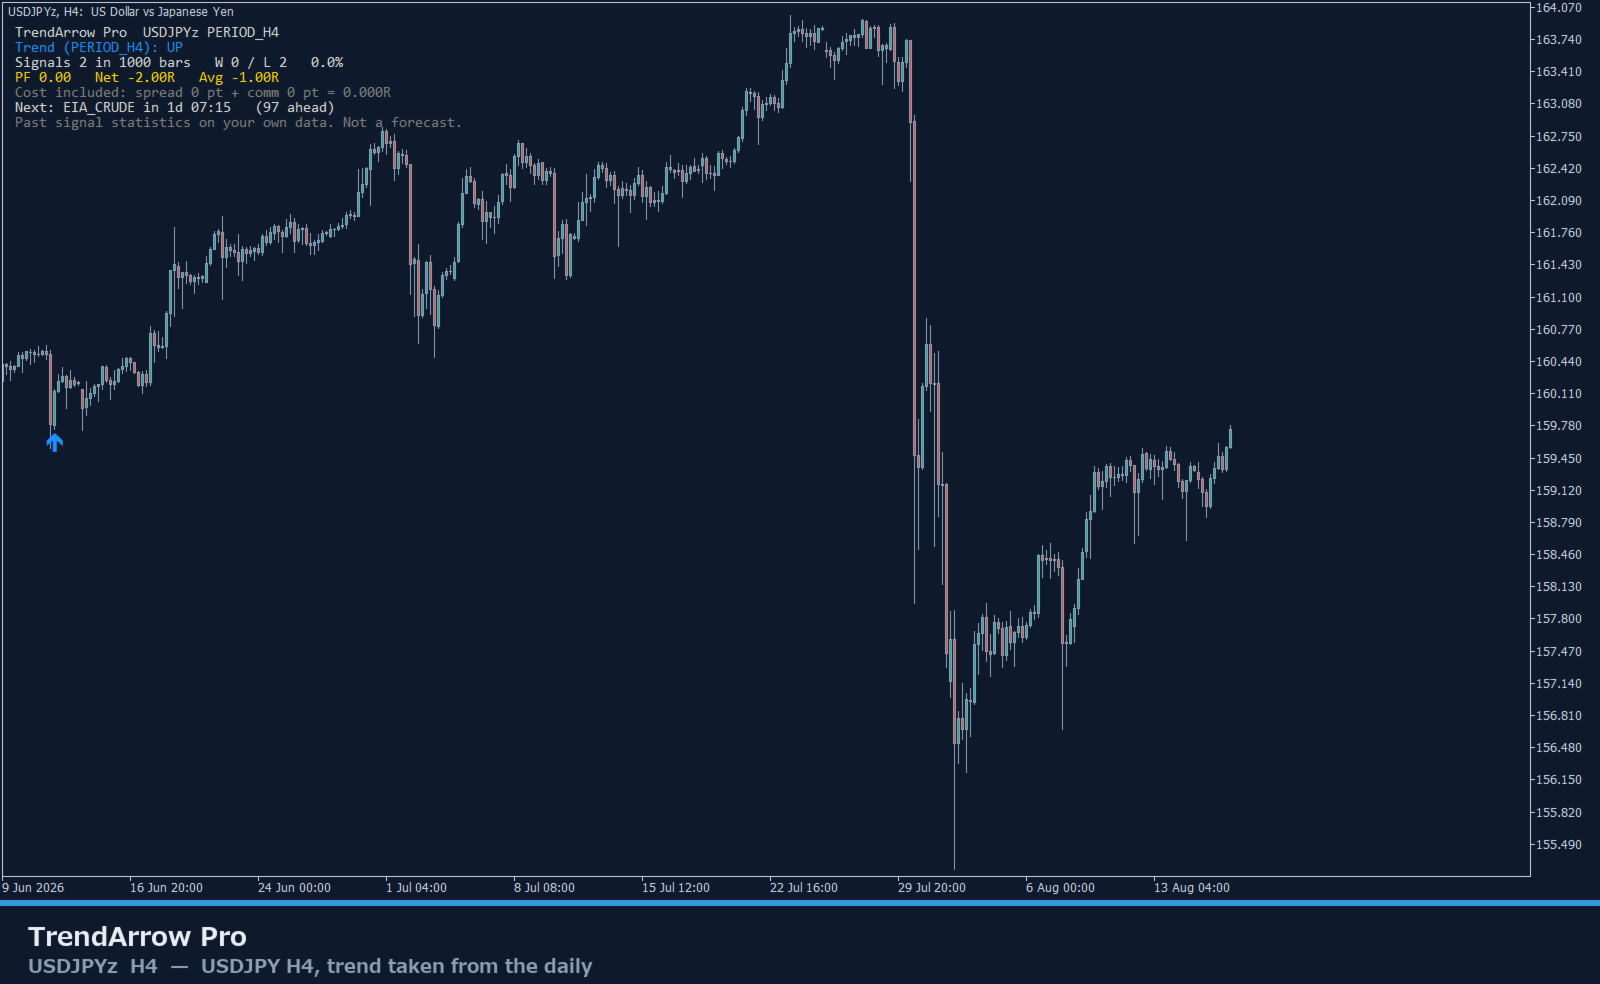
THE PANEL MEASURES ITS OWN ARROWS
Most tools in this category quote a win rate in the description and show
none on the chart. This one computes it in front of you: it follows every
arrow in a trailing window, decides whether the stop or the target came
first, and reports the count, the win rate, the profit factor and the
average R - with the spread YOUR broker recorded on each bar plus a
commission you enter. Where a single bar contains both the stop and the
target, the stop is assumed to have been hit first, because bar data
cannot resolve the order and guessing favourably is how vendors produce
fiction. Signals that have not resolved yet are shown separately, not
folded into the ratios.

ECONOMIC EVENT FILTER
4101 releases are built into the product (2005-01-07 to 2028-12-07),
tagged by currency and matched automatically against the chart symbol:
FOMC, NFP, US_CPI, ECB, BOE, GB_CPI, BOJ, RBA, RBNZ, BOC, CH_CPI, EIA_CRUDE, USD_JOBLESS, US_RETAIL_SALES, AUCTION_LONG.
Set how many minutes before and after a release the tool should stay
quiet, and no arrows are drawn inside that window. In live trading the
terminal's own Economic Calendar extends the schedule automatically, so
the filter keeps working after the bundled dates run out. Backtests use
the bundled schedule only, so your results stay reproducible.

ALERTS
Popup, sound, email and push, each switchable. One alert per closed bar,
and nothing fires for bars that were already on the chart when you
attached it - no burst of history alerts on startup.

PRESETS INCLUDED
  Gold_H1  -  XAUUSD H1. Wider stop and a stricter range filter, because gold's ATR and spread are both large.
  FXMajors_H1  -  Major FX pairs on H1 with the H4 trend. The default starting point.
  Indices_M30  -  Indices on M30 with the H1 trend. Shorter holding, tighter target.
  Swing_H4  -  H4 chart with the daily trend. Few signals, wide brackets, both confirmations required.
  NewsAvoid_Strict  -  Same as the default but stays out for a full hour around every bundled release.
They are starting points for the settings, not recommended entries.

WHAT THIS IS NOT
It is not a trading system and it does not predict anything. It is a way
to state a discretionary rule precisely enough to be measured, and then
to measure it on your own data. The statistics panel shows how the
drawing rule behaved in the past on your broker's feed; past behaviour is
not a forecast, and the numbers will differ on your symbol and settings.
Use it as one input to your own decision, with your own risk management.

REQUIREMENTS
MetaTrader 5, any symbol, any timeframe. 40 inputs, all documented in
the Inputs tab. No DLL calls, no external files, no internet access.
おすすめのプロダクト
GDS Renko Entry Helper - Free Renko Price Interaction Indicator for MetaTrader 5 GDS Renko Entry Helper is a free Renko price interaction indicator for MetaTrader 5. It helps traders highlight important areas where price reacts, slows down, returns to a zone or changes behavior around support and resistance. The tool is designed for manual Renko analysis. It does not generate buy or sell signals and does not tell the trader when to enter the market. Its purpose is to help focus attention on area
このインジケーターは実践的なトレードに最適な自動波動分析のインジケーターです! 場合... 注:   Tang Lun (Tang Zhong Shuo Zen) の命名規則の影響で、私は波のグレーディングに西洋の名前を使用することに慣れていません。基本的な波を ペン 、二次波のバンドを セグメント と名付けました。同時に、 セグメント にはトレンドの方向が指定されます (この命名方法は将来のノートで使用されます。最初に言っておきます)。ただし、アルゴリズムは曲がりくねった理論とはほとんど関係がないため、付けるべきではありません。これは、私の市場分析 によって要約された、絶えず変化する複雑な運用ルール を反映しています。 バンドは標準化され、人によって異なることがないよう定義されており、市場参入を厳密に分析する上で重要な役割を果たす人為的な干渉の描画方法が排除されています。 このインジケーターを使用することは、取引インターフェイスの美しさを改善することと同等であり、元の K ライン取引を放棄し、取引の新しいレベルに連れて行きます。また、宣伝の観点から顧客の認識も向上します。 イ
The  OBV MTF  is an Enterprise-grade On-Balance Volume indicator that transforms standard OBV into a complete trading system. It combines gradient-aware momentum analysis, divergence detection, multi-timeframe alignment, and dynamic customisable midpoint-filtering in a single intuitive professional volume analysis tool. Core Features 1. 5-State Momentum Engine Aqua (Strong Bullish) : OBV slope rising with positive acceleration SteelBlue (Weak Bullish) : OBV rising but losing momentum Gray (Neutr
RSIScalperProをご紹介します - MetaTrader 5用のRSIベースの画期的なインジケーターで、1分足チャートでのスキャルピングに最適です!RSIScalperProを使うことで、正確なエントリーとエグジットのシグナルを得られる強力なツールを手に入れることができます。 RSIScalperProは、オーバーボートとオーバーソールドのレベルに対する明確なシグナルを提供する2つの異なるRSI指標を使用しています。好みに合わせて2つのRSIの時間枠や制限値を調整することができ、トレーディング戦略に最適な結果を得ることができます。チャート上の個々の矢印は、トレードのエントリーとエグジットのタイミングを簡単に特定するのに役立ちます。 また、RSIScalperProの特徴の1つは、カスタマイズ可能な3つの移動平均線です。これにより、トレンドの方向を判断し、強力なトレードシグナルを確認するのに役立ちます。これにより、早い段階でトレンドを検出し、収益性の高い取引に参加することができます。 さらに、RSIScalperProを新しい取引シグナルが出た際に音で知らせるように設定するこ
EYeQ インジケーターは、STEP INDEX、VOLATILITY 10、25、50、75 100、BOOM、および CRUSH でエントリーシグナルを提供するための強力なツールです。 BOOMやCRUSH 300、500、1000でのSPIKESをより効果的にキャッチ。 EYeQ インジケーターは、複数の時間枠にわたって市場を分析し、トレンドに基づいて最適なエントリー ポイントを見つけます。デスクトップ アラートをオンにするだけで、シグナルがリリースされたときに通知を受け取ることができます。電話やタブレットなどの他のポータブル デバイスへのプッシュ通知を許可して、そのようなデバイスでのリモート取引のアラートを受け取ります。 N/B: Boom および Crush インデックスでの TRADING TICKS の取引は避けてください。また、指標は終了ポイントを提供しないことに注意してください。MetaTrader プラットフォームの各商品の最小ロット サイズで 3 USD の利益が発生した場合は、終了する必要があります。 例: 最低ロットサイズ;ステップインデックス-0.
Floating peaks oscillator - it the manual trading system. It's based on Stochastik/RSI type of oscillator with dynamic/floating  overbought and oversold levels. When main line is green - market is under bullish pressure, when main line is red - market is under bearish pressure. Buy arrow appears at the floating bottom and sell arrow appears at floating top. Indicator allows to reverse signal types. Main indicator's adjustable inputs : mainTrendPeriod; signalTrendPeriod; smoothedTrendPeriod; tre
Note: If you want to apply this indicators on indicators which are shown in a sub-window, then consider using this indicator instead:  https://www.mql5.com/en/market/product/109066.&nbsp ; AIntel Predict - Your Gateway to Future Trading Success! Unlock the power of predictive analytics with AIntel Predict. Say goodbye to the guesswork and hello to improved forecasting, as AIntel Predict leverages historical data to unveil the future of your trades like never before. Whether you're a seasoned tra
Caicai L&S Yield Histogram Important Notice: This indicator is an integral tool of the automated EA Caicai Long and Short Pair Trading . This indicator visually displays the percentage deviation (Yield %) of a pair's current spread relative to its own historical mean. It is an excellent tool for quickly visualizing the gross financial potential of a market distortion in Long & Short operations. Main Features: Percentage Visualization: Understand the size of the distortion in palpable percentage
Avez-vous toujours rêvé de pouvoir entrer sur le marché juste après la clôture d'une bougie… et de voir le marché évoluer immédiatement dans votre sens ? Avez-vous toujours souhaité détecter les retournements de tendance plus tôt, éviter les faux signaux et, surtout, saisir les tendances longues avant la majorité des traders ? Aujourd'hui, je vais vous présenter mon nouvel indicateur : Prophète du retournement intelligent. Contrairement aux indicateurs traditionnels qui réagissent avec un certa
Matsukaze Reversal Scanner Matsukaze Reversal Scanner is a professional-grade M1 indicator that combines Bollinger Bands + RSI reversal signals with a built-in multi-pair scanner, currency strength meter, and real-time equity curve. It scans 19 currency pairs simultaneously and ranks them by Profit Factor, showing you exactly which pairs have the strongest reversal edge right now. How It Works The indicator detects oversold/overbought reversal points using Bollinger Bands and RSI. When price clo
VP RSI Reversal Signal Arrows — Product Description Short Description VP RSI Reversal Signal Arrows is a clean MetaTrader 5 indicator that displays buy and sell reversal arrows when RSI exits oversold or overbought zones, with an optional moving average trend filter. Main Description VP RSI Reversal Signal Arrows is a visual technical analysis indicator for MetaTrader 5. It is designed for manual traders who want a simple RSI-based reversal assistant directly on the price chart. The indicator
「調整可能なフラクタル」はフラクタル インジケーターの高度なバージョンで、非常に便利なトレーディング ツールです。 - ご存知のとおり、標準フラクタル MT5  インジケーターには設定がまったくありません。これはトレーダーにとって非常に不便です。 - 調整可能なフラクタルは、この問題を解決しました。必要な設定がすべて揃っています。 - インジケーターの調整可能な期間 (推奨値 - 7 以上)。 - 価格の高値/安値からの距離を調整可能。 - フラクタル矢印のデザインを調整可能。 - インジケーターにはモバイルおよび PC アラートが組み込まれています。 高品質のトレーディングロボットとインジケーターをご覧になるにはここをクリックしてください! これは、この MQL5 Web サイトでのみ提供されるオリジナル製品です。
Introduction to Fractal Pattern Scanner Fractal Indicator refers to the technical indicator that makes use of the fractal geometry found in the financial market. Fractal Pattern Scanner is the advanced Fractal Indicator that brings the latest trading technology after the extensive research and development work in the fractal geometry in the financial market. The most important feature in Fractal Pattern Scanner is the ability to measure the turning point probability as well as the trend probabil
ALYAS Position Tool - NextGen ALYAS Position Tool - NextGen is a MetaTrader 5 analytical tool designed for position planning, risk analysis, market structure analysis, and trade scenario visualization . The tool provides an interactive position-planning interface directly on the chart, allowing traders to visualize and adjust Entry, Stop Loss, and Take Profit levels while monitoring the associated risk, reward, position size, and market context. It is designed as an analysis and planning tool an
FREE
Follow The Line MT5
Oliver Gideon Amofa Appiah
4.6 (35)
This indicator obeys the popular maxim that: "THE TREND IS YOUR FRIEND" It paints a GREEN line for BUY and also paints a RED line for SELL. (you can change the colors). It gives alarms and alerts of all kinds. IT DOES NOT REPAINT and can be used for all currency pairs and timeframes. Yes, as easy and simple as that. Even a newbie can use it to make great and reliable trades. NB: For best results, get my other premium indicators for more powerful and reliable signals. Get them here: https://www.m
FREE
概要 このインジケーターは、クラシックな ドンチャンチャネル を強化したバージョンで、実践的なトレード機能を追加しています。 標準の3本線(上限、下限、中央線)に加え、 ブレイクアウト を検出し、チャート上に矢印で視覚的に表示します。また、チャートを見やすくするために、 現在のトレンド方向と逆側のラインのみを表示 します。 インジケーターの機能: 視覚的シグナル :ブレイクアウト時にカラフルな矢印を表示 自動通知 :ポップアップ、プッシュ通知、Eメール RSIフィルター :市場の相対的な強弱に基づいてシグナルを検証 カスタマイズ可能 :色、ラインの太さ、矢印コード、RSI閾値など 動作原理 ドンチャンチャネルは次のように計算します: 上限線 :直近N本のクローズ済みローソク足の最高値 下限線 :直近N本のクローズ済みローソク足の最安値 中央線 :最高値と最安値の平均値 上方ブレイクアウト は終値が上限線を超えたときに発生し、 下方ブレイクアウト は終値が下限線を下回ったときに発生します。 インジケーターは以下を行います: 3本のドンチャンラインを描画 方向転換後の最初のブレイクアウト
FREE
MT4 indicator version https://www.mql5.com/en/market/product/72342 I personally use this indicator to scalp.  Accurate for accessing extremes and supports for buy positions primarily for 1 minute time frames.  Other time frames can be used but the levels are different. Its a better oscillator and compare with others to see the difference.          Day trade using neuro network concepts.  This indicator uses elementary forms of neuro networks to generate signals to buy and sell. Use the indicato
Improved version of the free HMA Trend indicator (for MetaTrader 4) with statistical analysis. HMA Trend is a trend indicator based on the Hull Moving Average (HMA) with two periods. HMA with a slow period identifies the trend, while HMA with a fast period determines the short-term movements and signals in the trend direction. The main differences from the free version: Ability to predict the probability of a trend reversal using analysis of history data. Plotting statistical charts for analyzi
VWAP indicator for MT5
Renaud Herve Francois Candel
Moving VWAP Indicator Moving VWAP is an important indicator drawing the Volume-Weighted Average Price (VWAP). The VWAP is a reference used by institutional traders and acts as a level of support / resistance. If price is above VWAP then means market is bullish. If price is below VWAP then means market is bearish. It can be used to enter in the market with low risk (near VWAP) and also identify the correct direction of the market. The Moving VWAP is as simple as a Simple Moving Average. The m
Introduction This indicator detects volume spread patterns for buy and sell opportunity. The patterns include demand and supply patterns. You might use each pattern for trading. However, these patterns are best used to detect the demand zone (=accumulation area) and supply zone (=distribution area). Demand pattern indicates generally potential buying opportunity. Supply pattern indicates generally potential selling opportunity. These are the underlying patterns rather than direct price action. T
MSX Hybrid Heiken Scalper Overview MSX Hybrid Heiken Scalper is a MetaTrader 5 indicator based on a modified Heiken Ashi methodology with closed-bar smoothing. The indicator is designed to display trend direction through color-coded candles while reducing sensitivity to short-term market fluctuations. All calculations are performed using completed candles, allowing historical values to remain fixed after bar close. Features • Modified Heiken Ashi calculation • Closed-bar processing • Color-code
FREE
The Saturated Trend indicator simplifies your decision making process by recognizing reversals with a built-in algorithm and then confirming signals at support/resistance levels. Implements a type of technical analysis based on the idea that the market is cyclical. Thus, the indicator follows the market trend with great reliability, ignoring sharp market fluctuations and noise around the average price. The indicator can be used both for pipsing on short periods and for long-term trading.
VFI Quantum
Nikita Berdnikov
5 (1)
Introducing VFI (Volume Flow Indicator) – a trading indicator that analyzes the relationship between volume and price movement to identify key trading opportunities. The indicator displays the strength and direction of volume flow, providing clear signals about potential entry and exit points. Signals are formed based on zero line crossovers, crossovers between the VFI line and its exponential moving average (EMA), and when the indicator exits overbought and oversold zones. Attention! This stra
FREE
SUPERTREND; It is a trend following indicator based on the SuperTrend ATR created by Olivier Seban. It can be used to detect changes in trend direction and locate stops. When the price falls below the indicator curve, it turns red and indicates a downtrend. Conversely, when the price moves above the curve, the indicator turns green, indicating an uptrend. Like other indicators, it works well on SuperTrend when used in conjunction with other indicators such as MACD, parabolik SAR, Bollinger Band
FREE
GDS Renko ATR - ATR-Based Renko Chart Indicator for MetaTrader 5 GDS Renko ATR is a free ATR-based Renko chart indicator for MetaTrader 5. It helps traders build and study Renko movement using a volatility-adaptive brick size based on Average True Range. The purpose of this tool is to provide a flexible Renko chart foundation for manual market analysis. It does not predict the market, does not generate buy or sell signals and does not decide whether a trade should be opened. Renko EDGE EA Golde
Pattern Builder Pro — MetaTrader 5 用カスタムスイングパターンスキャナー Pattern Builder Pro は、任意のカスタムスイングパターンを手描きで作成し、複数の時間足にわたって Market Watch 内のすべての銘柄から統計的に類似した値動きの形状をスキャンできる MetaTrader 5 用インジケーター兼マーケットスキャナーです。ヘッドアンドショルダー、トライアングル、フラッグなど固定形状に限定される従来のチャートパターンインジケーターとは異なり、この MT5 パターン認識ツールでは独自のプライスアクションパターンを自由に定義でき(スイングポイント数・形状ともに任意)、Dynamic Time Warping(DTW)や Procrustes 解析を含む 11 項目の重み付け類似度エンジンによりリアルタイムで一致する形状を検出します。 主な機能: XYグリッド上のインタラクティブなパターン描画ボード、ピクセル単位でのスイングポイント配置 多指標類似度エンジン:形状、角度シーケンス、傾き、リトレースメント、エクステンション、スイング比
GDS Renko Pip ST Chart - Pip-Based Renko Chart Indicator for MetaTrader 5 GDS Renko Pip ST Chart is a pip-based Renko chart indicator for MetaTrader 5. It helps traders build and study cleaner Renko price movement using a practical fixed pip or point-based brick structure. This tool is designed as a Renko chart foundation for manual analysis. It does not predict the market, does not generate buy or sell signals and does not decide whether a trade should be opened. Renko EDGE EA Golden Delta | A
Dynamic Trend Channel Ultimate for MT5 (M30) Professional Trend-Following & Smart Signal System Dynamic Trend Channel  is an advanced trend-following indicator designed specifically for the M30 timeframe on MetaTrader 5. It combines dynamic trend channels, adaptive volatility calculations, smart trend detection, trailing stop technology, and real-time signal generation to help traders identify high-probability market opportunities with greater confidence. Built around a dynamic EMA-based channel
Percentage Range Consolidation O Percentage Range Consolidation é um indicador poderoso projetado para identificar zonas de consolidação de preço com base em variações percentuais ao longo do tempo. Ideal para traders que buscam detectar áreas de compressão de volatilidade e possíveis pontos de ruptura (breakout). Principais características: Identifica até 3 zonas de consolidação simultâneas, cada uma configurável de forma independente. Cálculo baseado na variação percentual entre a máxima e mín
このプロダクトを購入した人は以下も購入しています
ARIPoint
Temirlan Kdyrkhan
1 (4)
ARIPoint is a powerful trading companion designed to generate high-probability entry signals with dynamic TP/SL/DP levels based on volatility. Built-in performance tracking shows win/loss stats, PP1/PP2 hits, and success rates all updated live. Key Features: Buy/Sell signals with adaptive volatility bands Real-time TP/SL/DP levels based on ATR Built-in MA Filter with optional ATR/StdDev volatility Performance stats panel (Success, Profit/Loss, PP1/PP2) Alerts via popup, sound, push, or email Cu
ARICoin is a powerful trading companion designed to generate high-probability entry signals with dynamic TP/SL/DP levels based on volatility. Built-in performance tracking shows win/loss stats, PP1/PP2 hits, and success rates all updated live. Key Features: Buy/Sell signals with adaptive volatility bands Real-time TP/SL/DP levels based on ATR Built-in MA Filter with optional ATR/StdDev volatility Performance stats panel (Success, Profit/Loss, PP1/PP2) Alerts via popup, sound, push, or email Cust
ORB Seeker MT5
Marcela Goncalves De Oliveira
数量限定で特別価格!希少性を維持するための特別価格です! たったの599ドル! ご購入後、ボーナスとしてORB Seeker EAと個人最適化セットファイルをお受け取りいただくため、私にご連絡ください。 クリーンなセッションブレイクアウトを自信を持ってキャッチしましょう! ORB Seeker MT5は、正確性、シンプルさ、柔軟性、そして明確なチャート構造を求めるトレーダー向けに開発された、プロ仕様のオープニングレンジブレイクアウト(ORB)インジケーターです。 このシステムは、あらゆる銘柄のプレマーケットまたはカスタムセッションのレンジを自動的にプロットし、エントリー、ストップロス、テイクプロフィット、およびオプションの50%部分TPレベルを含む明確なブレイクアウトシグナルを提供します。すべての計算結果はリアルタイムでチャート上に表示されます。 ロンドンオープン、ニューヨークセッション、アジアセッション、または独自のカスタム市場時間帯で取引できます。ORB Seeker MT5は選択したセッション時間帯に合わせて調整されるため、市場レンジ、ブレイクアウトレベル、トレードレベルの位
一言でいうと このインジケーターは RSI と MACD という2人の専門家を1つにまとめたもの です。2つのチャートを別々に見て判断する代わりに、両方が同意したときだけ「買い」または「売り」の矢印を表示します。 矢印は再描画されません 。一度出現すれば、そのまま固定されます。 「コンボ」の意味 通常、トレーダーは RSI(値動きの勢い)と MACD(トレンドの方向)を別々に見ます。しかし両者が矛盾することも多いです。 このインジケーターでは、 両方が同時に同意したときのみシグナル を出します。これにより、多くの偽シグナルが排除されます。 画面で見えるもの 価格チャートとは別のインジケーターウィンドウ 青と赤の矢印 —— そのまま使えるシグナル 拡大表示された MACD ヒストグラム(見やすく強調されている) RSI と MACD のラインも表示されるが、注目すべきは矢印 こんな人におすすめ 初心者 —— 2つのインジケーターを別々に解釈し、矛盾に対処する必要がない 経験者 —— シグナルの高速フィルタリングと、再描画しないクリアなロジック 迷いたくない人 —— 「買い」「売り」「待て
MERAVITH SCANNERは、MetaTrader 5用のプロフェッショナルな金融市場インジケーターで、複数の分析ツールを一つの統合システムにまとめています。独自の出来高加重平均価格(VWAP)手法を使用してすべての計算を自動で行い、主観的な解釈を完全に排除します。 このインジケーターは、すべての資産クラス(FX、株式、指数、商品、暗号通貨)およびM1から月足までのすべての時間軸で動作します。基本原理は「価格は出来高に従う」というものです。MERAVITHは機関投資家の出来高が集中するポイントを特定し、その集中から数学的に正確な価格レベルを導き出します。予測や投機は行わず、計算のみを行います。 MERAVITH SCANNERを使用すると、28の主要FX通貨ペアをすべての時間軸でわずか2~3分でスキャンできます。また、任意の市場をスキャンすることも可能です。例えば、約100銘柄の株式を約10分でスキャンできます。 インジケーターは、消耗レベル、均衡線、偏差、統計レベル、およびターゲット予測を算出します。 チャート要素 Origin Point :すべての計算が始まる起点です。イン
note: this indicator is for METATRADER4, if you want the version for METATRADER5 this is the link:  https://www.mql5.com/it/market/product/108106 TRENDMAESTRO ver 2.5 TRENDMAESTRO recognizes a new TREND from the start, he never makes mistakes. The certainty of identifying a new TREND is priceless. DESCRIPTION TRENDMAESTRO identifies a new TREND in the bud, this indicator examines the volatility, volumes and momentum to identify the moment in which there is an explosion of one or more of these da

相場が本当は何をしているのかを見抜く。   3つの市場フェーズ(収縮・拡張・トレンド)を目の前でライブに捉え、トレンド・フェーズの初期段階でより優れたエントリーを取りましょう   。      当て推量はもう終わり。機関投資家やスマートマネーのように相場を読み始めましょう。   Apex Market Structure Pro(MT5版)は、ノイズを取り除き、あらゆるローソク足の下にある真の構造を見せる高精度のスマートマネー分析ツ   ールです。流動性、構造転換、蓄積ゾーン、トレンドバイアスを、ひとつのクリーンでプロフェッショナルなオーバーレイに集約します。遅行   指標に見切りをつけ、明晰さをもってトレードする準備のできた本気のトレーダーのために作られました。   重要:本インジケーターは Heikin Ashi(平均足)ローソク足での動作を前提に設計されています。使用前にチャートを Heikin Ashi   に設定し、その真価を解き放ってください。分析のすべては Heikin Ashi の価格の流れを軸に構築されています。Apex Market Structure Pr
Title:FX-AIEA Supply and Demand Zone Indicator (MT5) — Technical Overview Version: 2.51 | Platform: MetaTrader 5 Introduction Supply and demand zones are considered a core manifestation of institutional order flow, providing a more direct reflection of buying and selling pressure than traditional support/resistance levels. This indicator attempts to automate the identification of high-probability supply and demand zones using an adaptive ZigZag algorithm, reducing the subjectivity and time asso
SMC Sweep Fvg MT5 — スマートマネーと同じ目線で、チャート上に市場を映す こんな経験はありませんか。価格がストップを巻き取り、反転し、まさに想定どおりの方向へ進む。方向は正しかった。間違えたのはエントリーだけです。 このインジケーターは、そうした場面を減らすために作られています。分析で最も重い部分——チャートのマークアップ——を引き受け、本当に重要な「判断」をあなたに残します。 チャートに表示されるもの マーケットストラクチャー — 実際の構造的高値・安値に HH / HL / LH / LL ラベルとレベルライン。トレンドが一目で分かり、推測は不要です。 インバランスゾーン(FVG) — 価格が急ぎ過ぎて通過し、後で戻りやすい領域。未埋めと既埋めのゾーンは別色で表示されます。 流動性の動き — 反転前に市場がレベルを巻き取る瞬間を追跡します。 トレード設計の完成形 — エントリー矢印、ストップロス、利益目標。すべて描画済みで、頭の中で計算する必要はありません。 トレンドフィルター — 上位足のラインで、主戦場の動きの側に立ち続けられます。 インジケーターは
MasterTrend Indicator for MT5 A powerful trend-following and signal-evaluation tool MasterTrend   is a custom MT5 indicator that combines Moving Averages and ATR-based risk/reward logic to generate clear buy/sell signals. It visualizes dynamic SL/TP levels, evaluates past trade outcomes, and displays win/loss statistics in a clean on-chart panel. Key features include: Buy/Sell signals based on MA crossovers ATR-based SL/TP1/TP2/TP3 levels with visual lines and labels Signal outcome tracking wit
AriX
Temirlan Kdyrkhan
1 (4)
AriX Indicator for MT5 A powerful trend-following and signal-evaluation tool AriX is a custom MT5 indicator that combines Moving Averages and ATR-based risk/reward logic to generate clear buy/sell signals. It visualizes dynamic SL/TP levels, evaluates past trade outcomes, and displays win/loss statistics in a clean on-chart panel. Key features include: Buy/Sell signals based on MA crossovers ATR-based SL/TP1/TP2/TP3 levels with visual lines and labels Signal outcome tracking with real-time stat
VTrende Pro
Andrii Diachenko
5 (1)
VTrende Pro - MTF indicator for trend trading with a display panel for MT5 *** Videos can be translated into any language using subtitles (video language - Russian) Although the signals of the VTrende Pro indicator can be used as signals of a full-fledged trading system, it is recommended to use them in conjunction with the Bill Williams TS. VTrende Pro is an extended version of the VTrende indicator. Difference between Pro version and VTrende: - Time zones - Signal V - signal 1-2 waves -    S
ScalpPoint is a powerful trading companion designed to generate high-probability entry signals with dynamic TP/SL/DP levels based on volatility. Built-in performance tracking shows win/loss stats, PP1/PP2 hits, and success rates — all updated live. Key Features: Buy/Sell signals with adaptive volatility bands Real-time TP/SL/DP levels based on ATR Built-in MA Filter with optional ATR/StdDev volatility Performance stats panel (Success, Profit/Loss, PP1/PP2) Alerts via popup, sound, push, or emai
PrimeScalping is a powerful trading companion designed to generate high-probability entry signals with dynamic TP/SL/DP levels based on volatility. Built-in performance tracking shows win/loss stats, PP1/PP2 hits, and success rates — all updated live. Key Features: Buy/Sell signals with adaptive volatility bands Real-time TP/SL/DP levels based on ATR Built-in MA Filter with optional ATR/StdDev volatility Performance stats panel (Success, Profit/Loss, PP1/PP2) Alerts via popup, sound, push, or e
The Expert Advisor and the video are attached in the Discussion tab . The robot applies only one order and strictly follows the signals to evaluate the indicator efficiency. Pan PrizMA CD Phase is an option based on the Pan PrizMA indicator. Details (in Russian). Averaging by a quadric-quartic polynomial increases the smoothness of lines, adds momentum and rhythm. Extrapolation by the sinusoid function near a constant allows adjusting the delay or lead of signals. The value of the phase - wave s
Классификатор силы тренда. Показания на истории не меняет. Изменяется классификация только незакрытого бара. По идее подобен полной системе ASCTrend, сигнальный модуль которой, точнее его аппроксимация в несколько "урезанном" виде, есть в свободном доступе, а также в терминале как сигнальный индикатор SilverTrend . Точной копией системы ASCTrend не является. Работает на всех инструментах и всех временных диапазонах. Индикатор использует несколько некоррелируемых между собой алгоритмов для класси
FFx Universal Strength Meter PRO is more than a basic strength meter. Instead of limiting the calculation to price, it can be based on any of the 19 integrated strength modes + 9 timeframes. With the FFx USM, you are able to define any period for any combination of timeframes. For example, you can set the dashboard for the last 10 candles for M15-H1-H4… Full flexibility! Very easy to interpret... It gives a great idea about which currency is weak and which is strong, so you can find the best pai
The FFx Universal MTF alerter shows on a single chart all the timeframes (M1 to Monthly) with their own status for the chosen indicator. 9 indicators mode (MACD-RSI-Stochastic-MA-ADX-Ichimoku-Candles-CCI-PSAR). Each can be applied multiple times on the same chart with different settings. Very easy to interpret. Confirm your BUY entries when most of the timeframes are showing green color. And confirm your SELL entries when most of the timeframes are showing red color. 2 Alert Options : input to s
The FFx Watcher PRO is a dashboard displaying on a single chart the current direction of up to 15 standard indicators and up to 21 timeframes. It has 2 different modes: Watcher mode: Multi Indicators User is able to select up to 15 indicators to be displayed User is able to select up to 21 timeframes to be displayed Watcher mode: Multi Pairs User is able to select any number of pairs/symbols User is able to select up to 21 timeframes to be displayed This mode uses one of the standard indicators
FFx Patterns Alerter gives trade suggestions with Entry, Target 1, Target 2 and StopLoss .... for any of the selected patterns (PinBar, Engulfing, InsideBar, OutsideBar) Below are the different options available: Multiple instances can be applied on the same chart to monitor different patterns Entry suggestion - pips to be added over the break for the entry 3 different options to calculate the SL - by pips, by ATR multiplier or at the pattern High/Low 3 different options to calculate the 2 TPs -
MetaTrader 4 version available here : https://www.mql5.com/en/market/product/24881 FFx Basket Scanner is a global tool scanning all pairs and all timeframes over up to five indicators among the 16 available. You will clearly see which currencies to avoid trading and which ones to focus on. Once a currency goes into an extreme zone (e.g. 20/80%), you can trade the whole basket with great confidence. Another way to use it is to look at two currencies (weak vs strong) to find the best single pairs
MetaTrader 4 version available here: https://www.mql5.com/en/market/product/25793 FFx Pivot SR Suite PRO is a complete suite for support and resistance levels. Support and Resistance are the most used levels in all kinds of trading. Can be used to find reversal trend, to set targets and stop, etc. The indicator is fully flexible directly from the chart 4 periods to choose for the calculation: 4Hours, Daily, Weekly and Monthly 4 formulas to choose for the calculation: Classic, Camarilla, Fibonac
ClassicSBA
Umri Azkia Zulkarnaen
this indicator very simple and easy if you understand and agree with setup and rule basic teknical sba you can cek in link : please cek my youtube channel for detail chanel : an for detail info  contact me  basicly setup buy (long) for this indicator is Magenta- blue and green candle or magenta - green  and green candlestik and for setup sell (short) is Black - yellow - and red candle or black - red  and red candlestik
A scalping indicator based on mathematical patterns, which on average gives signals with relatively small SL, and also occasionally helps to catch big moves in the markets (more information in the video) This indicator has three main types of notifications: The first type warns of a possible/upcoming signal on the next bar The second type indicates the presence of a ready signal to enter the market/open a position The third type is for SL and TP levels - you will be notified every time price re
Индикатор Coefficient Of Determination (COD) представляет собой значение коэффициента детерминации или квадрат коэффициента корреляции между зависимой переменной — ценой и объясняющей переменной — тиковым объемом. Что это дает нам на практике? COD отлично распознает кульминацию трендовых движений, что позволяет подбирать оптимальные точки и ловить развороты рынка. Как использовать индикатор: Наиболее популярная торговая стратегия строится совместно с трендовым индикатором Moving Average (MA), пе
Recommended TimeFrame >= H1. 100% Non Repainted at any moment.  Use it carefully, only with Trend Direction. Trading Usage: 2 Variants: as Range System or as BreakOut System (Both Only With Trend Direction)::: (Always use StopLoss for minimise Risk); [1] as Range System: (Recommended) in UP TREND:  - BUY in Blue Line , then if price goes down by 50 points (on H1) open Second BUY.   Close in any Profit you wish: TrailingStop(45 points) or Close when Price touches upper Gold Line. in DOWN TREND
this indicator is a Spike detector indicator, it is specially designed to trade Boom 1000, Boom 500, Crash 1000 and Crash 500 We recommend using it on Deriv Boom and Crash indices only Its setting is intuitive, familiar, easy to use it has notification functions; audible notifications and push notifications. this tool is simple to use, easy to handle This update is based on different strategies for spikes
Limitless MT5 is a universal indicator suitable for every beginner and experienced trader. works on all currency pairs, cryptocurrencies, raw stocks Limitless MT5 - already configured and does not require additional configuration And now the main thing Why Limitless MT5? 1 complete lack of redrawing 2 two years of testing by the best specialists in trading 3 the accuracy of correct signals exceeds 80% 4 performed well in trading during news releases Trading rules 1 buy signal - the ap
QuantXSTocks Trading Range Indicator for MT5: INSTRUCTIONS TO USE OUR INDICATOR:- User needs to take trade on Arrow or after an Arrow CandleStick, You can achieve up-to 35-125 pips target by this Indicator. Best Timeframes for Stocks and Indices are M30 and H1: AMAZON M30 (50 pips) TESLA M30 (50 pips) APPLE M30 (50 pips) ADOBE M30 (50 pips) NASDAQ100 H1 (125 pips) The above are the approximate amount of pips you can achieve by this Indicator, Green arrow appears to be buy arrow while the Red ar
Trend and Signals MT5  indicator scans  30 trading Instruments (Forex, Metals and Indices).     It uses special algorithm on the  current market   based on   Pure Price Action   and display the overall trend and signal on the dashboard. When signals are produced the indicator sends alert and notification. Strategy for Signals This indicator uses the daily timeframe to determine the direction of the trend. The hourly timeframe is used to identify possible entries. Main trend and is determined by
作者のその他のプロダクト
EventCalendar Lite - 次の経済指標までのカウントダウン(無料) 何をするか 経済指標の発表予定をチャート上に印し、いま見ている銘柄を動かしうる次の1件まで カウントダウンします。それだけです。取引はせず、売買シグナルも描かず、 何も予測しません。 内蔵しているもの 2084件の発表予定を内蔵しています(2019-01-03〜2028-12-07)。各件に通貨タグが付いています。 FOMC, NFP, US_CPI, US_RETAIL_SALES, USD_JOBLESS, EIA_CRUDE, AUCTION_LONG, ECB, BOE, GB_CPI, BOJ, RBA, RBNZ, BOC, CH_CPI。 外部ファイルもインターネット接続も不要で、誰かから何かを受け取る必要もありません。 発表はチャート銘柄の構成通貨で対応づけられます。EURUSD ならユーロと米ドル、 XAUUSD なら米ドルの発表が表示されます。MatchSymbol を切れば全件、EventFilter に タグを列挙すれば絞り込めます。 パネル 隅のパネルに直近数件の予定
FREE
StructureScope - The chart's structure, drawn only once it is confirmed. WHAT IT DRAWS   Market structure   Break of Structure and Change of Character, labelled                      at the level that was broken.   Order blocks       The last opposing candle before the leg that broke                      structure. Shaded while unmitigated, closed off once                      price has traded back through it.   Fair value gaps    Three-bar imbalances that have not been filled.                
EventBurst - FOMC直後の1時間の方向へ順張りする 何をするEAか 発表前には何も置きません。FOMCの政策決定が出た「その1時間」の値動きを測り、 十分大きければ次の1時間足の始値で、市場が動いた方向へエントリーします。 損切りは固定、利確は2.5R、遅くとも4時間で決済します。 なぜ「次の足」なのか 発表の瞬間に約定させるのは実際には届きません。スプレッドが開き、価格は既に 飛んでいます。そこで発表バーの確定を待ち、次のバーの始値で入ります。 下の数字はすべてこの条件で出しているので、購入者が再現できます。 発表日程 FOMCの日程をEAに内蔵しています(57件・2028年まで)。外部ファイルもインター ネット接続も不要で、販売者から何かを受け取り続ける必要もありません。各回の実際の 予定時刻を読むので、夏冬で18:00と19:00 UTCが入れ替わっても影響を受けません。 正直な適用範囲(必ずお読みください)   ・これはゴールドの戦略です。同じルールをEURUSDに当てると下記テストでは     プロフィットファクター 0.81 で負けま
EventStraddle - 経済指標発表をはさむ両側逆指値とATRトレール 何をするEAか 経済指標の発表直前に、現在値の上下へ逆指値注文を同時に置きます。市場が抜けた側だけ を残して反対側は取り消し、勝った側をATR基準のトレールで伸ばします。それ以外の時間は 待機します。 動作 1. 発表の ArmLeadSec 秒前(既定15分)にATR(H1,14)を読み、上下 ±1.0 ATR に逆指値を置く 2. 各注文の損切りは、その注文の約定価格から 2.0 ATR 3. 片側が約定したら反対側を取り消す(OCO) 4. 含み益が 1.0 ATR に達したら、価格の 0.5 ATR 後ろをストップが追う 5. 遅くとも MaxHoldHours(既定24時間)で決済 6. 約定しなかった注文は発表の CancelAfterSec 秒後に取り消す 発表日程 日程はEAに内蔵しており、外部ファイルもインターネット接続も不要です。販売者から データの提供を受け続ける必要はありません。収録しているのは、FRB・ECB・イングランド 銀行・日本銀行・豪州準備銀行・ニュージ
News Risk Guard は、経済指標の発表が近づいたときに、すでに持っている建玉を 守るためのリスク管理ツールです。方向を予測しません。自分から仕掛けません。 利益の主張も一切しません。 日程は商品に内蔵しています (15指標・4,101件)。インターネット許可も DLL も 外部ファイルも不要で、ストラテジーテスターでも実チャートでも同じに動きます。 できること 1. 保護窓    発表の指定秒前に、管理対象の建玉を引き取り、発表後に返します。動作は選べます    — 警告のみ / 建値へ移動 / ストップを詰める / 数量を割合で減らす / 決済。    本ツールが動かしたストップは、窓が閉じるときに元の位置へ戻します。 2. ストップの無い建玉    発表を無防備で迎える建玉は、口座が抱える最大の単一リスクです。ATR から算出した    緊急ストップを自動で付けます。戦略ではなくシートベルトです。 3. ロットの自動計算    数量ではなくリスクを入力します。ロットは「失ってよい金額」と「ストップまでの    距離」から、ブローカーが実際に返す tick v
フィルタ:
レビューなし
レビューに返信