Zone Crack Alpha

ZONE CRACK ALPHA — STRATEGIC DETECTION OF MARKET PHASE SHIFTS

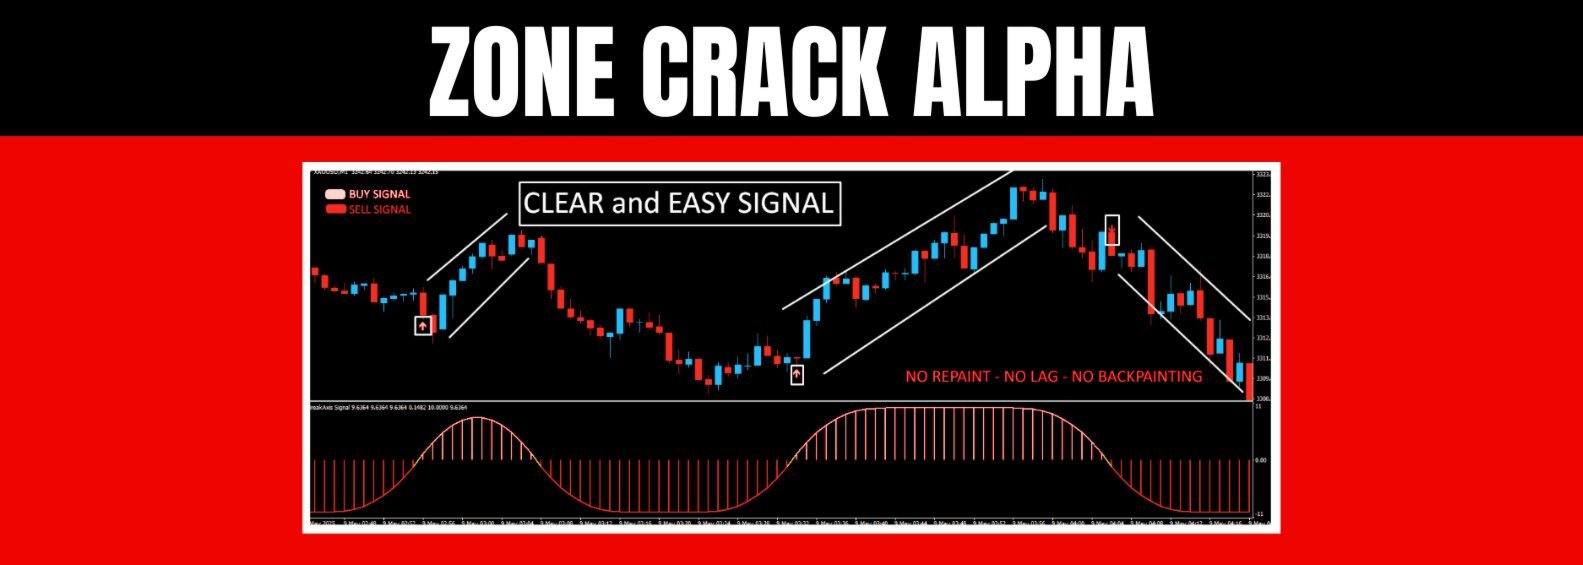
Zone Crack Alpha has been engineered to identify structural transitions in price behavior through a dual-stage logic system. It leverages histogram polarity changes and directional overlays to pinpoint moments of potential breakout initiation, without relying on lagging constructs or legacy signals.


Stay Updated
Join the official channel to stay informed about future releases and updates: https://www.mql5.com/en/channels/signalsandindicators


Signal Logic
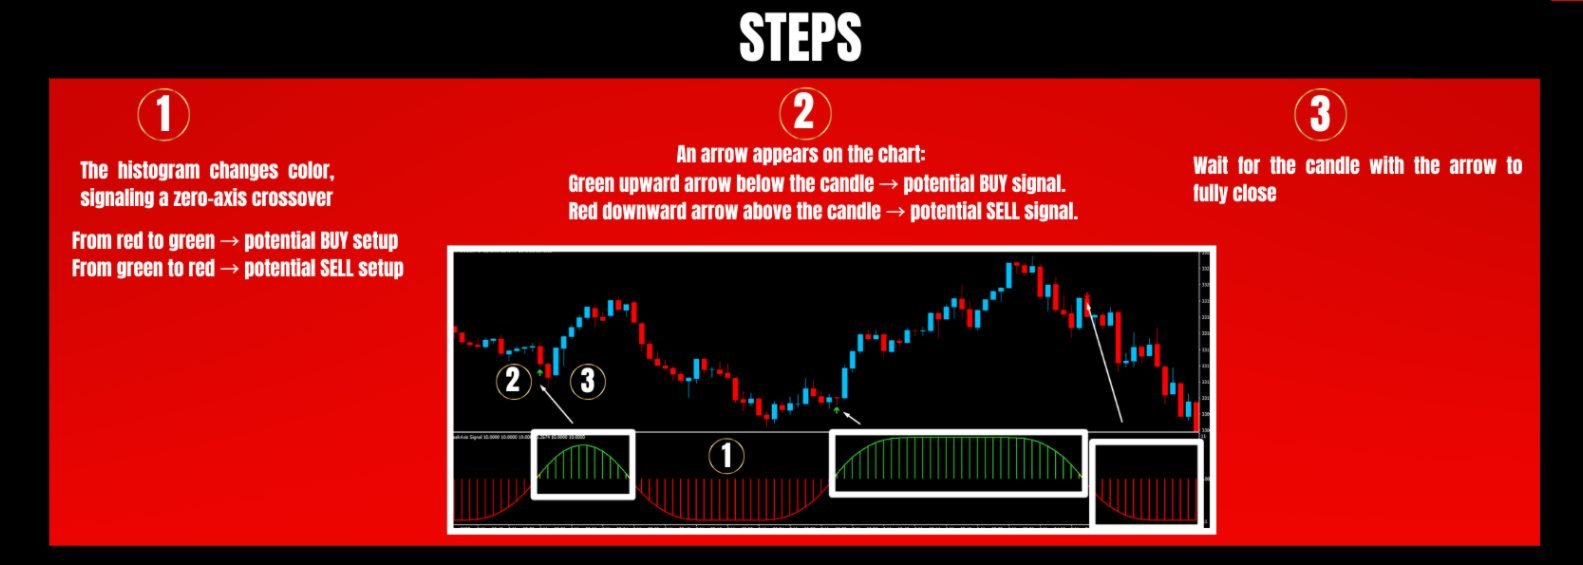
The methodology integrates a zero-axis histogram crossover as the foundational layer. When the directional transition is confirmed—either from bullish contraction to expansion or from upward to downward pressure—a visual cue is projected onto the chart in the form of directional markers. These triggers are validated on candle close, preserving the integrity of each entry without repaint or forward bias.

Signal Generation Process
Each trade setup originates from a smoothed assessment of recent market dynamics, designed to extract high-confidence shifts in momentum. This internal signal architecture reduces false positives by filtering out short-term noise and reacts to actual structural changes, rather than superficial volatility spikes or external confirmation indicators.

Execution Transparency
Every arrow printed on the chart represents a completed validation cycle. The system waits for both histogram confirmation and close-of-candle alignment before signaling a directional bias. Alerts can be fully customized or deactivated, depending on the trader's operational style—ideal for both discretionary and system-driven approaches.

Adaptability and Input Control
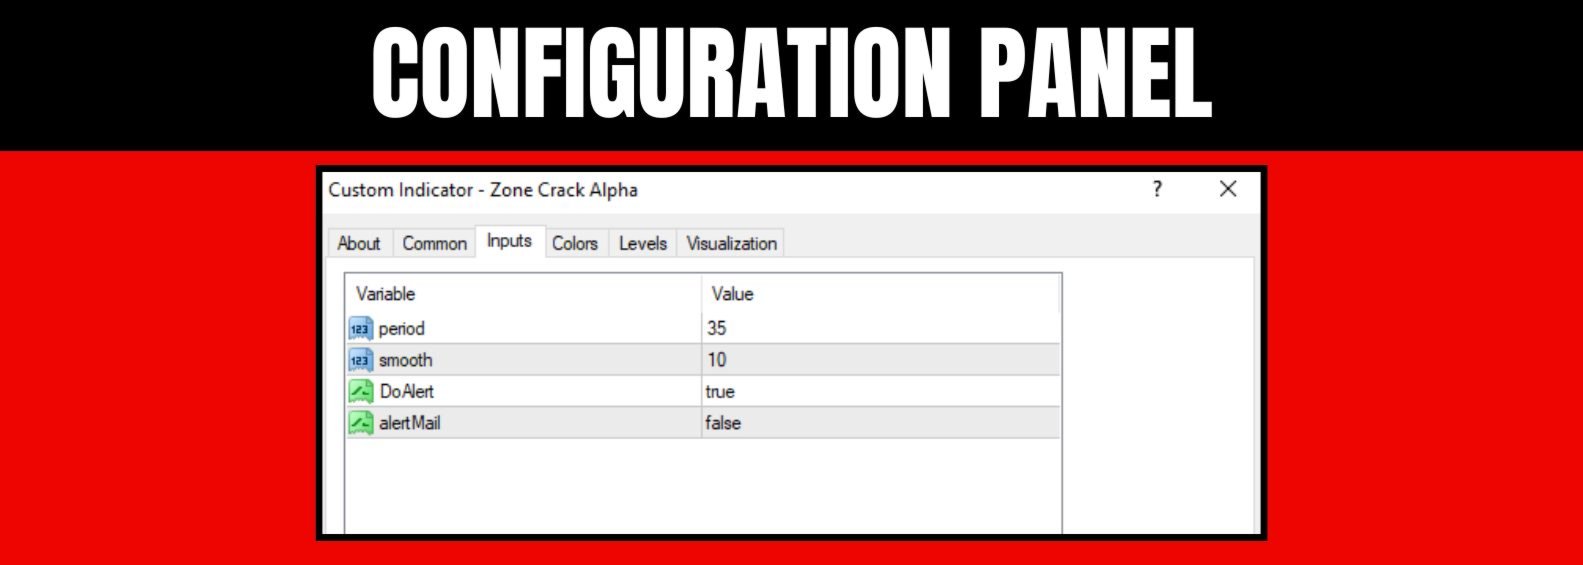
Zone Crack Alpha performs consistently across major pairs, commodities, indices, and synthetic assets. While universally compatible, its precision is most effective in phases of breakout development or momentum shift. Through the period and smoothing parameters, traders can calibrate how reactive or conservative the system should be, according to their strategy profile.

Designed for Price-Action Traders
This tool is not built on standard indicators or arbitrary conditions. It responds to internal price action dynamics and structural context, providing a refined stream of signals that align with momentum breakouts and potential directional reversals. Traders seeking tactical clarity without overfitting will find its logic robust and adaptable.

FAQ

Does Zone Crack Alpha repaint?
No. Signals are calculated on confirmed price action and are not recalculated after candle close.

Is backpainting used to enhance historical appearance?
No. The indicator draws arrows only when real-time conditions are fulfilled. Historical candles are not modified.

Can the alert system be disabled?
Yes. Visual, sound, email, and push notifications are all configurable through input parameters.

What markets and timeframes are supported?
Zone Crack Alpha is compatible with all symbols and timeframes. Performance may vary depending on volatility, market session, and asset behavior.


Recommended products
The indicator builds current quotes, which can be compared with historical ones and on this basis make a price movement forecast. The indicator has a text field for quick navigation to the desired date. Options: Symbol - selection of the symbol that the indicator will display; SymbolPeriod - selection of the period from which the indicator will take data; IndicatorColor - indicator color; Inverse - true reverses quotes, false - original view; Next are the settings of the text field, in w
BoxChart MT4
Evgeny Shevtsov
4.4 (5)
The market is unfair if only because 10% of participants manage 90% of funds. An ordinary trader has slim changes to stand against these "vultures". This problem can be solved. You just need to be among these 10%, learn to predict their intentions and move with them. Volume is the only preemptive factor that faultlessly works on any timeframe and symbol. First, the volume appears and is accumulated, and only then the price moves. The price moves from one volume to another. Areas of volume accumu
Antabod Gamechanger
Rev Anthony Olusegun Aboderin
*Antabod GameChanger Indicator – Transform Your Trading!*   Are you tired of chasing trends too late or second-guessing your trades? The *Antabod GameChanger Indicator* is here to *revolutionize your trading strategy* and give you the edge you need in the markets!   Why Choose GameChanger? *Accurate Trend Detection* – GameChanger identifies trend reversals with *pinpoint accuracy*, ensuring you enter and exit trades at the optimal time.   *Clear Buy & Sell Signals* – No more guesswork! T
Stratos Pali
Michela Russo
5 (3)
Stratos Pali Indicator   is a revolutionary tool designed to enhance your trading strategy by accurately identifying market trends. This sophisticated indicator uses a unique algorithm to generate a complete histogram, which records when the trend is Long or Short. When a trend reversal occurs, an arrow appears, indicating the new direction of the trend. Important Information Revealed Leave a review and contact me via mql5 message to receive My Top 5 set files for Stratos Pali at no cost! Dow
El indicador "MR BEAST ALERTAS DE LIQUIDEZ" es una herramienta avanzada diseñada para proporcionar señales y alertas sobre la liquidez del mercado basándose en una serie de indicadores técnicos y análisis de tendencias. Ideal para traders que buscan oportunidades de trading en función de la dinámica de precios y los niveles de volatilidad, este indicador ofrece una visualización clara y detallada en la ventana del gráfico de MetaTrader. Características Principales: Canal ATR Adaptativo: Calcula
The Chaikin Oscillator is a technical indicator developed by Marc Chaikin that combines price and volume data to measure the accumulation and distribution of a financial instrument. It aims to identify potential buying and selling opportunities in the market. The Chaikin Oscillator is calculated by subtracting a 10-day exponential moving average of the Accumulation Distribution Line (ADL) from a 3-day exponential moving average of the ADL. Here's how to use the Chaikin Oscillator indicator in tr
Fibonacci retracements can be used to draw support lines, identify resistance levels, place stop-loss orders and set target prices. The Advanced Automatic Fibonacci retracements draws automatically all the levels. You have a lot of options to choose. For exemple you can use the tracements of another time frame (MTF) in the current chart, you can also choose between the closest level or less close to draw the retracements. You can also add 2 levels of your choice. You can add levels extensions o
MarketProfile EForex
Veridiana Adorno Kendrick
Market Profile Shows where the price has spent more time, highlighting important levels that can be used in trading. It is a powerful tool which is designed to take the fundamental components which comprise every market; price/volume/time, and visually display their relationship in real-time as the market develops for a pre-determined time period. Very powerful tool!
Reversal Pattern AI
Stanislav Konin
5 (1)
Reversal Pattern AI is a groundbreaking advancement in indicator development, combining artificial intelligence algorithms, multi-level market analysis, and classical technical analysis methods. It not only detects reversal patterns but also evaluates market inefficiencies, generating highly accurate trading signals.Thanks to its hybrid model, which utilizes price action analysis, volume, volatility, VWAP, and Volume AVG %, the indicator easily adapts to any market conditions. Reversal Pattern A
The indicator allows you to trade binary options. The recommended time frame is М1 and the expiration time is 1,2,3 minutes. The indicator suitable for auto and manual trading. A possible signal is specified as a arrows above/under a candle. You should wait until the candle closes! Arrows are not re-painted Trade sessions: TOKYO section (Half-end) Currency pairs: USD/JPY Working time frame: M1 Expiration time: 1,2,3 minutes. The indicator also shows good results when using the martingale strateg
FREE
VR Grid
Vladimir Pastushak
5 (3)
The VR Grid indicator is designed to create a graphical grid with user-defined settings. Unlike the standard grid , VR Grid is used to build circular levels . Depending on the user's choice, the step between the round levels can be arbitrary. In addition, unlike other indicators and utilities, VR Grid maintains the position of the grid even when the time period changes or the terminal is rebooted. You can find settings, set files, demo versions, instructions, problem solving, at [blog] You can
FREE
Blahtech Market Profile
Blahtech Limited
4.53 (15)
Was: $249  Now: $149   Market Profile defines a number of day types that can help the trader to determine market behaviour. A key feature is the Value Area, representing the range of price action where 70% of trading took place. Understanding the Value Area can give traders valuable insight into market direction and establish the higher odds trade. It is an excellent addition to any system you may be using. Blahtech Limited presents their Market Profile indicator for the MetaTrader community. In
UR Gamma
Krzysztof Jan Debski
UR Gamma (powered by similar calculations found in Machine Learning systems) UR Gamma is a cutting-edge financial analysis tool that offers a new and improved take on the classic WaveTrend indicator. By incorporating advanced Digital Signal Processing techniques, UR Gamma addresses some of the limitations of traditional WaveTrend algorithms and provides a more accurate, robust and dynamic approach to identifying and measuring trends in price action. Advantages of using UR Gamma: Minimalistic
VolumeProfile
Robert Hess
3.8 (5)
Descption: The Volume Profile displays detailed informations of historical trading activities at certain price levels (Market Profile). So you can locate the areas with the best prices in the market and get an advantage about other market participants. Features: Customizable Volume Profile / Market Profile Shows the "fair" Value Area with 70% of all Volume Shows critical low volume zones Shows VPOC, VAL and VAH Points Works on all timeframes Also available for MT5 ( https://www.mql5.com/en/mark
Blahtech Supply Demand
Blahtech Limited
4.58 (36)
Was: $299  Now: $149   Supply Demand uses previous price action to identify potential imbalances between buyers and sellers. The key is to identify the better odds zones, not just the untouched ones. Blahtech Supply Demand indicator delivers functionality previously unavailable on any trading platform. This 4-in-1 indicator not only highlights the higher probability zones using a multi-criteria strength engine, but also combines it with multi-timeframe trend analysis, previously confirmed swings
The Market Profile Indicator for MT4 displays the price levels and zones where increased trading activity happens. These zones with substantial forex trading activity provide the forex traders with the best entry levels, support, and resistance levels. Moreover, price levels indicate the best reversal zones. As a result, forex traders can identify BULLISH and BEARISH market trends and BUY and SELL entry points as well as the best reversal points. The indicator works well in all intraday timefram
The SMC Venom Model BPR indicator is a professional tool for traders working within the Smart Money (SMC) concept. It automatically identifies two key patterns on the price chart: FVG (Fair Value Gap) is a combination of three candles, in which there is a gap between the first and third candles. It forms a zone between levels where there is no volume support, which often leads to a price correction. BPR (Balanced Price Range) is a combination of two FVG patterns that form a “bridge” - a zone of
SQ Swing Fibo Marker
Bartlomiej Gorski
5 (1)
Swing Fibo Marker is adaptive advanced indicator that automatically detects price swings. After swing detection, it draws five profit targets, entry level and stop loss level. Levels are calculated base on price swing size, according to Fibonacci levels specified as entry points. When price touch the level indicator create alerts. List of supported alert types: Popup alerts Email alerts Push notification On screen output Suggested timeframe to trade: H1 or higher. The higher timeframe is used to
Price Grid Navigator Indicator The   Price Grid Navigator   is a powerful and intuitive trading tool designed to help traders identify key   support and resistance levels   dynamically. It provides clear visual cues for potential   entry points ,   exit points , and   reversal zones , making it an essential tool for traders of all experience levels. By dynamically calculating and plotting these levels, the indicator provides traders with a clear visual representation of potential  entry points ,
FREE
Master Scalping M1 is an innovative indicator that uses an algorithm to quickly and accurately determine the trend.The indicator calculates the time of opening and closing positions, the indicator's algorithms allow you to find the ideal moments to enter a deal (buy or sell an asset), which increase the success of transactions for most traders. Benefits of the indicator: Easy to assemble, does not overload the chart with unnecessary information. Can be used as a filter for any strategy. Works on
PipFinite Exit EDGE
Karlo Wilson Vendiola
4.83 (115)
Did You Have A Profitable Trade But Suddenly Reversed? In a solid strategy, exiting a trade is equally important as entering. Exit EDGE helps maximize your current trade profit and avoid turning winning trades to losers. Never Miss An Exit Signal Again Monitor all pairs and timeframes in just 1 chart www.mql5.com/en/blogs/post/726558 How To Trade You can close your open trades as soon as you receive a signal Close your Buy orders if you receive an Exit Buy Signal. Close your Sell orders if
QuantumEdge Trader
Hossam Ali Ahmed Ali
QuantumEdge Trader v1.0 AI-Powered Precision Signals for Serious Traders QuantumEdge Trader is a smart and reliable indicator that delivers accurate BUY and SELL signals using advanced market analysis and trend detection. Designed for M1 to M60 timeframes, it's ideal for scalping and intraday strategies. --- Key Features: No Repaint – Signals never change after appearing Smart trend filters to reduce noise Adjustable sensitivity and alerts Perfect for XAUUSD, EURUSD, and m
Daily Candle Predictor is an indicator that predicts the closing price of a candle. The indicator is primarily intended for use on D1 charts. This indicator is suitable for both traditional forex trading and binary options trading. The indicator can be used as a standalone trading system, or it can act as an addition to your existing trading system. This indicator analyzes the current candle, calculating certain strength factors inside the body of the candle itself, as well as the parameters of
Supply Demand Zone Lines Indicator Background The system automatically searches for supply and demand zones in the Chart and draws real-time key price lines. Traders can trade according to the price trading lines. Main Features The system automatically searches for supply and demand zones. The system also draws real-time key price lines. Traders can trade according to the price trading lines. Therefore, traders who use the supply and demand zone strategy no longer need to spend time looking for
AW Candle Patterns MT4
AW Trading Software Limited
The AW Candle Patterns indicator is a combination of an advanced trend indicator combined with a powerful candle pattern scanner. It is a useful tool for recognizing and highlighting the thirty most reliable candlestick patterns. In addition, it is a current trend analyzer based on colored bars with a   plug-in multi-timeframe trend panel that can be resized and positioned. A unique ability to adjust the display of patterns depending on the trend filtering. Advantages: Easily identifies candle p
Koala Fibo Base Time
Ashkan Hazegh Nikrou
3 (1)
Welcome to Koala Fibo Base Time Welcome to Koala Fibo Time Zone Welcome to Koala Fibo Time Extention Welcome to Missed Tool For Meta Trade! Simple Introduction : Fibonacci Time Zones are vertical lines based on the Fibonacci Sequence. These lines extend along the X axis (date axis) as a mechanism to forecast reversals based on elapsed time. A major low or high is often chosen as the starting point. Distances start relatively small and grow as the Fibonacci Sequence extends. Chartists can extend
FREE
Overview Harmonic Patterns MT4 is a technical analysis indicator designed for the MetaTrader 5 platform. It identifies and displays harmonic price patterns, such as Butterfly, Cypher, Crab, Bat, Shark, and Gartley, in both bullish and bearish directions. The indicator calculates key price levels, including entry, stop loss, and three take-profit levels, to assist traders in analyzing market movements. Visual elements and customizable alerts enhance usability on the chart. Features Detects six ha
Volume Mag
Wiktor Keller
Volume mag indicator is another indicator that is used to calculate entry points tick volume. The indicator rarely gives a signal, but this can be said to be its advantage. The indicator's signals are not redrawn and do not lag, but are issued after the close of the current candle. The indicator does not overload the terminal and calculates entry points within the BarsCount value, which is set in the menu, by default 500 bar.
The trading statistics indicator notifies the trader of the aggregate income of the trading account for different time intervals. The indicator has wide display settings on the graph. There is a choice of one of the two display languages on the chart- English and Russian. Settings Indicator language (ENG, RUS) - Select the language to display on the chart; To control the magic (-1: any magic) - Entering the Magic for control (-1: any Magic); Angle of indicator tie - Selecting the angle of the c
Volume Compair
Thiago Pereira Pinho
Professional Cumulative Delta & Volume Median Indicator Track   real buying/selling pressure   with this powerful volume analysis tool. The   Volume Compare Indicator   combines   Cumulative Delta   and   Volume Medians   to help you identify institutional activity, imbalances, and potential reversals. Key Features:   Cumulative Delta Histogram   – Visualizes net buying vs. selling volume in real-time.   Buy/Sell Volume Medians   – Horizontal lines showing average buy & sell volume lev
Buyers of this product also purchase
Dynamic Forex28 Navigator
Bernhard Schweigert
5 (6)
Specials Discount now. The Next Generation Forex Trading Tool. Dynamic Forex28 Navigator is the evolution of our long-time, popular indicators, combining the power of three into one: Advanced Currency Strength28 Indicator (695 reviews) + Advanced Currency IMPULSE with ALERT (520 reviews) + CS28 Combo Signals (recent Bonus) Details about the indicator  https://www.mql5.com/en/blogs/post/758844 What Does The Next-Generation Strength Indicator Offer? Everything you loved about the originals, now
Enigmera
Ivan Stefanov
5 (8)
ENIGMERA: The core of the market The indicator’s code has been completely rewritten. Version 3.0 adds new functionalities and removes bugs that had accumulated since the indicator’s inception. Introduction This indicator and trading system is a remarkable approach to the financial markets . ENIGMERA uses the fractal cycles to accurately calculate support and resistance levels. It shows the authentic accumulation phase and gives direction and targets.  A system that works whether we are in a tre
IQ Gold Gann Levels a non-repainting, precision tool designed exclusively for XAUUSD/Gold intraday trading. It uses W.D. Gann’s square root method to plot real-time support and resistance levels, helping traders spot high-probability entries with confidence and clarity. William Delbert Gann (W.D. Gann) was an exceptional market analyst, whose trading technique was based on a complex blend of mathematics, geometry, astrology, and ancient mathematics which proved to be extremely accurate. Download
TREND HARMONY MT4 –  Multi Timeframe Trend and Phase and Pullback Level Visualizer indicator for Metatrader4 The TREND HARMONY indicator automates deep trend analysis and generates visualizations for you. Take control of your trades by eliminating uncertainty! Revolutionize your trading experience with precision and insight through the TREND HARMONY Multi Timeframe Trend Indicator – your ultimate MT4 trend visualization indicator. Are you tired of missing trading opportunities or consistently e
TPSpro RFI Levels
Roman Podpora
4.85 (26)
Reversal zones - levels / Active zones of a major player INSTRUCTIONS RUS   /   INSTRUCTIONS   ENG   /   Version MT5 EVERY BUYER OF THIS INDICATOR       GET ADDITIONALLY   FOR FREE   : 3 months access       to trading signals from the service       RFI SIGNALS   — ready-made entry points according to the TPSproSYSTEM algorithm. 3 months access       to training materials with regular updates - immersion in strategy and professional growth. 24/5 support on weekdays and access to a closed traders
Currently 20% OFF ! Best Solution for any Newbie or Expert Trader! This dashboard software is working on 28 currency pairs plus one. It is based on 2 of our main indicators (Advanced Currency Strength 28 and Advanced Currency Impulse). It gives a great overview of the entire Forex market plus Gold or 1 indices. It shows Advanced Currency Strength values, currency speed of movement and signals for 28 Forex pairs in all (9) timeframes. Imagine how your trading will improve when you can watch the e
Core Principles Swing Angle Measurement   Swing angles are calculated by measuring the degree of price movement between swing highs and lows over time. Steeper angles (typically 45+ degrees) indicate stronger momentum and potentially more profitable trading opportunities. Traders use various timeframes to identify these patterns, from intraday charts to weekly swings. Momentum Confirmation   High degree swing angles often coincide with strong momentum indicators like RSI breakouts, volume spikes
Gartley Projection D
Oleksandr Medviediev
3.71 (7)
The indicator identifies the harmonic patterns (XABCD) according to developments of H.M.Gartley ( "Profits in the Stock Market" , 1935г). It projects D-point as a point in the perspective projection (specify ProjectionD_Mode = true in the settings). Does not redraw. When a bar of the working timeframe closes, if the identified pattern point has not moved during Patterns_Fractal_Bars bars, an arrow appears on the chart (in the direction of the expected price movement). From this moment on, the ar
RelicusRoad Pro
Relicus LLC
4.63 (105)
How many times have you bought a trading indicator with great back-tests, live account performance proof with fantastic numbers and stats all over the place but after using it, you end up blowing your account? You shouldn't trust a signal by itself, you need to know why it appeared in the first place, and that's what RelicusRoad Pro does best! User Manual + Strategies + Training Videos + Private Group with VIP Access + Mobile Version Available A New Way To Look At The Market RelicusRoad is th
#EasyWayTradePanel indicator for #MetaTrader4 , is trade assistants for manual trading in any #currency in #FOREX , #CRYPTOCURRENCY as #Bitcoin , #Ethereum , #Lightcoin and more. Also is EasyWay to use for #COMMODITY as #Gold , #Silver , #Oil , #Gas ...... and #CFDs . When installed on the chart in your chosen time frame and trading tool, the indicator automatically draws the following custom indicators used in the EasyWayTradePanel trading strategy. 1) Zigzag_Extreme_Indicator, 2) Regression_C
IQ FX Gann Levels a precision trading indicator based on W.D. Gann’s square root methods. It plots real-time, non-repainting support and resistance levels to help traders confidently spot intraday and scalping opportunities with high accuracy. William Delbert Gann (W.D. Gann) was an exceptional market analyst, whose trading technique was based on a complex blend of mathematics, geometry, astrology, and ancient mathematics which proved to be extremely accurate. Download the Metatrader 5 Version M
PTS Precision Index Oscillator V2
PrecisionTradingSystems
5 (1)
The Precision Index Oscillator (Pi-Osc) by Roger Medcalf of Precision Trading Systems First of all, if you have any questions please contact me via my website which you can find by searching the above title. Version 2 has been carefully recoded to be super fast to load up on your chart and some other technical improvements have been incorporated to enhance experience. Pi-Osc was created to provide accurate trade timing signals designed to find extreme   exhaustion points, the points that markets
Hidden Cycles
Lev Vladimirovic Marushkin
5 (1)
Based on Universal Laws — NOT Some Guy’s Algorithm: Let the market adjust to the Hidden Cycles Geometry — not the other way around. Most indicators are based on a man-made formula. They often lag, fail over time, or need constant re-optimization.  Hidden Cycles is different. It’s the first and only MT4 indicator rooted in universal proportion and perfect relation — the invisible structure that governs all market behavior. Inspired by ideas from Fibonacci, Gann, and Murrey — and built as somethi
Cycle Maestro
Stefano Frisetti
1 (1)
If a new green  NOTE: CYCLEMAESTRO is distributed only on this website, there are no other distributors. Demo version is for reference only and is not supported. Full versione is perfectly functional and it is supported CYCLEMAESTRO , the first and only indicator of Cyclic Analysis, useful for giving signals of TRADING, BUY, SELL, STOP LOSS, ADDING. Created on the logic of  Serghei Istrati  and programmed by  Stefano Frisetti ;  CYCLEMAESTRO  is not an indicator like the others, the challenge wa
Predictive Levels
Satya Prakash Mishra
Market predictive price levels are key technical analysis tools is my finest invention through mathematics to predict automatically next price is where to reach after break any levels. A unique name quality it automatically calculate price range its my own invention according price value to predict what's is next price came than after it not fixed levels like Fibonacci or pivots Its Naveen's Predictive Levels .used to forecast where an asset's price might find support (stop falling) or resistanc
Elliott Wave Trend was designed for the scientific wave counting. This tool focuses to get rid of the vagueness of the classic Elliott Wave Counting using the guideline from the template and pattern approach. In doing so, firstly Elliott Wave Trend offers the template for your wave counting. Secondly, it offers Wave Structural Score to assist to identify accurate wave formation. It offers both impulse wave Structural Score and corrective wave Structure Score. Structural Score is the rating to sh
Splash
Pavel Verveyko
The indicator identifies the most suitable moment for entering the market in terms of market volatility, when the market has the strength to move (the signal is indicated by an arrow under the candle). For each of the signals, the presence of trends on the current and higher timeframes is determined, so that the signal is in the direction of the majority of positions opened on the market (denoted near the signal by abbreviations of timeframes with a trend present). The signal appears after the c
Scientific trade
Aleksey Ivanov
5 (1)
An extremely convenient indicator that truly makes the process of making money on the exchange easy. It is based on the scientifically rigorous theory of the market developed by the author, the beginning of which is presented here .                The full algorithm of this indicator operation is presented in the article .               The indicator calculates the most probable price movement trajectory and displays it on the chart. Based on the predicted price movement trajectory
Pairs Trading Dashboard - Spearman Correlation and Stationary Z-Score  is a custom indicator designed for the MetaTrader 4 (MT4) platform, developed to assist traders in analyzing and monitoring currency pairs for pairs trading strategies. It utilizes Spearman’s rank correlation coefficient and Z-Score calculations to identify trading signals across multiple timeframes and currency pairs. The indicator integrates various technical filters and stationarity tests to refine signal generation and di
Algo Trading Indicaor  With this indicator , you’ll have zones and trends that hight probability the price will reverse from it. so will gives you all the help that you need  Why should you join us !?  1-This indicator is logical since it’s working in previous days movement , to predict the future movements. 2-Algo trading indicator will help you to draw trends which is special and are too strong than the basics trend , trends will change with the frame time that you work on . 3-We can use
Supply and Demand Dashboard PRO
Bernhard Schweigert
4.8 (20)
Currently 20% OFF ! This dashboard is a very powerful piece of software working on multiple symbols and up to 9 timeframes. It is based on our main indicator (Best reviews:   Advanced Supply Demand ). The dashboard gives a great overview. It shows: Filtered Supply and Demand values including zone strength rating, Pips distances to/and within zones, It highlights nested zones, It gives 4 kind of alerts for the chosen symbols in all (9) time-frames. It is highly configurable for your personal n
GoldRush Trend Arrow Signal The GoldRush Trend Arrow Signal indicator provides precise, real-time trend analysis tailored for high-speed, short-term scalpers in XAU/USD . Built specifically for the 1-minute time frame, this tool displays directional arrows for clear entry points, allowing scalpers to navigate volatile market conditions with confidence. The indicator consists of PRIMARY and SECONDARY alert arrows. The PRIMARY signals are White and Black directional arrows which signal a change in
AI Predictor is an artificial intelligence-based indicator trained to forecast future price movements several bars ahead. You can specify the number of forecasted bars in the indicator settings. The longer the indicator remains on the chart and gathers analytical data, the more accurate its price predictions become. The indicator draws future candles predicting with high probability the direction in which the price is likely to move. The AI Predictor indicator is designed to forecast price movem
Introduction Excessive Momentum Indicator is the momentum indicator to measure the excessive momentum directly from raw price series. Hence, this is an extended price action and pattern trading. Excessive Momentum Indicator was originally developed by Young Ho Seo. This indicator demonstrates the concept of Equilibrium Fractal Wave and Practical Application at the same time. Excessive Momentum detects the market anomaly. Excessive momentum will give us a lot of clue about potential reversal and
Beast Super Signal
Dustin Vlok
4.73 (89)
Limited special now on!!! GET 20% OFF! Was $249 now only $199! The Beast Super Signal indicator is a straightforward, trend-based indicator that's easy to use. It continuously monitors current market conditions, looking for new trends or opportunities to join existing ones. When all of its internal strategies align perfectly, the indicator provides a buy or sell signal. Just act on the signal arrow alert; no additional confirmation is needed. This versatile trading tool works across all curren
Detailed blog post with screenshots here: https://www.mql5.com/en/blogs/post/762513 Features: This scanner will show: NRTR Basket Trading Trend direction Last NRTR Switch (breakout) - number of bars and if it was a high volume bar How many bars has the SR stayed steady for When price last entered an NRTR shadow When price bounced off the NRTR shadow back inside NRTR Explained: https://www.mql5.com/en/blogs/post/762509 Basket Trading If you like to basket trade, then you can set multiple scann
Binary Booster
Yaroslav Varankin
5 (1)
Binary Options Trading Indicator: A Reliable Tool for Your Trades This indicator is specifically designed for binary options trading and has proven its high quality, reliability, and adequate accuracy, depending on the dynamics of the chart. Key Points: Signal Interpretation: When a blue cross signal appears, it indicates a potential entry into a trade, though it is considered a weak signal on its own. However, if the blue cross is accompanied by an arrow, it is considered a more reliable buy s
The "Binary Smart Eye" MT4 indicator is designed to provide trading signals for both binary options and forex markets, operating across a wide range of timeframes from M1 to W1. It employs a proprietary strategy that combines trend levels, an intelligent moving average, and optimized trading periods to identify potential entry points. Here's a breakdown of its key features: Multi-Timeframe Analysis: The indicator's versatility allows traders to utilize it on various timeframes, catering to diffe
---- Brand New Strategy. Three Month Rent is $30. ONE YEAR RENT ONLY $50. FREE EURUSD VERSION AVAILABLE UNDER << Forecast System Gift >>. NO NEED FOR BACKTEST! Link to the FREE version -->  https://www.mql5.com/en/market/product/110085?source=Site --- This is a simple strategy based on BREAKOUT and FIBONACCI levels. After a breakout, either, the market: - continues the move directly to the 161, 261 and 423 levels, or - retraces to the 50% level (also called a correction) and thereafter continues
ON Trade Optuma Astro
Abdullah Alrai
5 (5)
This is an astronomy indicator for the MT4 platform like optuma program that performs a variety of functions. It uses complex algorithms to perform its own calculations, which are so accurate. The indicator has a panel that provides astronomical information such as planets' geo/heliocentric cords, distance of sun/earth, magnitude, elongation, constellation, ecliptic cords, equatorial cords, and horizontal cords depending on  the vertical line that generated by the indicator depend on the time va
More from author
Quantum Channel Indicator
Camila Bernardez Camero
3 (1)
Quantum Channel Indicator Logic The Quantum Channel calculates upper and lower boundaries based on the highest high and lowest low over a fixed lookback period. It fills the area between these levels as a shaded channel, updating only when a bar closes. This approach ensures that traders see clear price extremes without lagging distortion. Signals Buy and sell signals appear as arrows when price touches the lower or upper channel boundary, respectively. A green arrow at the lower line indic
Pulse Mark Pro
Camila Bernardez Camero
Pulse Mark Pro – Precision in Trend Reversal Detection The PulseMark Pro indicator has been designed to identify early shifts in market direction. Unlike standard indicators that rely purely on the outcome of the most recent candle, PulseMark Pro applies a proprietary logic to detect the potential inception of a new trend —even when it appears counterintuitive in the short term. It offers a visual representation of momentum shifts through color-coded signals and dynamic dotted trend lines. Stay
Trend Flip Pro
Camila Bernardez Camero
Trend Flip Pro Trend Flip Pro is a structurally-driven signal system that captures directional market transitions based on internal momentum shifts, not traditional visual overlays. Each arrow marks a confirmed shift in control between buyers and sellers, derived from underlying directional strength—not from superficial price movements. Stay Updated Join the official channel to stay informed about future releases and updates:   https://www.mql5.com/en/channels/signalsandindicators No Repain
Auric Pulse System
Camila Bernardez Camero
Auric Pulse System Precision Engineered for Strategic Market Shifts Auric Pulse System is a high-resolution signal framework crafted specifically for traders seeking structural clarity in volatile markets—especially in the behaviorally complex environment of XAUUSD. Unlike conventional tools that rely on visual overlays or lagging momentum oscillators, this system isolates directional triggers based on the underlying mechanics of market flow and asymmetric price displacement. Stay Updated J
Snap Entry System
Camila Bernardez Camero
Snap Entry System Designed for Decisive Execution in High-Pressure Conditions Snap Entry System  is a refined signal architecture tailored for traders who demand accuracy in timing and structure, especially during volatile phases. The core logic combines relative movement dynamics with directional confirmation, offering tactical entry points based on internal price behavior—not external overlays. Stay Updated Join the official channel to stay informed about future releases and updates: http
Nexus Pulse Detector
Camila Bernardez Camero
Nexus Pulse Detector — Advanced Structural Price Signal System How It Works Nexus Pulse Detector is not a repackaged trend tool or a repainter disguised as precision. It's a structurally grounded signal engine that monitors directional imbalance within localized price compression and expansion phases. Every trigger is a reflection of control shifts between market participants, validated through a multi-layered assessment of breakout legitimacy. Stay Updated Join the official channel to stay
Xau Pulse Edge
Camila Bernardez Camero
XAU PulseEdge — Precision-Based Entry System for Gold Built for Gold XAU PulseEdge isn’t about following trends or reacting to lagging patterns. It is designed to detect high-precision entries on XAUUSD by evaluating divergence between short- and long-term market rhythm. Rather than relying on basic threshold conditions, this system maps the internal conflict between fast and slow cycles in momentum buildup. Stay Updated Join the official channel to stay informed about future releases and u
Breakout Box Sentinel
Camila Bernardez Camero
Breakout Box Sentinel Signal System Logic Breakout Box Sentinel Signal is not a simple overlay. It is a structural tool that detects directional commitment through breakout zones generated by price compression. Unlike traditional indicators that smooth or generate visual noise, this system identifies volatility-driven behavior within a clean, session-aware framework. Stay Updated Join the official channel to stay informed about future releases and updates:   https://www.mql5.com/en/channels
Impulse Reactor Signal
Camila Bernardez Camero
IMPULSE REACTOR – Scalp Smarter. React Faster. Impulse Reactor is built on a real-time execution framework that monitors market structure through a custom-weighted price engine. It doesn't follow conventional oscillators or moving average crossovers—instead, it tracks directional momentum derived from intrabar acceleration and deceleration phases. The system evaluates each candle individually, recalibrating bias based on calculated shift intensity and short-term price dislocation. Stay Updated
Pip Storm Signal
Camila Bernardez Camero
PIP STORM Signal PIP STORM is an advanced arrow-based system designed for ultra-frequent execution across volatile market phases. Its primary goal is to maintain a steady flow of actionable scalping signals without relying on lagging or overused indicators. It doesn’t predict — it reacts precisely to transitional price zones, catching micro-breakouts and liquidity imbalances with a minimalist, real-time confirmation engine. Stay Updated Join the official channel to stay informed about future
Prime Strike Signal
Camila Bernardez Camero
Prime Strike Signal – Clear Entry. No Repaint. Prime Strike Signal No Repaint Never is a clean, rule-based signal tool designed for traders who demand visual clarity and consistency in volatile market conditions. It identifies directional shifts with immediate on-chart arrows, helping you stay aligned with short-term price movement without overcomplicating your chart. Stay Updated Join the official channel to stay informed about future releases and updates: https://www.mql5.com/en/channels/si
Quantum Impulse
Camila Bernardez Camero
Quant Impulse Signal – No Repaint, No Backpainting Quant Impulse Signal is a precision-driven tool designed to highlight turning points in market rhythm by comparing high-price and low-price exponential moving averages. It reacts to real-time price action, providing clear entry cues based on confirmed directional moves. Logic The indicator computes an 8-period EMA on the high and low of each bar across every timeframe, then assesses price relative to those EMAs. A buy signal triggers when the cl
Shock Wave
Camila Bernardez Camero
Shock Wave Signal – No Repaint, No Lag, No Backpainting Shock Wave Signal leverages extreme CCI readings to pinpoint potent momentum shifts across any timeframe. It delivers concise entry markers the moment price reaches defined overbought or oversold thresholds. Logic The indicator computes a 5-period Commodity Channel Index (CCI) on each closed bar up to 600 bars back. A buy arrow plots when CCI exceeds +165, signaling overheated bullish momentum. A sell arrow appears when CCI falls below –165
Signal Flash
Camila Bernardez Camero
Signal Flash – No Repaint, No Lag, No Backpainting Signal Flash pinpoints precise entry moments by detecting stochastic crossovers on completed bars. It alerts you immediately via on-chart markers, optional sound and email notifications, and supports all symbols and timeframes without altering historical signals. Logic The indicator calculates %K and %D lines using your chosen periods ( KPeriod , DPeriod , Slowing ) and MA method on the typical price or close/close. A buy arrow appears when %K c
Wolf Pack Fury EA
Camila Bernardez Camero
Wolf Pack Fury EA Introduction Wolf Pack Fury EA is designed for traders who value consistency and prudent capital management. It does not promise overnight miracles; instead, it aims to provide steady monthly returns while preserving complete control over your account balance. The EA operates 24/5, using volatility-based algorithms to adapt to varying market environments. Pricing Price increases by $100 each time 10 units are sold Purchase price: $1,899 Core Features Optimized exclusively f
Trend Pulse Apex
Camila Bernardez Camero
Trend Pulse Apex — Pattern Recognition + Trend Filter + Momentum Filter (No Repaint) Trend Pulse Apex pinpoints high-probability candlestick formations and confirms them with live trend and momentum checks. By plotting immutable arrows and clear labels only on closed bars, the indicator delivers precise visual cues without repainting or lag. Core Features • Pattern Detection: Identifies over ten advanced Japanese trades—including Shooting Stars, Engulfings, Stars, Dojis, Hammers, Piercing Line
Flash Candle MT5
Camila Bernardez Camero
Flash Candle – Real-Time Candle Coloring & Alerts System (No Repaint) Flash Candle evaluates the Williams Percent Range on the most recently closed bar (bar 1) and assigns a definitive color to that candle. The current bar (bar 0) displays a provisional hue until close, ensuring signals are based exclusively on completed data. Non-Repainting Flash Candle is engineered to eliminate any repaint, backpainting or visual alteration. Signals are confirmed only on bar 1—the live bar (bar 0) uses a temp
Clarity Pulse Detector
Camila Bernardez Camero
Clarity Pulse Detector Clarity Pulse Detector analyzes closed bars and accompanying volume bars to identify genuine trend reversals without relying on future data. The indicator calculates pulse strength based on configurable SSP (Signal Strength Parameter) settings and compares recent highs and lows to detect breakout points. Once the required conditions are met on a closed bar, the tool plots a clear buy or sell marker on that bar. All computations occur on confirmed bars, ensuring no false
Pip Blaze Signal
Camila Bernardez Camero
Pip Blaze Signal Pip Blaze Signal is a price-action–based indicator engineered to deliver clear buy and sell alerts without repainting or backpainting. It continuously scans closed bars, comparing recent highs and lows to predefined thresholds. When price breaks a calculated level at candle close, the indicator plots a discrete dot, ensuring each historical signal remains fixed once a bar has closed. Traders receive unambiguous entry cues while preserving chart integrity during live sessions an
Filter:
No reviews
Reply to review