 MetaTrader 5
 专家
 指标
 程序库
 实用工具
 窗口小部件
 规则
适用于MetaTrader 5的免费技术指标 - 62
 技术指标的信号外汇和股票市场的开仓交易和平仓交易起着至关重要的作用。指标的本质就是一种交易品种的数学转换,旨在预测未来的价格变化。
测试技术指标可以更有利于预测市场行为并从中获利。

Session Bias This Strategy of bias useful for those who follow TRADESHARE on youtube. This script is designed by BokaroTraderFx for traders who want assistance in determining their session bias, particularly for those who trade within sessions typically represented by a single 4-hour candle. The method involves using price action to establish a daily bias, guiding decisions on whether to focus on buys, sells, or both. The analysis is based on the previous daily and 4-hour candle closes, fo
FREE

Property of Vertical Capital Edition: Gugol_Quants About USA INDEXES QUANT_INDICATOR: This is a indicator created by math modulation to be used as a trading tool, which was developed in MQL. (MT5) This indicator is for use only with US500(S&P500), NAS100(Nasdaq Composite) and US30(Dow Jones). Signals are activated on "Open" Candle. It’s based on Intraday/Swing Trades whose main timeframe is H1, H2, H3 and H4. However you can use it with other assets by testing with the appropriate settings. *
FREE

Midpoint Bands is a channel-like indicator that draws two lines on the chart - an upper band and a lower band, pointing out possible reversal levels.
This is one of the indicators used in the Sapphire Strat Maker - EA Builder.
Sapphire Strat Maker - EA Builder: https://www.mql5.com/en/market/product/113907
The bands are simply calculated like this:
Upper Band = (HighestHigh[N-Periods] + LowestHigh[N-Periods])/2 Lower Band = (LowestLow[N-Periods] + HighestLow[N-Periods])/2 Middl
FREE
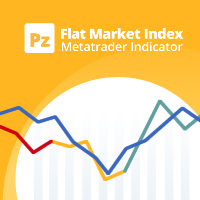
该指标计算代号相对移动了多少才能找到趋势或平淡的市场。它显示最新价格范围的定向百分比。 [ 安装指南 | 更新指南 | 故障排除 | 常见问题 | 所有产品 ] 零值表示市场绝对平稳 值100表示市场完全处于趋势 蓝线表示价格区间健康 红线表示价格范围窄 移动平均线是平坦市场指数(FMI) 它具有直接的交易含义。 当线条为蓝色且在FMI上方时,使用趋势交易策略 当线条为红色且低于FMI时,请使用范围交易策略 根据FMI执行仪器选择 该指标对于避免EA交易平淡交易特别有用。
输入参数 最大历史记录条数:加载时回顾过去的条数。 回顾:研究平盘市场指数的柱线数量。 周期:计算索引的平均周期。 ATR周期:指标中用于计算移动单位的ATR周期。
ATR乘数:ATR的乘数,用于计算索引的移动单位。
作者 ArturoLópezPérez,私人投资者和投机者,软件工程师和Point Zero Trading Solutions的创始人。
FREE
Introduction to GARCH Indicator GARCH is the short initial for Generalized Autoregressive Conditional Heteroskedasticity and it is the volatility prediction model commonly used in financial industry. GARCH model was first appeared in the work by Danish Economist, Tim Peter Bollerslev in 1986. The 2003 Nobel Prize winner, Robert F Engle also added much contribution for the refinement of GARCH model with Tim’s work. Our GARCH INM predictor took the original method of Nelder Mead for GARCH model bu
FREE
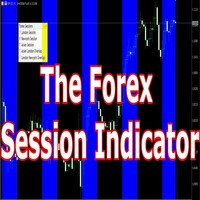
Having trouble marking where the various forex sessions start and end? Or perhaps your strategy requires you trade only in a specific session, then this is for you.
The session indicator shades the session you require in a certain color so that you can identify it easily. The sessions shown include: London session, New York session, Asian Session, Asian - London overlap and London - New York Overlap.
Difference source give varying time ranges for the various session, mostly differing by not m
FREE
This is a custom MACD (Moving Average Convergence Divergence) indicator designed for MetaTrader 5 (MT5) . It replicates the TradingView MACD version , ensuring consistency for traders familiar with that platform. The default MACD in MT5 has differences in its calculation and visualization compared to TradingView. This indicator provides an identical structure, allowing for accurate technical analysis across different platforms. Features TradingView-Style MACD – Matches the histogram, signal lin
FREE

Presentation OPR Median Pro is an indicator designed for traders who use the breakout of the Open Price Range (OPR) strategy.
It automatically identifies the market’s opening range and draws: The upper and lower boundaries of the OPR, The median of the range, And extends these levels throughout your trading session. ️ Main Features
Automatic detection of the OPR (customizable time range)
Clear and precise drawing of the boundaries and median
Automatic extension of lines throughout
FREE

Chart Navigator MT5 Base 是一款用于在价格图表上快速导航,并快速跳转到图表标记位置的迷你地图。 该指标会在图表上添加一个紧凑的完整价格图表迷你地图。通过这张地图,您可以快速浏览历史行情,并返回到用垂直线标记的重要位置。 这个简单导航器的主要价值并不只是滚动图表,而是无需痛苦地手动滚动,就能快速跳转到所需区域。如果您在图表上放置一条垂直线作为重要事件的标记,该垂直线也会显示在迷你地图上。之后,您可以在历史中向前或向后移动很远,随后在迷你地图上找到该标记,并通过一次点击快速返回到所需位置。这对于标记重要日期、信号、交易、新闻、分析区域或任何需要快速返回的位置都非常方便。
工作原理 迷你地图以紧凑的价格线形式显示所选历史区间。主图表当前可见区域会用边框高亮显示。点击迷你地图会将图表移动到所选位置,拖动边框则可以快速浏览历史。 主图表上的垂直线会作为时间标记显示在迷你地图上。因此,迷你地图不仅可用于一般导航,也可作为图表上重要位置的快速指示器。 使用示例 在图表的重要位置放置一条垂直线。 移动到历史中的另一个较远区域,例如几个月或一年之后。 在迷你地图上找到这条垂直线
FREE

M5 H1 24H Analyzer — Free MT5 Indicator M5 H1 24H Analyzer is a lightweight and easy-to-use MT5 indicator designed to analyze the recent 24 hours of H1 candle direction based on the current running M5 candle time . The indicator automatically uses the current M5 candle as the reference time and displays the corresponding H1 candle results from the previous 24 hours. Key Features ️ Automatic M5 Reference Time 24-Hour H1 Candle Analysis BUY / SELL / DOJI Detection Automatic Up
FREE

DEAR USERS?! PLEASE GIVE THIS ITEM YOUR FAIR AND HONEST REVIEW?! Thank you!
️ THE ALPHAQUANT ADVANTAGE: BUILT FOR PROP FIRMS and LIVE ACCOUNTS Most standard dashboards only show you the profit and loss of individual EAs. AlphaQuant goes further to protect your funded accounts: True Account-Level Drawdown Tracking: Prop firms do not care about an individual EA's drawdown; they care about your total account drawdown. AlphaQuant tracks your account's highest equity peak and calculates your true,
FREE
The Market Thermometer can be used to help traders identify sleepy or turbulent periods.
It helps beginners to check when is the ideal time to enter operations, that is, when the value of the thermometer is below its average for several periods, identifying a peaceful market. When the market is heated, that is, the thermometer is above three times its average, it is time to make profits. The Thermometer measures the extent to which the end of a period, maximum or minimum price, projects outsid
FREE

This MQL5 script is a Dynamic Support & Resistance (S/R) Investigator. It functions as a real-time analytical tool that identifies key price levels and mathematically evaluates their "durability" based on historical interactions. Unlike static indicators, it uses a custom Graphical User Interface (GUI) to provide a live dashboard of market structure. 1. Level Detection Logic The indicator scans the most recent InpPeriod (lookback) of bars to identify the absolute highest peak (Resistance) and t
FREE
The Kalires Channel Indicator is a technical indicator used to evaluate trend direction and potential trading opportunities. This is a hybrid indicator that combines Kauffman Adaptive Moving Average (KAMA), linear regression and smoothing. The Kalires Channel Indicator consists of two lines: one central and two outer bands. The central line is a smoothed KAMA modified according to the direction of the trend. The outer bars represent two linear regression lines drawn above and below the center l
FREE

The seven currencies mentioned are: GBP (British Pound): This is the currency of the United Kingdom. AUD (Australian Dollar): This is the currency of Australia. NZD (New Zealand Dollar): This is the currency of New Zealand. USD (United States Dollar): This is the currency of the United States. CAD (Canadian Dollar): This is the currency of Canada. CHF (Swiss Franc): This is the currency of Switzerland. JPY (Japanese Yen): This is the currency of Japan. Currency strength indexes provide a way to
FREE

El indicador técnico conocido como Líneas de Tendencia Perfecta . Este indicador es una herramienta valiosa en el análisis técnico y se utiliza para mejorar la toma de decisiones en el trading. Aquí tienes una descripción paso a paso de cómo funciona y cómo puede ser utilizado por los traders: Identificación de Tendencias : Las líneas de tendencia perfecta se dibujan conectando dos o más puntos de precio en un gráfico, revelando así la dirección general del mercado. Una línea ascendente indica
FREE

Crypto Position Size Calculator - a free position size calculator built for cryptocurrency traders. Enter your account balance, risk percentage, entry and stop-loss prices, and instantly get the exact position size for BTC, ETH and any other crypto symbol your broker offers. Crypto prices move fast and vary wildly between coins, so a fixed position size can mean wildly different risk from one trade to the next. This calculator measures the distance to your stop in the coin's own price and conver
FREE
Hello, This indicator is a unique high reliability 7-in-1 multicurrency indicator comprising these sub-indicator’s: A Trend Power Crossover Indicator. A Percent Change Crossover Indicator. A Currency Overbought/Oversold Indicator. A Currency Deviation Indicator. A Currency Impulse Signal Indicator. A Trend Power Indicator. A Currency Volatility Indicator. The main advantage of this indicator is that it's reasoning by currency and not by currency pair. The values of each sub-indicator are calcula
FREE

ProFactor is an indicator generating signals based price on the famous profit factor formula. The calculation is simply defined as gross GREEN BARS divided by gross RED BARS.
That's it in a nutshell, but sometimes the simplest things hold the most value.
So let's imagine your trading system's gross profit for the past year was $40,000 and your gross losses were $20,000. Your Profit Factor would be 2. The ProFactor calculation works on the price of the asset instead of the strategy outco
FREE

A lightweight, non-intrusive on-chart floating dashboard for MetaTrader 4 (MT4) and MetaTrader 5 (MT5) . It provides critical market telemetry and live account status directly inside the chart window with interactive drag-and-drop and minimize functionality. Key Features Interactive Drag & Drop: Click anywhere on the dashboard panel to reposition it seamlessly across the chart window. Automatic boundary detection keeps the panel within the chart frame. Smart Minimize / Expand Toggle ( _ / + ): C
FREE

If you are Looking Best indicators in Mql5 Market. Check these out!
SSS Scalping Smart Signals MT5 Indicator
Scalping Winning Signals Pro SWS
LTL Long Trend Locator
The Ultimate Challenge Protection Dashboard for Goat Funded Trader (MT5) Pass your Goat Funded Trader (GFT) challenge with confidence using a professional MT5 dashboard designed specifically to help traders stay within the firm's trading rules. UZFX Goat Funded Trader Guardian PRO is an advanced account monitoring indicator that
FREE

中文 (Chinese) 适用于MetaTrader 5 (MT5)的虫洞时间框架指标 不仅仅是另一个交易工具——它是您在金融市场中的竞争优势。专为新手和专业交易者设计,虫洞指标彻底改变了您分析数据和决策的方式,确保您始终领先一步。 为什么您需要虫洞指标 领先竞争对手: 同时在同一图表上查看两个时间框架的能力,让您始终比他人快一步。再也不用在不同图表之间切换,您需要的一切尽在眼前。 发掘隐藏的机会: 改变传统时间框架,发现其他交易者错过的模式。想象一下,您的H1图表在1:59 PM而非2:00 PM关闭,这让您在市场反应之前采取行动。或者调整5分钟图表的边界,从00:01到00:06分析蜡烛,而不是标准的00:00到00:05。这些微妙的变化可以揭示独特的市场动态。 获取可操作的见解: 借助检测趋势、反转和支撑/阻力水平的精密工具,虫洞为您提供自信交易所需的知识。 经验证的创新 虫洞指标并非基于猜测,而是尖端研究的成果: 利用机器学习分析市场低效性。 识别零售交易的集群以揭示隐藏的市场动态。 这些见解推动了一个结合专业级策略的指标开发。 虫洞如何赋能您 更快决策: 实时数据让您始终领先
FREE
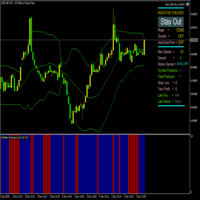
Volatility Exhaustion 指标 用户说明 Volatility Exhaustion 是一款独特的指标,采用特殊的波动率分析技术。它能识别市场中当前活动相对于历史数据达到极端水平的关键时刻。 主要特点: 简单易懂 :指标使用二元信号系统
通用性强 :适用于任何时间周期和交易品种
高效实用 :在盘整和趋势市场中尤其有效
视觉清晰 :信号颜色区分明确 视觉显示: 蓝色柱状图(高度10) :市场活动增强信号 - 进场良机
红色柱状图(高度10) :低活动期 - 建议暂停交易
无柱状图 :分析数据不足 技术规格 输入参数: 周期(默认:14) :分析的历史周期长度(默认分析14根K线) 系数(默认:1.5) :信号敏感度系数(1.5为阈值敏感度水平) 指标缓冲区: 缓冲区0(蓝色) :有信号时值为10,无信号时为0 缓冲区1(红色) :无信号时值为10,有信号时为0 缓冲区2和3 :内部计算缓冲区(不用于交易) 连接到智能交易系统 // 全局变量声明 int handle_volatility_exhaustion = INVALID_HANDL
FREE

BreakEven Finder 是一款免费的轻量级 MetaTrader 5 指标,专为剥头皮交易者和日内交易者设计。它通过分析实时价格和持仓数据,在图表上直观显示盈亏平衡点,帮助交易者判断当前持仓是否接近盈亏平衡或已达到微利状态,从而实现更精准的交易管理。 核心功能: 实时显示每笔交易的盈亏平衡价格 自动整合多个持仓点,计算加权平均平衡位 可视化清晰,避免复杂图形干扰判断 支持任意交易品种和时间周期 与其他指标兼容性强,不影响图表速度 优势和适用人群:
适用于注重精确进出点控制的短线交易者、需快速识别盈亏变化的量化系统用户以及希望提升风险管理效率的投资者。 此工具帮助交易者减少主观判断错误,提高决策效率,是提高稳定盈利能力的理想助手。
FREE
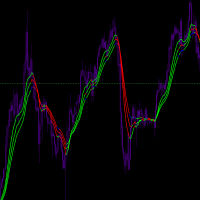
Input Parameters JawPeriod (default=9): Period for the blue line JawShift (default=0): Shift for the blue line TeethPeriod (default=7): Period for the red line TeethShift (default=0): Shift for the red line LipsPeriod (default=5): Period for the green line LipsShift (default=0): Shift for the green line Signals Bullish Conditions When price moves above all lines (all lines turn Lime) Potential buying opportunity Confirms upward momentum Bearish Conditions When price moves below all
FREE

UZFX Professional Trader Panel v1.0 – Your Complete Trade Monitoring Solution Stop juggling between multiple charts and terminal tabs. Get a complete bird's-eye view of your entire trading portfolio in one elegant, real-time dashboard. Transform your chart into a professional trading command center. Monitor all open positions, account health, and floating P&L at a single glance. If you are Looking Best indicators in Mql5 Market. Check these out!
SSS Scalping Smart Signals MT5 Indicator
Scalpi
FREE

Titan Strength Pro Indicator- Multi-Currency Strength Analysis System Overview Titan Strength Pro is a technical indicator that analyzes the relative strength of 8 major currencies (USD, EUR, GBP, CHF, CAD, AUD, JPY, NZD) across all 28 forex pairs simultaneously. The indicator calculates currency strength values across multiple timeframes and generates trading signals based on strength divergence, trend alignment, and multi-timeframe convergence. This is an indicator tool that provides anal
FREE

================================================================================ VL LEVELS INDICATOR - USER GUIDE VolumeLeaders Institutional Trade Levels for MetaTrader 5 ================================================================================
WHAT IS THIS INDICATOR? ----------------------- This indicator displays VolumeLeaders institutional dark pools trade levels on your MT5 charts. These levels represent price points where significant institutional trad
FREE

Click2FiboDrawer – Instantly Draw Fibonacci Retracement Lines with 2 Clicks Click2FiboDrawer is a powerful manual drawing tool for discretionary traders who use Fibonacci retracements in their technical analysis.
With just two mouse clicks, you can draw clean and precise Fibonacci levels directly on your chart — no clutter, no menus, no hassle. Even during fast-paced scalping sessions, this tool enables you to quickly add Fibonacci retracement levels and react to market moves in real-time.
It’s
FREE

Tick Push Strength Indicator Catch rapid market momentum before the candle even closes. The Tick Push Strength Indicator tracks live order flow on a raw, tick-by-tick level. While standard indicators suffer from lag, this tool calculates the exact speed and volume pressure behind every micro-movement—giving you an instant visual of whether Bulls or Bears are driving the market. Key Highlights: Zero-Lag Analysis: Measures real-time tick velocity instead of waiting for candle closes. Breakout
FREE

Macro-R Pro Signal — Advanced Trading Signal Indicator Macro-R Pro Signal is a professional trading indicator designed to deliver high-quality BUY and SELL signals with enhanced precision and reduced market noise. By combining Bollinger Bands, RSI, and adaptive volatility filtering , this indicator helps traders identify high-probability reversal points while avoiding unfavorable market conditions.
How the Strategy Works This indicator is built on a mean reversion + momentum confirmation concep
FREE

The Big Short (Smart Money)
The Big Short (Smart Money) is a professional chart analysis indicator for MetaTrader 5, designed to help traders read market pressure, absorption zones, flow behavior, and important reaction areas directly on the chart.
This indicator was created for discretionary traders who want a clearer visual view of buy and sell pressure without using multiple separate indicators.
It is especially useful for fast chart reading on lower timeframes such as M1, and is suitab
FREE
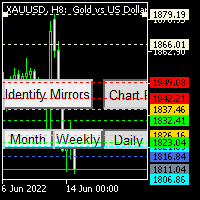
I always wondered if I can have multiple time frame Moving average on same chart , it is not possible , now with my Indicator is possible , As you know Moving average is lagging not leading indicator , but how can I predict future levels of it ?
I came with this idea , I hope you will like it , I made a Mirror of Moving average , the other side of specific time will be shown in the other side of the chart where the price didnt reach yet , that will help you to know the levels you can start sell
FREE
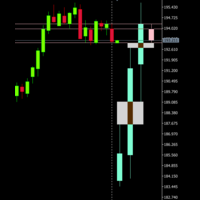
If you like this product, please give it a 5 star rating as a token of appreciation. This indicator projects Higher-Timeframe (HTF) candles onto the current chart and optionally shows their OHLC lines and Fair Value Gaps (FVGs) using ICT 3-candle logic.
Projects multiple higher timeframe candles.
Accurately preserves HTF OHLC on any lower timeframe.
Allows spacing adjustment between projected candles.
Optionally displays OHLC horizontal reference lines.
Automatically detects and draws HTF Fair
FREE

WHO IS THIS FOR?
→ Manual traders who want to track performance without leaving MT5 → EA developers who need quick visual feedback on strategy results → Fund managers who want a clean, presentable performance overview → Anyone serious about understanding their trading edge
WHAT MAKES IT DIFFERENT
Most trading dashboards show you numbers. This one shows you the
FREE

LotCalc is a minimalist MT5 indicator designed for fast, precise position sizing. Set your risk amount in dollars, click the button, then click your entry and stop-loss levels directly on the chart — the lot size and point distance are calculated and displayed instantly. No clutter, no extra panels, just the one tool you actually need before placing a trade.
FREE

Are you having trouble with too many events in the economic calendar? This reduces to the minimum number you need. You can filter by country code importance any key words and you can receive alerts before the set time of the event. ++++++++++++++ If country code is blank, display available code on the expert tab. You need to turn off the automatic calendar update setting in MT5. Any sound file of .wav format in Sounds directory. The length of keyword characters is limited by MT5.
FREE
Простой индикатор, показывающий цены Bid и Ask. Есть настройки отображения информации и возможность перетаскивать панель. Индикатор используется для наглядного отображения цен покупки и продажи актива.
Входные параметры : Support - Ссылка, на помощь проекту heigth - Высота формы width - Ширина формы size - Размер текста bidcol - Цвет текста bid askcol - Цвет текста
FREE

Spread Engine Nika — MetaTrader 5 实时点差分析工具 Spread Engine Nika 是一款专业的 MetaTrader 5 点差分析指标。它利用历史 Tick 数据为任意交易品种构建统计点差档案,实时展示当前点差状况,并即时判断当前点差是正常、偏高还是危险——所有信息集中显示在图表上的紧凑面板中。 专为剥头皮交易者、日内交易者以及关注执行成本的交易者而设计,将原始点差数据转化为可操作的市场情报。 功能说明
点差档案引擎
— 分析最多 120 天的历史 Tick 数据,并将其划分为时间桶(可配置,默认 15 分钟)。每个桶存储平均值、中位数、75 百分位数、最大值、标准差和跨日标准差。
实时点差显示
— 实时显示当前点差,根据是否在该时间窗口的历史正常范围内以绿色/红色标注。
市场状态识别
— 根据 Z 分数相对于桶分布,将当前市场环境分类(如:低 / 正常 / 偏高 / 高)。
Z 分数与百分位数
— 精确显示当前点差在该时段统计分布中所处的位置。
当前 vs 下一时段对比
— 并排表格显示当前桶和下一个桶的 Avg、Medi
FREE

This indicator is designed based on the Moving Origin indicator
When the moving origin indicator breaks the price, this indicator gives a signal
It is useful for better viewing of signals and analysis on them
Attributes: Can be used in all symbols Can be used in all time frames Too many signals Simple and quick settings Easy way to work
Settings: period: like moving average settings alarmShow: If you want to receive an alert in Metatrader after receiving the signal, enable this setting
alarmS
FREE
ContiStat restricted - Free DEMO version of the ContiStat indicator
Free version of the indicator is ment as DEMO of full paid version. Full functionality is available, however The indicator work only on M30 chart period . Find the ContiStat indicator for full functionality
Brief description The ContiStat indicator calculate statistic frequency of green (up) and red (down) movement in the chart and determine movement dynamics (silver curve). There are two key parameters to understand the ContiSt
FREE

Trading Report 是一款轻量且功能强大的可视化指标,实时显示账户和交易的核心信息 — 全部集中在一个优雅、可完全拖拽的极简面板中。 主要功能 每跳动更新(持仓及浮动盈亏实时显示) 当前持仓详情(BUY/SELL + 手数 + 开仓价 + 浮动盈亏带绿/红颜色) 当日盈亏及余额变化(自动上色:绿=盈利 | 红=亏损 | 白=持平) 完整统计:Balance、Equity、总交易数、胜/负、胜率(%)、盈利因子、最佳/最差交易 可点击的“Report”按钮:点一次显示,再点一次完全隐藏(快速清理屏幕) 完全可拖拽:拖动按钮即可把报告放在图表任意位置 优势 不固定占用屏幕,一键隐藏 无需打开历史即可一览当日和账户表现 完美适合多品种交易者 极适合录屏、直播、教学和日常监控
FREE

Session MA Created by Denis Kislitsyn | denis@kislitsyn.me | [ kislitsyn.me ]( https://kislitsyn.me/personal/algo ) Version: 1.0
SessionMA is a specialized Moving Average (MA) indicator for MetaTrader 5 that calculates the MA only on bars that fall within a specified session time window. Unlike standard MA indicators that calculate across all available bars, SessionMA filters calculations to include only the data points that occur during your defined trading session.
This indicator is particu
FREE

The “Summary Risk Target” indicator is designed to show the total number of transactions made on a single pair. The transactions counted include active positions as well as pending orders . By setting a stop loss for each trade, this indicator displays the total potential risk (loss) that may be incurred. This helps traders easily understand their overall risk exposure without the need for manual calculations. Likewise, for take profit , if the TP level is defined—either in terms of pips or at a
FREE

RQL Trend Board – Description RQL Trend Board is a simple but powerful multi-timeframe trend dashboard.
It shows the current market bias across several timeframes at the same time, using an internal trend-classification method. Each timeframe is displayed as a colored box: Green – bullish bias → look for long setups
Yellow – ranging / unclear → no trade zone
Red – bearish bias → look for short setups The indicator gives a clear overall picture of where the market wants to go, instead o
FREE
Overview
MAM Forecast is an indicator designed to replace guesswork with probabilities. It generates two adaptive levels—UP and DN—along with probabilities that always sum to 100%, giving you a clear idea of which level price is more likely to reach within the chosen horizon. Key Features Displays UP (upper) and DN (lower) adaptive levels calibrated to market volatility. Shows touch probabilities (e.g., 62% vs 38%) for likelihood within the defined horizon. Clean, informative HUD indicates sym
FREE

黄金交易面板 - 终极交易仪表盘 为什么选择黄金交易面板? 强大功能: 专业仪表盘,优雅金色设计 单一界面全面账户概览 每1-10秒自动刷新(可自定义) 智能颜色编码,即时识别交易状态 实时信息显示: 开仓交易数量 - 追踪所有活跃头寸 账户余额 - 基础货币当前余额 浮动盈亏 - 实时利润/亏损,自动颜色标识 当前净值 - 投资组合总价值 友好品种名称 - 黄金、白银、比特币等 实时价格 - 实时市场价格更新 交易类型 - 买/卖/对冲,颜色指示 止盈区域 - 显示多个TP水平 止损区域 - 一次性显示所有SL水平 盈亏百分比 - 相对于余额的利润/亏损百分比 完全自定义: 选择面板颜色匹配您的交易风格 根据需求调整刷新率 选择面板位置(4个角落可选) 修改字体大小提高可读性 完美适合以下交易者: 需要在一个地方查看完整账户概览 交易时需要快速访问信息 偏好简洁专业的界面 交易多种资产(外汇、金属、加密货币) 使用简单: 在任何MT5图表上加载指标 根据喜好自定义颜色 观察面板自动出现 享受实时更新 ️ 独
FREE

趋势冲击通道 指标是一个先进的技术分析工具,基于价格冲击和波动率创建动态趋势通道。它将ATR(平均真实范围)与自适应算法相结合,生成精确的趋势识别信号。 主要功能: 自适应趋势线 :基于波动率以智能步长跟随价格 动态通道 :上下带自动适应市场条件 重测信号 :三角形标记显示重要的支撑/阻力重测 趋势步进信号 :每个新趋势步骤的圆形标记 翻转保护 :通过可调整的持有期防止过度趋势变化 参数设置: 触发阈值 (2.86) :趋势翻转的阈值(ATR乘数) 最大步长 (-0.034) :每次移动的最大步长 带宽乘数 (2.02) :波动率带的宽度 趋势持有 (0) :下次趋势翻转前的最小K线数 应用场景: 完美适用于波段交易、趋势跟随策略以及识别进场和出场的关键区域。 信号解读: 绿色趋势线和通道表示看涨动量 红色趋势线和通道表示看跌动量 三角形信号标记通道边界重测 圆形信号标记结构性趋势推进 技术特点: 基于200周期ATR的波动率计算 智能步长调整算法 可自定义的视觉显示选项 多重信号确认机制 使用建议: 在趋势明确的市场中效果最佳 结合其他指标进行信号确认 根据不同时间框架调整参数 注
FREE

This indicator is an utility for have always under control, how much time is left at the end of the bar setted.
The utility show on the lower right of the chart, the countdown to the end.
When the remaining seconds is = to the seconds set in the input, the color of remaining seconds on chart, change color and play a warning sound to warn you that the bar is about the end. When the remaining seconds is < to the seconds set in the input, the utility play a beep to warn you that the bar is in co
FREE

Nexa Gold Relative is a professional Gold trading indicator designed for XAUUSD traders who prefer cleaner and more selective trade signals.
The indicator combines a Gold-focused price calculation engine with RSI confirmation, ATR-based trade zones, candle confirmation, session filtering, signal cooldown, and mobile alerts.
Nexa Gold Relative is built to help traders identify structured BUY and SELL setups directly on the chart, with clear Entry, Stop Loss, and Take Profit areas.
Main Featur
FREE

The MetaTrader 5 Position Indicator is a custom technical tool designed to enhance traders' ability to monitor and manage their positions effectively. It displays key trade details such as stop-loss (SL), take-profit (TP), groups them where they are the same, average buy price, and average sell price directly on the chart. Costs accounted for. Key Features:
Displays TP and SL levels
Groups TP and SL levels where they are the same
Shows average buy and sell price levels Candlestick countdown Pan
FREE
Hi Traders, The THV EMA Distance Monitor is a lightweight and flexible MT5 indicator designed to display the real-time distance between price and multiple Exponential Moving Averages (EMA) directly on the chart. The indicator allows traders to enable or disable up to five EMAs, each with a customizable period, making it adaptable to different trading strategies and market conditions. For each selected EMA, the distance from the current price is calculated and displayed in a clear on-chart panel.
FREE
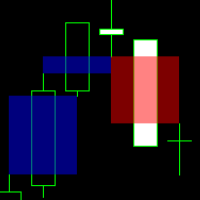
This indicator identifies and highlights market inefficiencies, known as Fair Value Gaps (FVG), on price charts. Using a custom algorithm, the indicator detects these areas of imbalance where the price moves sharply, creating potential trading opportunities. Indicator Parameters: Bullish FVG Color (clrBlue) : Color used to highlight bullish inefficiencies. The default value is blue. Bearish FVG Color (clrRed) : Color used to highlight bearish inefficiencies. The default value is red. Bullish FVG
FREE

The SpreadTracer and TimeLeft indicator is a powerful yet straightforward tool designed for traders who want to keep a close eye on market conditions directly on their chart. This custom indicator provides essential real-time information about the spread and candle time, making it easier to make informed trading decisions. Key Features: Current Spread Monitoring : The indicator constantly displays the current spread of the trading pair, helping you assess the cost of entering or exiting a positi
FREE

El indicador técnico Non Lag MA (Non-Lagged Moving Average) es una variante de la media móvil que busca reducir el retraso inherente a las medias móviles tradicionales.
Pros: - Menos retraso: Al estar diseñado para reducir el retraso, el Non Lag MA puede proporcionar señales más rápidas que las medias móviles tradicionales. - Tendencias claras: Las líneas del Non Lag MA muestran claramente las tendencias alcistas y bajistas, lo que facilita la interpretación de la dirección del mercado. - Pers
FREE

Professional Support and Resistance Indicator This indicator was developed as a market context study and analysis tool , designed to help identify potentially relevant areas on the chart through the combination of price action, volume, and higher-timeframe market structure . The indicator displays two layers of horizontal dashed lines , positioned at areas considered relevant for analysis. This allows traders to observe different support and resistance zones and evaluate their relationship with
FREE

Wave123 BOS Indicator (XAUUSD M15 Optimized) Wave123 BOS Indicator is a modern, chart-based Break of Structure (BOS) + Breakout (BO) visualization tool built for traders who want clear market structure signals directly on the chart — with a strong focus on XAUUSD (Gold) on the M15 timeframe . Gold moves fast and often breaks structure with sharp impulses and quick retraces. This indicator is designed to highlight those moments clearly, so you can trade with better direction, timing, and confiden
FREE
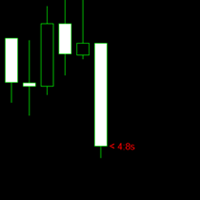
K线剩余时间的作用是 为了帮助交易者更好地理解市场动态,并做出更精准的交易决策 。在金融市场中,尤其是外汇和二元短线交易领域,了解K线图的剩余时间对于交易者来说至关重要。下面将详细探讨K线剩余时间指标的重要性及其在不同交易策略中的应用: 提高交易时机把握的准确性 精确计时 :通过显示当前K线周期的剩余时间,交易者可以更精确地把握入场和出场的时机 。 避免延误 :减少因估计时间而产生的误差,避免在关键时刻延误操作 。 优化策略执行 :使交易者能够在K线闭合前及时调整其交易策略,以应对市场变化。 增强交易体验 辅助工具 :作为辅助指标,K线剩余时间可以提高交易者的交易体验,减少心理负担 。 减轻心理压力 :通过直观显示剩余时间,减轻交易者在交易过程中的心理压力,特别是在快速变化的市场中。 提升交易效率 :使交易者能够更加专注于市场分析,而不是频繁检查时间。 适应不同交易周期 多周期适用性 :无论是一分钟、五分钟还是更长的时间周期,K线剩余时间指标都能提供准确的时间信息 。 灵活调整 :交易者可以根据不同的交易策略和市场条件,灵活调整对时间敏感度的需求。 支持复杂策略 :对于实施多时间框架分
FREE

The ONLY RSI Indicator You'll Ever Need - Works with ANY Broker, ANY Symbol! Finally, an RSI indicator that automatically adapts to YOUR broker's symbol naming conventions! Whether you trade Forex, Gold, Bitcoin, or Stock Indices - this universal indicator detects and monitors related symbols automatically. KEY FEATURES & BENEFITS UNIVERSAL COMPATIBILITY Auto-Detects Broker Patterns : Works with ANY broker suffix (.m, .pro, .raw, etc.) All Asset Classes : Forex, Metals (Gold/Silver), Crypto,
FREE

Umagads Candle Timer MT5:纪律交易者的专业精准计时工具 在快速波动的市场中,准确掌握蜡烛图收盘时间是区分完美进场与错失机会的关键。 Umagads Candle Timer MT5 是一款专为要求极致精确执行的交易者设计的高效工具。无论您是进行 M1 超短线交易还是日线波段交易,此工具都能为您提供实时的倒计时提醒,确保您始终比市场走势领先一步。 核心功能: 智能时间显示: 根据周期自动调整格式:日内显示“分:秒”,小时图显示“时:分:秒”,长期图表则增加天数显示。 视觉紧急系统: 在最后 10 秒倒计时,计时器颜色自动变为橙色,为您的决策提供直观的视觉信号。 动态位置选择: 支持“跟随价格”显示或固定在图表的四个角落,确保工作区整洁且互不干扰。 多渠道警报: 集成弹窗、手机推送和电子邮件警报,并支持提前 30 秒预警功能。 极致优化: 采用精简代码编写,即便在成交活跃的高频行情下也能确保零延迟运行。
FREE

Candle Countdown Pro – Multi-Timeframe Candle Countdown for MetaTrader 5 Candle Countdown Pro is a professional multi-timeframe indicator for MetaTrader 5 that displays the remaining time until the next candle closes across multiple timeframes simultaneously. The indicator features a clean and easy-to-read countdown panel directly on the chart and supports all major timeframes from M1 to W1 . This allows you to instantly see when the next candle will close on every selected timeframe. The panel
FREE
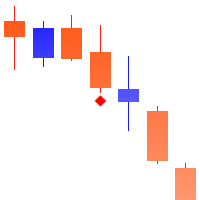
惯性点是一个强大的工具,用于检测价格运动的临界点,基于计算价格波动的惯性的想法。
_________________________________
如何使用指标信号:
指标在新的价格条出现后产生信号。 建议在价格突破指定方向的临界点后使用生成的信号。 指标不重绘其信号。
_________________________________
指标参数建议更改信号箭头的显示样式。 不提供更改用于计算的参数-这是由于我的产品的哲学:稳定性和客观性。
_________________________________
欢迎您的任何问题和建议,可以私信发送
_________________________________
提前感谢所有有兴趣的人,祝你好运征服市场!
FREE

Chart Status Bar MT5 是一个严格只读的信息型指标,可直接在图表上显示重要的市场、连接状态和交易品种信息。
紧凑状态栏显示: • 经纪商交易时段以及下一次时段切换; • 终端连接状态; • 最新 Tick 的时间; • 当前点差(points 和 pips); • 当前 K 线剩余时间; • 交易服务器时间。
DETAILS 面板还显示: • 品种交易模式; • 最小、步进和最大交易量; • Stop 和 Freeze 距离; • Tick Size 和 Tick Value; • 合约大小; • 当日波动范围和涨跌幅; • 启动后观察到的最小、平均和最大点差; • 参考交易量的预估点差成本; • 参考交易量的预估保证金; • 多头/空头 Swap 及三倍 Swap 日期; • 服务器、本地和 UTC 时间; • 基础货币、盈利货币和保证金币种; • 经纪商声明的下一次交易时段切换。
界面会根据可用宽度自动调整,并在必要时缩短过长文本。
所有估算仅使用经纪商提供的品种属性和市场数据。如果缺少必要数据,指标将显示 N/A,而不会生成未经支持的数值。
Char
FREE

Step Line Chart I created this indicator because I couldn't find a built-in step line chart in MT5, and I was tired of switching back and forth to TradingView just to see one. This is my very first indicator, originally made for my own personal use, and I am sharing it for anyone who might have the same need. What it does: Transforms the standard MT5 Line Chart into a clean Step Line chart based on Close prices. When attached, it automatically switches the chart mode to "Line Chart" and hides t
FREE
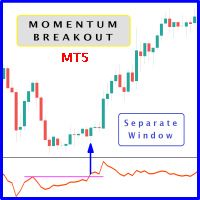
When prices breakout resistance levels are combined with momentum oscillator breaks out its historical resistance levels then probability emerges to record farther higher prices. It's strongly encouraged to confirm price breakout with oscillator breakout since they have comparable effects to price breaking support and resistance levels; certainly short trades will have the same perception. Concept is based on find swing levels which based on number of bars by each side to confirm peak or trough
FREE

This is a simple and lightweight indicator that displays the live spread of the trading instrument on the top left corner of the screen. It is built to be lightweight, performant and react to real time price feed. The spread is the difference between the Ask and Bid price of the trading instrument. This is the cost that the user needs to pay for immediate execution. It is crucial to know and track the spread to be aware of costs involved. In the standard accounts, the spread is the only cost you
FREE
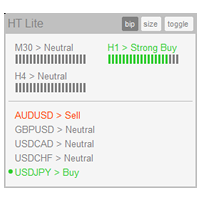
The indicator High Trend Lite monitors 5 symbols in up to 3 timeframes simultaneously and calculates the strength of their signals. The indicator notifies you when a signal is the same in different timeframes. The indicator can do this from just one chart. Therefore, High Trend Lite is a multicurrency and multitimeframe indicator. With the High Trend Pro , available at this link , you will have an unlimited number of symbols, 4 timeframes, a colourful chart of the primary MACD indicator, several
FREE
Бинарный индикатор находит свечной паттерн "Поглощение" и рисует соответствующий сигнал для входа рынок. Имеет встроенные фильтры и панель для просчета количества успешных сделок. Демо версия является ознакомительной, в ней нет возможности изменять параметры. Полная версия . Особенности Работает для всех валютных пар и любых таймфреймов. Индикатор рассматривает комбинацию из 2-х или 3-х свечей в зависимости от настроек. Имеется возможность фильтровать сигналы путем настройки количества свече
FREE

Non-proprietary study of Joe Dinapoli used for overbought/oversold evaluation. Uses of Detrended Oscillator indicator Profit taking. Filter for market entry technics. Stop placement. Part of volatility breakout pattern. Determining major trend changes. Part of Dinapoli Stretch pattern. Inputs lnpPeriod: Perid of moving average Method: Calculation method ********************************************************************************* If you want to know market Overb
FREE

Description The Profit and Loss Indicator by Creative Tech Solutions is a robust and comprehensive tool designed to help traders monitor their trading performance in real-time. This indicator provides detailed metrics on profits and drawdowns, ensuring traders are always informed about their trading activities and performance. With customisable alerts and display settings, this indicator is an essential tool for any serious trader. Features Real-Time Metrics : Monitor profit and drawdown percent
FREE
MetaTrader 市场 - 在您的交易程序端可以直接使用为交易者提供的自动交易和技术指标。
MQL5.community 支付系统 提供给MQL5.com 网站所有已注册用户用于MetaTrade服务方面的事务。您可以使用WebMoney,PayPal 或银行卡进行存取款。
