 MetaTrader 5
 Эксперты
 Индикаторы
 Библиотеки
 Утилиты
 Виджеты
 Правила
Смотри обучающее видео по маркету на YouTube
Как купить торгового робота или индикатор
Запусти робота на
виртуальном хостинге
виртуальном хостинге
Протестируй индикатор/робота перед покупкой
Хочешь зарабатывать в Маркете?
Как подать продукт, чтобы его покупали
Бесплатные технические индикаторы для MetaTrader 5 - 62
 На основании сигналов технических индикаторов принимаются решения относительно открытия или закрытия сделки на фондовом и форекс-рынках. Суть индикаторов заключается в математическом преобразовании цены и/или объемов финансового инструмента для прогнозирования изменений цен в будущем.
Протестируйте технические индикаторы, чтобы лучше предсказывать поведение рынка и зарабатывать на этом.
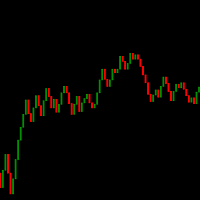
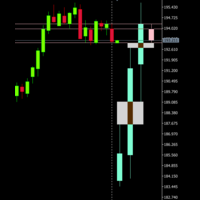
Candle de Volume Coiote O Candle de Volume Coiote é um indicador que mede a variação do volume no tempo, seu corpo é pela variação do volume anterior pelo volume atual, sua direção pelo fechamento do preço.
1. identificado um topo no indicador Candle de Volume Coiote (marcado o fechamento do preço).
2. identificado um fundo no indicador Candle de Volume Coiote (marcado o fechamento do preço).
3. fundo 3 igual fundo 2 no indicador Candle de Volume Coiote, preço no 3 é diferente de fundo 2.
P
FREE

Non-proprietary study of Joe Dinapoli used for trend analysis. The indicator gives trend signals when the fast line penetrates the slow line. These signals remain intact until another penetration occurs. The signal is confirmed at the close of the period. It is applicable for all timeframes. Parameters Fast EMA: period of the fast moving average. Slow EMA: period of the slow moving average. Signal EMA: period of the signal line. ************************************
FREE

Данный индикатор сделан на основе Moving Average. Он помогает пользователю определиться с направлением сделки. В утилиту также встроена функция звукового уведомления при появлении нового сигнала. Дополнительно доступна функция уведомления по email. Ваш e-mail адрес, а также параметры SMTP сервера должны быть указаны в настройках терминала MetaTrader 5 (вкладка "Почта"). Синяя стрелка вверх = Покупка. Красная стрелка вниз = Продажа. Line = Трейлинг стоп. Вы можете использовать один из моих продук
FREE

# MiniBull Report (v1.06) — free
**Your market briefing in a sub-window. MiniBull Report answers the questions an intraday trader asks before every decision — in plain language, in your own time zone, and with the same answers on every chart timeframe.**
*Where is price against the monthly, weekly, daily and 4H trend? How far is it stretched? How much of today's typical range is used? Where are the nearest resistance and support? Is a high-impact event coming? What speaks for a long, what spe
FREE

Представляем Вам Volatility Doctor Compass – Ваш надежный проводник к прибылям на любом рынке!
Раскройте Секреты Вечных Математических Законов: Окунитесь в суть мастерства торговли с нашей уникальной технологией, укорененной в математических принципах, которые выходят за пределы каждого рынка. Хотя мы не раскрываем секреты, будьте уверены, эта инновация – ваш билет к непревзойденной надежности в любых рыночных условиях.
Революционная Двойная Функциональность: Представьте себе возможност
FREE

Chart Navigator MT5 Light — мини-карта для быстрого перемещения по графику цены и оперативного перехода к вашим меткам на нём. Данный индикатор добавляет на график компактную мини-карту всего ценового графика. Эта карта помогает быстро перемещаться по истории и возвращаться к важным местам, отмеченным вертикальными линиями. Главная польза такого простого навигатора — не прокрутка графика, а быстрый переход к нужной области без мучительного скроллинга при ручном поиске. Если на графике поставить
FREE

The Moving Averages On-Off let you control the indicator using the keyboard or a button . You can choose if you want the indicator always shown or always hided while switching among different time frames or financial instruments . ---> This indicator is part of Combo Indicator OnOff
It's possible to setup three Moving Averages : Short , Medium , Long
Input You can customize the price type used for calculation : close, open, high, low, median price, typical price, weighted It's
FREE

Az Speedometer measures price impulse quality — not just candle size, but whether that move is backed by real momentum, volume, and direction. A single glance tells you if the current bar is a meaningful push or just noise. "A green bar alone means nothing. Az Speedometer shows you green bars with high volume, a clean candle body, and three consecutive bullish closes — that's a signal worth taking." How it works: Speed ratio : Candle range vs ATR — how fast is price moving relative to its av
FREE

MT4 version Overview The Lowess Channel indicator is a smoothed trend-following tool designed to help traders identify the direction of the trend , detect flat or ranging markets , and spot breakouts from consolidation zones. It creates a central smoothed line with upper and lower channel boundaries, adapting to market noise while maintaining clarity. How It Works The indicator builds a channel around a smoothed price line. The central line reflects the current trend. The upper and lower bounda
FREE

FVG+BOS EA is a smart trading tool that visually highlights Fair Value Gaps (FVG) and Break of Structure (BOS) directly on the chart. It helps traders easily identify potential Points of Interest (POI) for high-probability trade setups. The EA also displays the active market sessions — London, New York, and Tokyo — to help users align trades with key trading hours.
FREE
The Market Thermometer can be used to help traders identify sleepy or turbulent periods.
It helps beginners to check when is the ideal time to enter operations, that is, when the value of the thermometer is below its average for several periods, identifying a peaceful market. When the market is heated, that is, the thermometer is above three times its average, it is time to make profits. The Thermometer measures the extent to which the end of a period, maximum or minimum price, projects outsid
FREE

*** IMPORTANT NOTE: For the best visual experience, please change your standard chart type to 'Line Chart' (Alt+3) and set the 'Line Graph' color to 'None' in chart properties (F8) to hide the default MetaTrader candles. ***
LZ Kyushu Legs Basic is a streamlined visual momentum indicator that replaces traditional Japanese candlesticks with noise-free, wickless Kyushu Legs. By focusing exclusively on pure price momentum and filtering out market noise, this tool allows traders to easily identify
FREE
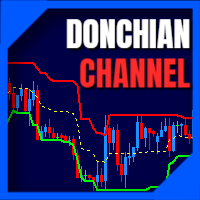
The donchian channel indicator might just be the best fit for you
Trading in derivative products such as futures, options, CFD's, forex and certificates contains significant risk. These products are not suitable for every investor. Investors could potentially lose all or more than the original investment. If anything, only money equal to personal risk capital should be used and can be lost without jeopardizing financial security or lifestyle. Partially or fully automated trading programs can
FREE

Visualize seu histórico de negociações de forma estruturada e detalhada, com taxas de acertos e lucro separados por dia, semana, mês e total, além de detalhes sobre o ativo, horário do servidor e posições/ordens em andamento. Este painel foi criado visando o uso em contas do tipo HEDGE, porém pode ser utilizado em contas do tipo NETTING sem nenhum problema. Na versão PREMIUM deste Painel você tem opção de utilizar uma micro boleta com botões para facilitar o tratamento e execução de ordens em an
FREE

Индекс относительной силы (Relative Strength Index, RSI) - осциллятор, который следует за ценой. Был представлен Уэллсом Уайлдером, который рекомендовал 14 периодов RSI. Это адаптированная версия на основе индикатора, описанного Джоном Эйлерсом в книге Rocket Science for traders. Индикатор использует гомодинный дискриминатор для вычисления доминирующего цикла. Для применения гомодинного дискриминатора необходимо, чтобы реальные и мнимые части были вычислены из синфазных и квадратурных компоненто
FREE

В отличие от классических индикаторов, которые анализируют конкретную валютную пару, этот инструмент анализирует и сравнивает отдельную силу каждой базовой валюты по отношению ко всем остальным основным валютам на рынке. Как работает алгоритм: Индикатор рассчитывает силу 8 основных валют (USD, EUR, GBP, AUD, NZD, CAD, CHF, JPY) через анализ 28 валютных пар. Вместо обычной дельты цены, для каждого бара вычисляется приращение котировки и умножается на тиковый объем. Сила сглаживается за указанны
FREE

Pro Spread Monitor Pro Spread Monitor is a specialized, professional-grade utility designed to provide real-time, low-latency monitoring of market spreads directly on your trading chart. In high-volatility environments, sudden spread spikes can significantly impact your execution quality and the integrity of your stop-loss levels. This indicator provides immediate visual feedback, allowing you to identify "danger zones" instantly and avoid trading during periods of unfavorable liquidity. Key Fea
FREE

A lightweight, non-intrusive on-chart floating dashboard for MetaTrader 4 (MT4) and MetaTrader 5 (MT5) . It provides critical market telemetry and live account status directly inside the chart window with interactive drag-and-drop and minimize functionality. Key Features Interactive Drag & Drop: Click anywhere on the dashboard panel to reposition it seamlessly across the chart window. Automatic boundary detection keeps the panel within the chart frame. Smart Minimize / Expand Toggle ( _ / + ): C
FREE

Русский (Russian) Индикатор временного интервала Wormhole для MetaTrader 5 (MT5) — это не просто очередной инструмент для торговли, это ваше конкурентное преимущество на финансовых рынках. Разработанный как для начинающих, так и для профессиональных трейдеров, Wormhole трансформирует ваш анализ данных и процесс принятия решений, гарантируя, что вы всегда будете на шаг впереди. Почему вам нужен индикатор Wormhole: Перехитрите конкурентов: Возможность одновременно просматривать два временных интер
FREE

Индикатор PipTick Fibo позволяет отображать уровни коррекции Фибоначчи, которые представляют собой значительные уровни поддержки и сопротивления. Диапазон для расчета индикатора может быть выбран из предыдущего дня, недели, месяца, года или заданной пользователем сессии.
Уровни 100 % (High) диапазона предыдущей сессии. 0 % (Low) диапазона предыдущей сессии. 76,4 % диапазона предыдущей сессии. 61,8 % диапазона предыдущей сессии. 50 % диапазона предыдущей сессии. 38,2 % диапазона предыдущей сесси
FREE
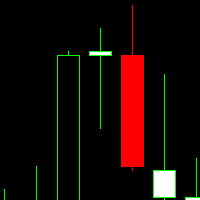
Этот индикатор является индикатором громкости, он меняет цвет свечей в соответствии с определенным количеством тиков, и об этом количестве тиков пользователь может сообщить как о количестве тиков, так и о цвете свечей, этот индикатор работает в любое графическое время или любой актив, при условии, что актив имеет номер тикера для информирования.
Этот индикатор предназначен для облегчения просмотра пользователем при анализе свечей с определенным количеством тиков.
FREE

Tick Push Strength Indicator Catch rapid market momentum before the candle even closes. The Tick Push Strength Indicator tracks live order flow on a raw, tick-by-tick level. While standard indicators suffer from lag, this tool calculates the exact speed and volume pressure behind every micro-movement—giving you an instant visual of whether Bulls or Bears are driving the market. Key Highlights: Zero-Lag Analysis: Measures real-time tick velocity instead of waiting for candle closes. Breakout
FREE

Macro-R Pro Signal — Advanced Trading Signal Indicator Macro-R Pro Signal is a professional trading indicator designed to deliver high-quality BUY and SELL signals with enhanced precision and reduced market noise. By combining Bollinger Bands, RSI, and adaptive volatility filtering , this indicator helps traders identify high-probability reversal points while avoiding unfavorable market conditions.
How the Strategy Works This indicator is built on a mean reversion + momentum confirmation concep
FREE

The RSI everyone uses. Finally READABLE.
RSI is one of the most famous indicators in the world... and one of the most misread. RSI Clarity Zones makes it crystal clear, with colored zones and a plain word.
️ WHAT YOU SEE • The RSI with its colored zones overbought / neutral / oversold • A label stating the state plainly: OVERBOUGHT, OVERSOLD or NEUTRAL • A flag when it crosses the 50 line (the momentum shift) ️
WHO IT'S FOR Beginners who want to understand RSI without memori
FREE

This MQL5 script is a Dynamic Support & Resistance (S/R) Investigator. It functions as a real-time analytical tool that identifies key price levels and mathematically evaluates their "durability" based on historical interactions. Unlike static indicators, it uses a custom Graphical User Interface (GUI) to provide a live dashboard of market structure. 1. Level Detection Logic The indicator scans the most recent InpPeriod (lookback) of bars to identify the absolute highest peak (Resistance) and t
FREE

MYTabogFX Pivot HILO MTF is a clean and powerful multi-timeframe support and resistance indicator designed for price action traders. This tool automatically detects and plots the latest pivot highs and pivot lows from a selected higher timeframe and displays them directly on your current chart. It is built for traders who focus on market structure, liquidity, and precision entries.
Key Features: • Multi-Timeframe Pivot Detection (M5, M15, H1, H4, etc.) • Displays Latest 3 Pivot Highs and 3 Piv
FREE

LotCalc is a minimalist MT5 indicator designed for fast, precise position sizing. Set your risk amount in dollars, click the button, then click your entry and stop-loss levels directly on the chart — the lot size and point distance are calculated and displayed instantly. No clutter, no extra panels, just the one tool you actually need before placing a trade.
FREE
The Kalires Channel Indicator is a technical indicator used to evaluate trend direction and potential trading opportunities. This is a hybrid indicator that combines Kauffman Adaptive Moving Average (KAMA), linear regression and smoothing. The Kalires Channel Indicator consists of two lines: one central and two outer bands. The central line is a smoothed KAMA modified according to the direction of the trend. The outer bars represent two linear regression lines drawn above and below the center l
FREE

Индикатор Trail Stops Point показывает отклонение от текущей цены на определенное расстояние. Написан как дополнительный индикатор к продукту Trail Stops by Custom Indicator , для простого трейлинг стоп-лосса позиции на заданном расстоянии в пунктах.
Параметры индикатора Distance - дистанция трейлинг-стопа в пунктах. Номера буферов: 0 - Support, 1 - Resistance.
FREE
Are you having trouble with too many events in the economic calendar? This reduces to the minimum number you need. You can filter by country code importance any key words and you can receive alerts before the set time of the event. ++++++++++++++ If country code is blank, display available code on the expert tab. You need to turn off the automatic calendar update setting in MT5. Any sound file of .wav format in Sounds directory. The length of keyword characters is limited by MT5.
FREE

The Pivot Indicator is a vital tool for technical analysis used by traders in the financial markets. Designed to assist in identifying potential reversal points or trend changes, this indicator provides valuable insights into key levels in the market. Key features of the Pivot Indicator include: Automatic Calculations: The Pivot Indicator automatically calculates Pivot Point, Support, and Resistance levels based on the previous period's high, low, and close prices. This eliminates the complexity
FREE
Простой индикатор, показывающий цены Bid и Ask. Есть настройки отображения информации и возможность перетаскивать панель. Индикатор используется для наглядного отображения цен покупки и продажи актива.
Входные параметры : Support - Ссылка, на помощь проекту heigth - Высота формы width - Ширина формы size - Размер текста bidcol - Цвет текста bid askcol - Цвет текста
FREE

Spread Engine Nika — Профилирование спреда в реальном времени для MetaTrader 5 Spread Engine Nika — профессиональный индикатор анализа спреда для MetaTrader 5. Он строит статистический профиль спреда для любого символа на основе исторических тиковых данных, отображает текущие условия спреда в контексте и мгновенно показывает, является ли текущий спред нормальным, повышенным или опасным — всё в компактной панели прямо на графике. Разработан для скальперов, внутридневных трейдеров и всех, кто забо
FREE

This indicator is designed based on the Moving Origin indicator
When the moving origin indicator breaks the price, this indicator gives a signal
It is useful for better viewing of signals and analysis on them
Attributes: Can be used in all symbols Can be used in all time frames Too many signals Simple and quick settings Easy way to work
Settings: period: like moving average settings alarmShow: If you want to receive an alert in Metatrader after receiving the signal, enable this setting
alarmS
FREE

Trading Report — лёгкий и чрезвычайно функциональный визуальный индикатор, который в реальном времени показывает основные данные по счёту и торговле — всё в одном элегантном, полностью перетаскиваемом мини-панели с минималистичным дизайном. Основные возможности Обновление на каждый тик (открытая позиция и плавающий P/L в реальном времени) Детали текущей позиции (BUY/SELL + объём + цена входа + плавающий P/L с зелёным/красным цветом) Daily P/L и изменение баланса за день (автоматическая окраска:
FREE

Индикатор делает расчеты по данным, получаемым из из одной из семи(7) скользящих средних и окрашивает график. Простые скользящие средние - это те, у которых всего один важный параметр расчета - период. Сдвиг в индикаторе не используется. Есть настройка shift trick она используется для сглаживания результата расчетов. Можно увидеть изменения, если уменьшить этот параметр до 1(минимальное значение). shift trick должен быть всегда меньше значения периода.
Доступные средние: MA Simple
FREE

Fibonacci Trend Indicator for MT5 Unlock the power of Fibonacci analysis on your MetaTrader 5 charts!
Our Fibonacci Trend Indicator automatically plots dynamic support and resistance levels so you can spot trends, reversals, and breakout opportunities at a glance. Features & Advantages Automatic Fibonacci Levels
Instantly displays seven key Fibonacci retracement levels based on the highest and lowest prices from your chosen lookback period — no manual work required. Dynamic Trend Adaptatio
FREE
Overview
MAM Forecast is an indicator designed to replace guesswork with probabilities. It generates two adaptive levels—UP and DN—along with probabilities that always sum to 100%, giving you a clear idea of which level price is more likely to reach within the chosen horizon. Key Features Displays UP (upper) and DN (lower) adaptive levels calibrated to market volatility. Shows touch probabilities (e.g., 62% vs 38%) for likelihood within the defined horizon. Clean, informative HUD indicates sym
FREE
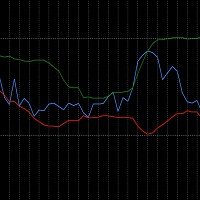
The RSI_BBands is a custom indicator designed to combine the Relative Strength Index (RSI) and Bollinger Bands (BB) for enhanced market analysis. It calculates the RSI using a specified period (default 14) and overlays Bollinger Bands around the RSI values, with adjustable parameters for the Bollinger Bands period and deviation. You can find more free products HERE . If you're looking for a low risk EA , check the Silent Pressure EA .
Key Features: RSI Calculation: The RSI is calcul
FREE
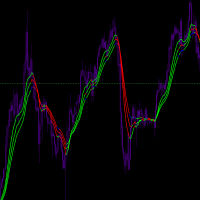
Input Parameters JawPeriod (default=9): Period for the blue line JawShift (default=0): Shift for the blue line TeethPeriod (default=7): Period for the red line TeethShift (default=0): Shift for the red line LipsPeriod (default=5): Period for the green line LipsShift (default=0): Shift for the green line Signals Bullish Conditions When price moves above all lines (all lines turn Lime) Potential buying opportunity Confirms upward momentum Bearish Conditions When price moves below all
FREE

The AlphaQuant Prop Firm Risk Calculator is a professional, institutional-grade utility designed specifically for proprietary trading firm challenges and funded accounts. It eliminates manual guesswork, ensuring every trade you plan aligns perfectly with your firm's strict risk parameters.
KEY FEATURES
️ Universal Prop Firm Compatibility Unlike rigid tools locked to one firm, this calculator features fully customizable input parameters. Easily adjust the Max Daily Loss , Max Total Loss ,
FREE

KTA Candle Timer | Art of Kushal Trading Academy
Never Miss a Candle Close Again!
KTA Candle Timer is a simple, lightweight, and essential tool for every professional trader. It shows the exact time remaining for the current candle to close on your MT5 chart. Perfect for traders who trade on Supply & Demand, Support & Resistance, and Price Action.
Knowing the candle time helps you avoid false entries and take perfect entries at the right time.
KEY FEATURES
- Accurate Countdown: Shows e
FREE

This indicator automatically draws horizontal lines at 00s, 20s, 50s and 80s levels. If you trade ICT concepts and are an ICT Student, then you know that these levels are used as institutional support/resistance levels and/or fibonacci retracement anchor points. Features
Draws horizontal lines at 00, 20, 50 and 80 levels above and below current market price . Choose the amount of levels to show on chart Customizable line colors Recommended for forex currency pairs. Saves time looking for thes
FREE

Moving Average Colored
A very simple indicator, but one that cannot be missed when carrying out your operations. Considered one of the oldest and indispensable indicators to have on your chart now with coloring to make your operations even easier. Configuration Parameters: Time course Averaging Method
Come and see our mql5 signals too https://www.mql5.com/pt/signals/914535?
FREE
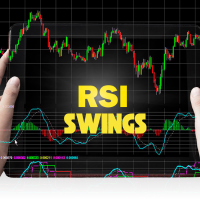
The RSI Swings indicator is a powerful tool designed for MetaTrader 5 (MT5) that combines the principles of the Relative Strength Index (RSI) with high and low price levels to enhance trading decisions. This innovative indicator helps traders identify potential reversal points in the market by analyzing price swings in conjunction with RSI readings. Key Features High-Low Analysis : The RSI Swings indicator focuses on the highs and lows of price movements, allowing traders to pinpoint signifi
FREE
The Pattern ADX RSI indicator is a powerful trading tool designed to enhance decision-making by combining the strengths of three distinct components: price patterns , Relative Strength Index (RSI) , and Average Directional Index (ADX) . This indicator waits for specific pattern signals to emerge in the market and then applies filtering mechanisms based on RSI and ADX readings to confirm the quality of the signal before executing trades. Key Components Pattern Detection : The indicator
FREE
If you like this product, please give it a 5 star rating as a token of appreciation. This indicator projects Higher-Timeframe (HTF) candles onto the current chart and optionally shows their OHLC lines and Fair Value Gaps (FVGs) using ICT 3-candle logic.
Projects multiple higher timeframe candles.
Accurately preserves HTF OHLC on any lower timeframe.
Allows spacing adjustment between projected candles.
Optionally displays OHLC horizontal reference lines.
Automatically detects and draws HTF Fair
FREE

INSTITUTIONAL SESSION PRO - Smart Money Zones PROFESSIONAL SESSION HIGHLIGHTER FOR SERIOUS TRADERS Institutional Session Pro is a FREE, professional-grade indicator designed to help traders identify and visualize key institutional trading sessions, liquidity zones, and high-volume candles with precision and clarity. Perfect for ICT methodology, Smart Money Concepts (SMC), and institutional trading strategies.
KEY FEATURES SMART MONEY SESSIONS Asian Session Range with automatic High/Lo
FREE

The SpreadTracer and TimeLeft indicator is a powerful yet straightforward tool designed for traders who want to keep a close eye on market conditions directly on their chart. This custom indicator provides essential real-time information about the spread and candle time, making it easier to make informed trading decisions. Key Features: Current Spread Monitoring : The indicator constantly displays the current spread of the trading pair, helping you assess the cost of entering or exiting a positi
FREE

If you are Looking Best indicators in Mql5 Market. Check these out!
SSS Scalping Smart Signals MT5 Indicator
Scalping Winning Signals Pro SWS
LTL Long Trend Locator
UZFX The5ers Guardian PRO – The Ultimate Challenge Protection Dashboard for MT5 Pass your The5ers Challenge with confidence using the most advanced account monitoring dashboard designed specifically for The5ers traders . UZFX The5ers Guardian PRO is a professional MT5 indicator that continuously monitors your trading account, ca
FREE

Отмечает ценовые гэпы между закрытием одного бара и открытием следующего. Открытые гэпы рисуются прямоугольниками, которые продлеваются, пока цена их не закроет; закрытые гэпы можно скрыть. Ключевые особенности Рассчитывается на закрытых барах, значения не перерисовываются Работает на любом символе и таймфрейме Все периоды, уровни и цвета можно изменить во входных параметрах Экономно расходует ресурсы благодаря настройке максимального числа баров Объекты удаляются автоматически при удалении инди
FREE

APT – Advance Pivot Trader Indicator for MetaTrader 5 APT – Advance Pivot Trader is a technical indicator developed for MetaTrader 5.
The indicator is based entirely on mathematical and algorithmic calculations and is designed to analyze market structure using pivot-based logic. Professional Trading Tools for Every Trader: https://www.mql5.com/en/users/royalcrescent777/seller
Join our Community & Signal channels: https://www.mql5.com/en/channels/xauusd-signal Timeframe and Risk Guidance The in
FREE

Professional Support and Resistance Indicator This indicator was developed as a market context study and analysis tool , designed to help identify potentially relevant areas on the chart through the combination of price action, volume, and higher-timeframe market structure . The indicator displays two layers of horizontal dashed lines , positioned at areas considered relevant for analysis. This allows traders to observe different support and resistance zones and evaluate their relationship with
FREE
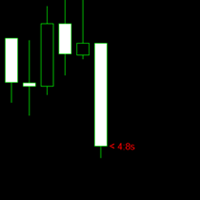
The purpose of the remaining time indicator on the K-line is to assist traders in gaining a deeper understanding of market dynamics and making more precise trading decisions, particularly in the realm of forex and binary short-term trading. The significance of this indicator and its application to various trading strategies will be thoroughly examined below: Enhancement of Trading Timing Accuracy - Precision: By displaying the remaining time of the current K-line cycle, traders can achieve great
FREE

Chart Status Bar MT5 — информационный индикатор, работающий строго в режиме только для чтения. Он отображает основные данные о рынке, соединении и текущем символе непосредственно на графике.
Компактная панель показывает: • торговое расписание брокера и следующую смену сессии; • состояние соединения терминала; • возраст последнего тика; • текущий спред в пунктах и пипсах; • оставшееся время текущей свечи; • серверное время.
Панель DETAILS дополнительно показывает: • торговый режим символа; • м
FREE

This MetaTrader 5 indicator identifies and visually displays the trading hours of major financial markets (Europe, US, and Asia) on the chart. Through customizable colored fills, it marks the trading periods of each market, respecting server times (GMT+2) and excluding weekends. Market names are displayed near the top of the chart in Arial Black font, also with customizable color. The indicator automatically adjusts to the chart scale, maintaining the fill across its entire vertical range.
FREE

This is a simple and lightweight indicator that displays the live spread of the trading instrument on the top left corner of the screen. It is built to be lightweight, performant and react to real time price feed. The spread is the difference between the Ask and Bid price of the trading instrument. This is the cost that the user needs to pay for immediate execution. It is crucial to know and track the spread to be aware of costs involved. In the standard accounts, the spread is the only cost you
FREE

CROW RANGO INDICATOR – Session Range Tool for MT5 Identify key market ranges clearly and automatically, and trade volatility with greater precision. CROW RANGO INDICATOR is designed for traders who focus on market sessions, range breakouts, and impulsive price movements , helping to visualize consolidation zones and potential entry points. MAIN FEATURES Draws up to 3 independent ranges per day
Fully customizable start and end times
Displays key levels: Range High Range Low Midline (eq
FREE

Non-proprietary study of Joe Dinapoli used for overbought/oversold evaluation. Uses of Detrended Oscillator indicator Profit taking. Filter for market entry technics. Stop placement. Part of volatility breakout pattern. Determining major trend changes. Part of Dinapoli Stretch pattern. Inputs lnpPeriod: Perid of moving average Method: Calculation method ********************************************************************************* If you want to know market Overb
FREE
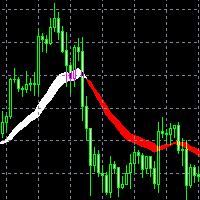
Индикатор Trade in trend предназначен для торговли по тренду. Сила тренда определяется шириной линии. Узкая линия - начало или конец тренда. Широкая линия свидетельствует о высокой силе тренда. Резкая смена ширины линии свидетельствует, с большой вероятностью, об окончании тенденции. Сигналы индикатора Не против покупки: переход с красной линии в белую цена отразилась от белой линии индикатора цена находится выше белой линии индикатора Не против продажи: переход с белой линии в красную цена отр
FREE

Самый чувствительный индикатор, который вы когда-либо видели. . .
POscillator — это чувствительный индикатор, обнаруживающий каждое изменение направления тренда на каждом таймфрейме. Он показывает колебания цен и выявляет восходящие или нисходящие тренды. POscillator строит кривую цены на основе частотных фильтров. Процедура создает две ценовые функции, используя по отдельности высокочастотный и низкочастотный фильтры. Затем он складывает их вместе, чтобы создать сглаженную кривую цены. На з
FREE

*Used by MeditionSeed EA. Meditation is a practice in which an individual uses a technique – such as mindfulness, or focusing the mind on a particular object, thought, or activity – to train attention and awareness, and achieve a mentally clear and emotionally calm and stable state.[1][2][3][4][web 1][web 2] Plant a Meditation Seed to have wonderful future.
FREE
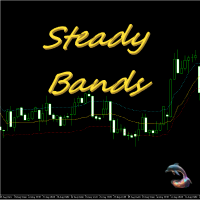
Equidistant bands indicator with calculated moving average, allows you to configure the band size and can be used freely as an entry / exit indicator. Buffer 0 = price, buffer 1 = upper band, buffer 2 = lower band. you can also configure the periods of moving averages used in the calculations and also the shift to previous bars in addition to the price that can CLOSE (default) or OPEN. Excellent for fast daily moving pairs and frequent returns.
FREE

This indicator works by plotting fractals on the chart as arrows that can be used as buy or sell signals. It is a great tool for both new and experienced traders as it provides a clear visual representation of the market and helps traders identify fractals. Although it repaints, it can be used quite effectively in conjunction with other tools to filter trading strategies.
We use this indicator in this way in our Royal Fractals EA, which you can purchase on the MQL5 Market: https://www.mql5.com
FREE
Multi-Timeframe Chart Overlay Indicator
The Timeframe Overlay indicator displays price action for multiple timeframes on a single chart, allowing you to quickly assess different timeframes from a single chart. The advantage is to observe and follow the correlations of price movements in real time to help you find potential trades at a glance.
---- Symbol 1 ----
Symbol = EURUSD
Correlation Inverse = false
Display = true
Ratio
FREE
Monte Carlo simulation is an Indicator that uses a Monte Carlo model to calculate the probability of the price going up or down. If the price has a probability of going up or down more than 90%, the system will enter a trade by doing a back test of gold assets. It was found that it was able to generate a return of more than 20% in a period of 5 months while having a MAX DD of less than 7%.
What is a Monte Carlo simulation?
A Monte Carlo simulation is a model used to predict the probability of
FREE
The indicator displays support and resistance levels based on fibonacci level in multi period Creates lines indicating the latest support and resistance levels.
These lines are updated whenever there is a change in support or resistance levels. Labels are removed if the corresponding conditions are not met.
the period is availble in setting and level fibonacci
FREE

Калькулятор размера позиции в виде индикатора. Для тех случаев, когда использование стандартных советников для расчета риска невозможно. Два режима работы: Маркет и Отложенные ордера. Передвигаете линию SL и получаете необходимый объем позиции согласно настройкам риска. Только показывает информацию, сделки сам не открывает. Для корректной работы следует добавить все Major пары в Market Watch.
FREE

Your balance tells you where you are. It does not tell you how close you came to the edge.
Kingdom Guard is a free, read-only panel that puts the numbers that actually decide survival on your chart:
REAL DRAWDOWN, RIGHT NOW How far your equity sits below its own historical peak - not below your deposit. The single number most traders never watch.
YOUR LOSING STREAK - CURRENT AND WORST EVER When you are four losses deep it matters enormously whether your worst streak was five or fifteen. Know
FREE

️ Aviso de Risco Negociar no mercado financeiro envolve riscos significativos. Esta ferramenta é um auxílio à tomada de decisão e não garante lucros. Opere com responsabilidade e sempre com gerenciamento de risco adequado.
O painel do indicador MACD utiliza como base uma das três possíveis configurações a seguir : 1. Cruzamento das Linhas (MACD x Linha de Sinal); - Sinal de Compra (Alta): Ocorre quando a Linha MACD cruza de baixo para cima a Linha de Sinal. - Sinal de Venda (Baixa): Ocorr
FREE
MetaTrader Маркет позволяет максимально безопасно покупать программы для платформы MetaTrader. Вы можете скачать демо-версии понравившихся роботов и индикаторов прямо из терминала и проверить их в тестере стратегий.
Протестируйте программы в различных режимах перед покупкой для получения максимального представления о продукте и оплатите понравившийся продукт через платежную систему MQL5.community.
Платежная система MQL5.community обеспечивает оплату продавцам, а возможность тестирования программ в различных режимах позволяет покупателям получить максимальное представление о продукте.

Вы упускаете торговые возможности:
- Бесплатные приложения для трейдинга
- 8 000+ сигналов для копирования
- Экономические новости для анализа финансовых рынков
Регистрация
Вход
Вы принимаете политику сайта и условия использования
Если у вас нет учетной записи, зарегистрируйтесь