Simple Ichimoku Scalping - page 6
You are missing trading opportunities:
- Free trading apps
- Over 8,000 signals for copying
- Economic news for exploring financial markets
Registration
Log in
You agree to website policy and terms of use
If you do not have an account, please register
Forum on trading, automated trading systems and testing trading strategies
Simple Ichimoku System - rules for the systems
Sergey Golubev, 2010.03.03 08:37
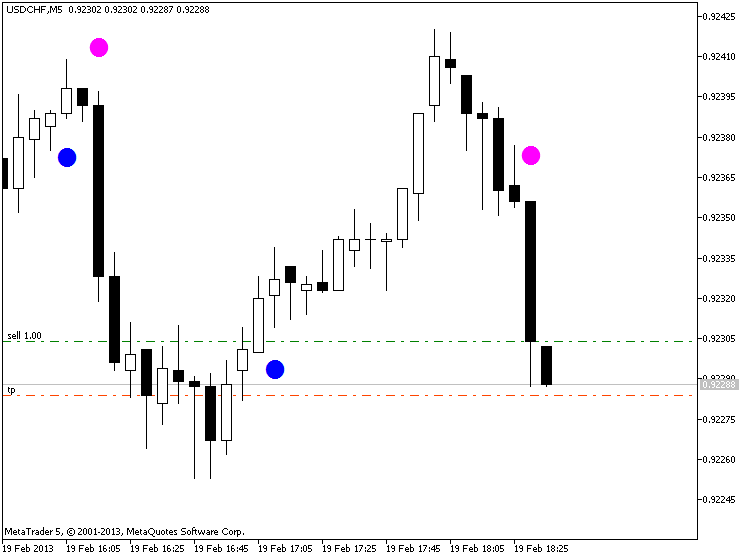
Stop loss and take profit.
Do not trade without stop loss. Especially if trading D1 or H4 timeframe. Stop loss value is the price of nearest dot or arrow (in most of the cases), or nearest support/resistance line (most often - borer of the cloud).
I am using price of dot/arrow for stop loss in most of the cases. Stop loss is not small by value for D1/H4 timeframe as we can see from the charts so we should have initial deposit enough to trade those timeframes.
Stop loss is moved by trailing stop. In my trades in the beginning of this thread I used trailing stop as 30 - 50 pips (4 digit pips). But in reality - it should be not less then 50. Stop loss should not be moved by trailing stop in aggressive way, especially on D1 timeframe. Let the profit run.
So, the trade may be closed by stop loss (moved by trailing stop). Or we can close the trade if price will touch/cross some support/resistance line (usually - border of the cloud) if we do not want to trade inside the cloud in ranging unpredictable market condition.
Classical Ichimoku indicator's stop los and take profit values suggested by the author of this indicator (Ichimoku Sanjin):
- if we are trading on the direction of the cloud so take profit values are Senkou Span A and Senkou Span B lines. Stop loss in case case can be somewhere outside the trend, or we can use Parabolic SAR indicator (Ichimoku Sanjin suggested Parabolic SAR indicator for stop loss in this case).
- if we are trading from the cloud so our stop loss should be somewhere near Kijun-sen line, next stop - Senkou Span A and Senkou Span B lines (borders of the cloud). Take profit in this case: Kijun-sen line reversal, or - how suggested the author of Ichimoku indicator - fix take profit value.
Generally - we can have 1 or 2 signals per 2 weeks per pair. And generally - we can have 100 - 300 pip (4 digit pips) per pair in a month (for D1 timeframe). It is just an averaging stats decribing by some traders.
Trading inside the cloud is one of the good trading technique to use this indicator. In this case the borders of the cloud (Senkou Span A and Senkou Span B) are support/resistance lines and some guiding lines for stop loss and take profit values (should be behind those lines), and we are trading on the direction of Tenkan-sen line inside the cloud in the ame way as we are trading inside the channel. Some traders are having the avegaring profit days as 40 pips (4 digit pips) just using this technique only.
But we all understand that in this case - the cloud should be big enough to indicate the ranging market condition. We can not use this technique in case of small cloud (flat).
Some traders stimated some stats for stop loss and take profit values for Ichimoku systems. We can use it for this system as some recommendations for example:
Stop loss (4 digit price pips):
- For M5 ... H1: some traders are using stop loss = 15 pips for all the pairs in any situation. Not for H4, D1 and W1.
- For H1 (in case we are trading on H1 timeframe):15 - 30 pips for EURUSD; 20 - 40 pips for GBPUSD; 35 - 50 pip for USDJPY; 30 - 80 for USDCHF.
- for H4, D1 and W1 timeframes: near the most strongest indicator's line or signal. For D1 it can be 100 or 200 pips.
- for H4, D1 and W1 timeframes: behind the cloud.
- for any timeframe: dot or arrow of PriceChannel_Signal indicator.
Thanks once more for sharing information with us. Do you perhaps use that on one of your live account? if yes, is it that good as the Demo result you have share with us?
more to follow ...
Forum on trading, automated trading systems and testing trading strategies
Market Condition Evaluation based on standard indicators in Metatrader 5
Sergey Golubev, 2013.09.01 21:06
This my post? red dotted lines are for possible sell stop trade, blue dotted lines are are possible buy stop ...
=============
Anyway - I just copied some latest summary from this thread :
=============
Market Condition Evaluation
story/thread was started from here/different thread
================================
The beginning:
================================
Market condition
================================
3 Stoch MaFibo trading system for M5 and M1 timeframe
================================
PriceChannel ColorPar Ichi system.
================================
MaksiGen trading system
================================
Merrill's patterns are on this page.
================================
Divergence - how to use, explanation and where to read about.
================================
Scalp_net trading system
================================
MTF systems
more to follow ...
================================
MA Channel Stochastic system is here.
================================
Ichimoku
The beginning
After
Who Can Trade a Scalping Strategy? (based on dailyfx article)
The term scalping elicits different preconceived connotations to different traders. Despite what you may already think, scalping can be a viable short term trading methodology for anyone. So today we will look at what exactly is scalping, and who can be successful with a scalping based strategy.
What is a Scalper?
So you’re interested in scalping? A Forex scalper is considered anyone that takes one or more positions throughout a trading day. Normally these positions are based around short term market fluctuations as price gathers momentum during a particular trading session. Scalpers look to enter the market, and preferably exit positions prior to the market close.
Normally scalpers employ technical trading strategies utilizing short term support and resistance levels for entries. While normally fundamentals don’t factor into a scalpers trading plan, it is important to keep an eye on the economic calendar to see when news may increase the market’s volatility.
High Frequency Trading
There is a strong misconception that all scalpers are high frequency traders. So how many trades a day does it take to be considered a scalper? Even though high frequency traders ARE scalpers, in order for you to qualify as a scalper you only need to take 1 position a day! That is one of the benefits of scalping. You can trade as much or as little as you like within a giving trading period.
This also falls in line with one of the benefits of the Forex market. Due to the 24Hr trading structure of Forex, you can scalp the market at your convenience. Take advantage of the quiet Asia trading session, or the volatile New York – London overlap. Trade as much or as little as you like. As a scalper the choice is ultimately yours to make!
Risks
There are always risks associated with trading. Whether you are a short term, long term, or any kind of trader in between any time you open a position you should work on managing your risk. This is especially true for scalpers. If the market moves against you suddenly due to news or another factor, you need to have a plan of action for limiting your losses.
There are other misconceptions that scalpers are very aggressive traders prone to large losses. One way to help combat this is to make scalping a mechanical process. This means that all of your decisions regarding entries, exits, trade size, leverage and other factors should be written down and finalized before approaching the charts. Most scalpers look to risk 1% or even less of their account balance on any one position taken!
Who can Scalp?
So this brings us to the final question. Who can be a scalper? The answer is anyone with the dedication to develop a trading strategy and the time to implement that strategy on any given trading day.
=================
Trading examples
Metaquotes demo
GoMarkets broker, initial deposit is 1,000
Alpari UK broker initial deposit is 1,000
RoboForex broker initial deposit is 1,000
Good indicator was created:
TrendStrength Oma Channel_MTF_Alerts indicator is on this post. It is very advanced indicator having the following parameters: OmaSpeed, use OmaAdaptive as true or false, ShowChannel and ShowZigZag as true or false, Interpolate, buy arrows and sell arrows, and alerts messages/sounds/emails and more.
May be usefull for this system (I will try it later).
Forum on trading, automated trading systems and testing trading strategies
ASCTrend system
Sergey Golubev, 2018.11.30 16:06
This indicator can be used instead of TrendStrength indicator for Ichimoku scalping (and for any Ichimoku trading systems), and for AscTrend system as well - TrendStrength onchart indicator.
-----------
TrendStrength EMA variation - indicator for MetaTrader 5
"Trend strength" version of EMA variation (originally published here : EMA variation along with detailed explanation). In these cases trend strength is used more like a filter than anything else, but the original calculation is kept, and the logic is the original logic of the "trend strength" family of indicators.
-----------
This indicator is having interesting explanation which can be found here (the explanation is related to EMA variation part of the indicator, because TrendStrength part of this indicator is working as a normal TrendStrength (means: as a filter to estimate the market condition for possible buy/sell trades based on the 'EMA variation color change')
Scalping the forex market
All the ins and outs on scalping the Forex market. May Chris dives into the world of Scalping where he explains in great detail how this style of trading can be accomplished in the Forex market. This live webinar not only clarifies how a trader can scalp but also provides every Forex trader with a great guidance and extra tips.
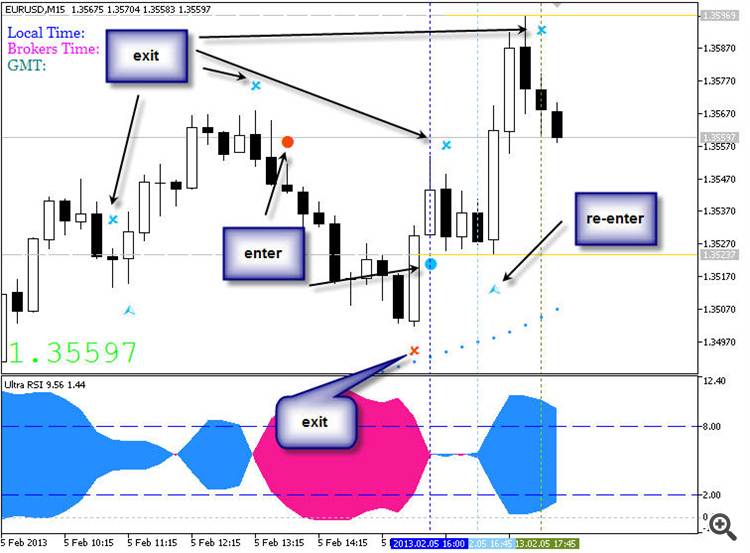
Hi @Sergey Golubev, thanks for this thread. I have installed the version which you have provided 2010 and today I see that there seems to be an updated versions.
Currently I have this version in used. See screenshot. Is this still valid or is there something which has been improved more as I could see in one of the latest screenshot which also show you when you should close your order.
Regards Marco
Forum on trading, automated trading systems and testing trading strategies
Press review
Sergey Golubev, 2019.11.11 07:55
Trading with the Ichimoku Kinko Hyo (based on the article)
==========
Ichimoku
The beginning
After
============