Market Condition Evaluation based on standard indicators in Metatrader 5 - page 12
You are missing trading opportunities:
- Free trading apps
- Over 8,000 signals for copying
- Economic news for exploring financial markets
Registration
Log in
You agree to website policy and terms of use
If you do not have an account, please register
Update: breakout for EURUSD is started but for USDCHF is finishing. Because ... if we are talking about "relationship" between EURUSD and USDCHF so one pair is always leading the other pair. It means: one pair is started the movement as the first one, and the other pair is lagging (starting in opposite movement later). That is why we always should watch the other major pairs even if we are trading just one pair only.
By the way, USDCHF is leading pair in most of the cases in EURUSD/USDCHF relationship.
Update:
Update:
Why false breakout? Look at the image (this is Merrill's patterns for downtrend):
and look at GBPUSD M1 chart for now:
So, the pattern on GBPUSD chart is same as M3 Merrill, right? And the evolution of this M3 pattern was on the following way: M8 - M4 - M3. That is why it was false breakout.
Why false breakout? Look at the image (this is Merrill's patterns for downtrend):
and look at GBPUSD M1 chart for now:
So, the pattern on GBPUSD chart is same as M3 Merrill, right? And the evolution of this M3 pattern was on the following way: M8 - M4 - M3. That is why it was false breakout.
Merrill's patterns for uptrend:
and it looks like W10 with evolution as W4 - W5 - W10:
==============
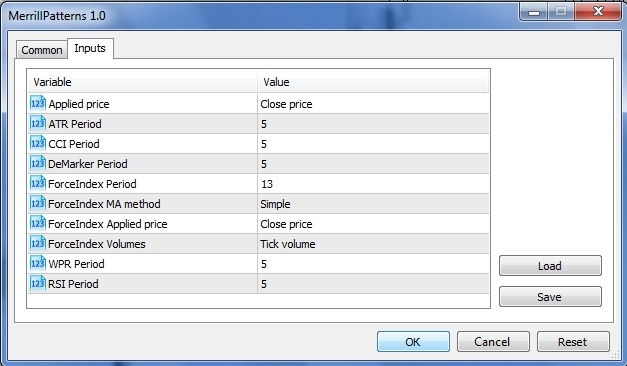
Merrill patterns - the article
ContentsBreakdown for GBPUSD is going on since this GMT morning.
By the way, I will not post the levels for breakout/breakdown for today because there is NFP today (high impacted forex news event) at 13:30 GMT time so today is not good day to post the levels sorry.
Next question. There is some line on the chart which can divide the chart onto buy place/space (bullish as a primary) and sell place (bearish as a primary)? Just one line: if price is above this line so it is bullish, if below - bearish? Yes, it is Senkou Span B line of Ichimoku indicator (one of the border of the cloud).
Just want to remind about what I am doing on this thread:
I am testing Maksigen indicator within this thread (starting from page #7 here Market Condition Evaluation based on standard indicators in Metatrader 5 ) by the following way: I am evaluating market condition using Absolute Strengh indicator on H4/D1 timeframe to select the pairs to trade and direction to open the trades for those pairs for the current day, and trading those pairs using MaksiGen_Range_Move MTF indicator on M1 timeframe.
And just to remind:
1. Trend following
1.1. Primary trend
- Uptrend (bullish)
- Downtrend (bearish)
1.2. Secondary trend.
- Correction
- Bear Market Rally
- Flat (non-trading)
- Ranging
2. Overbough/oversold ('top-and-bottom')
3. Breakout
As far as I know - Igorad is starting to create indicator which can evaluate all market condition described above using one chart for that. I think - he may upload it here if ready. Just for information.
So, I took this few pips :)