Press review - page 572


Weekly GBP/USD Outlook: 2017, November 12 - November 19 (based on the article)

GBP/USD was looking for a new direction after that dovish hike from the BoE and as Brexit talks are trying to get out of the ditch. The upcoming week features three top-tier publications: inflation, jobs, and retail sales. 


  1. Inflation report: Tuesday, 9:30. The weakness of the British pound following the EU Referendum last year is the main contributor to higher prices.
  2. Jobs report: Wednesday, 9:30. Weak wages will probably take center-stage once again.
  3. CB Leading Index: Wednesday, 14:30. A drop of 0.1% was reported in August. We will now receive the data for September.
  4. Retail sales: Thursday, 9:30. After three upbeat months, the volume of sales slipped by 0.8% in September, causing a slide in the pound. Are consumers becoming more sensitive to higher prices? The updated data for October also feeds into Q4 GDP.
 
Nvidia Is Still A Better Buy (based on the article)

Shares price is on bullish breakout since the August 2015: the price is breaking resistance level at 218.64 to above for the bullish trend to be continuing.


  • "Nvidia’s stock is still a better buy than AMD, though its stock is up 140% over the last twelve months compared to 32% of AMD. There are a couple of reasons for that. One of them is that Nvidia’s operation margins continue to swell to 31.46%, up from 29.90% six months ago. Meanwhile, AMD’s operating margins continue to be in negative territory, hovering in the 6.50-8.00% range—see table. Another reason is revenue growth. Nvidia’s revenues grew 56.0% in the most recent quarter, while AMD’s by 19%."
  • "While past performance isn’t a guarantee for future performance, as the old Wall Street proverb goes, being smart is what makes the difference between winning and losing technology companies in the long-term."

==========

The chart was made on D1 timeframe with Ichimoku market condition setup (MT5) from this post (free to download for indicators and template) as well as the following indicator from CodeBase:


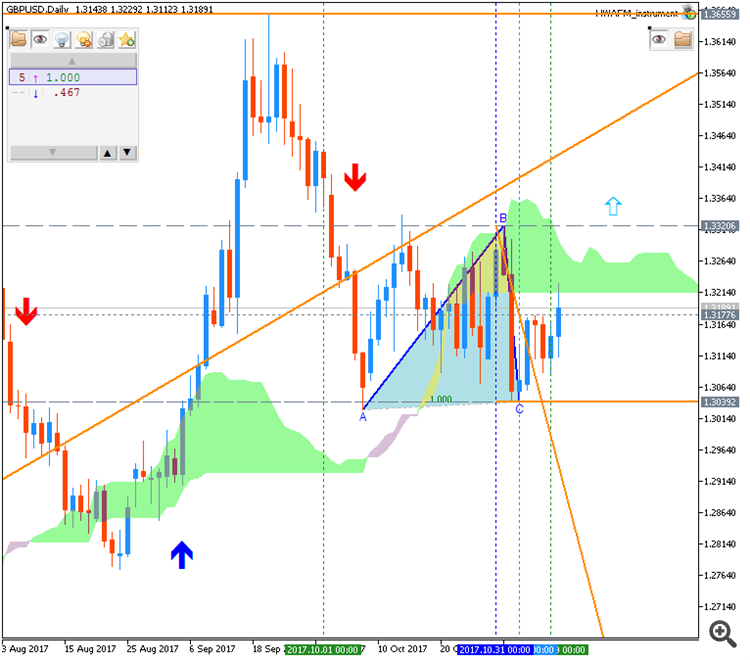
GBP/USD - bullish ranging within narrow levels for direction (based on the article)

Daily price is above 200 SMA to be on ranging near and below 55 SMA: the price is within 1.3039/1.3229 s/r levels for the bullish trend to be resumed or for the correction to the bearish reversal to be started.


  • "Since bottoming on October 6, GBP/USD has gone into a range with a small handful of powerful days, but nothing which led to follow-through. During this period one-week and one-month implied volatility declined to 6.32% and 6.72%, respectively. Since last week it has been on the rise, with current levels of 8.75% (1-wk) and 7.99% (1-mo). Not only have expectations for price movement in cable risen strongly in recent sessions, it also tops the board of major USD-pairs."
  • "The projected one-week one-standard deviation range is 12916-13232. Let’s take a look at how these levels align with the current technical landscape. First off, the range is running on borrowed time, which means a break is likely coming soon. With cable not finding much lift around a pair of trend-lines (March-current, lower parallel – April-current) and the October low it is becoming increasingly likely the break will come to the downside. Should we see a sell-off commence it would also be in-line with the trend off the 9/20 spike-day high which came at a confluence of the gap following ‘Brexit’ and a trend-line running down from July 2014 over the ‘Brexit’ day high."
  • "The projected one-week low is 12916, which isn’t far from the 200-day MA currently at 12872. But the next level of price support doesn’t arrive until under 12800. With that in mind, a breakdown may lead to price expansion and even higher levels of implied volatility. On the top-side, coupling trend direction prior to the multi-week range with overhead levels and the trend-line off the September high, it looks less likely we will see a strong move higher in cable."

==========

The chart was made on MT5 with MA Channel Stochastic system uploaded on this post, and using standard indicators from Metatrader 5 together with following indicators:


USD/CNH Intra-Day Fundamentals: China Industrial Production and range price movement 

2017-11-14 02:00 GMT | [CNY - Industrial Production]

if actual > forecast (or previous one) = good for currency (for CNY in our case)

[CNY - Industrial Production] = Change in the total inflation-adjusted value of output produced by manufacturers, mines, and utilities. 

==========

From ecns article :

  • "China's fixed-asset investment (FAI) grew 7.3 percent year on year to in the first ten months of this year, reaching 51.78 trillion yuan (7.8 trillion U.S. dollars), down from 7.5 percent for the January-September period, according to official data. In the same period, China's private fixed-asset investment increased 5.8 percent year on year to 31.37 trillion yuan, NBS said, noting the growth rate was slightly lower than the 6-percent increase for the first nine months."
  • "NBS also post that China's industrial value-added output expanded 6.2 percent year on year in October, slowing from a 6.6-percent growth in September."

==========

USD/CNH M5: range price movement by China Industrial Production news event 


==========

The chart was made on MT5 with MA Channel Stochastic system uploaded on this post, and using standard indicators from Metatrader 5 together with following indicators:


Bitcoin Gold had recovered modestly (based on the article)


  • "Bitcoin Gold, a fork of Bitcoin that aims to democratize mining, has thus far failed to win over investors, its futures dropping to an all-time low the day after its software client went live."
  • "Futures for this altcoin, which is very similar to Bitcoin but allows a wider range of processors to be involved with mining, fell to as little as $218.34 today on CoinMarketCap, a more than 50% decline from the all-time high of $509.81 they reached on November 11."
  • "At the time of report, Bitcoin Gold futures had recovered modestly, trading at $268.61, additional CoinMarketCap figures show."


GBP/USD Intra-Day Fundamentals: U.K. Consumer Price Index and range price movement 

2017-11-14 09:30 GMT | [GBP - CPI]

  • past data is 3.0%
  • forecast data is 3.1%
  • actual data is 3.0% according to the latest press release

if actual > forecast (or previous one) = good for currency (for GBP in our case)

[GBP - CPI] = Change in the price of goods and services purchased by consumers. 

==========

From official report :

  • "The Consumer Prices Index (CPI) 12-month rate was 3.0% in October 2017, unchanged from September 2017."
  • "The inflation rate for food and non-alcoholic beverages continued to increase to 4.1%, the highest since September 2013."

==========

GBP/USD M5: range price movement by U.K. Consumer Price Index news event 


==========

The chart was made on MT5 with MACD Scalping system uploaded on this post and this post, and using standard indicators from Metatrader 5 together with following indicators:


AUD/USD Intra-Day Fundamentals: Australian Labour Price Index and range price movement 

2017-11-15 00:30 GMT | [AUD - Wage Price Index]

if actual > forecast (or previous one) = good for currency (for AUD in our case)

[AUD - Wage Price Index] = Change in the price businesses and the government pay for labor, excluding bonuses. 

==========

From official report :

  • "The trend and seasonally adjusted indexes for Australia both rose 0.5% in the September quarter 2017. This continued the moderate rate of wage growth recorded by the series over the last two years."
  • "The rises in indexes at industry level (in original terms) ranged from 0.2% for Mining to 1.8% for Accommodation and food services."

==========

AUD/USD M5: range price movement by Australian Labour Price Index news event 


==========

The chart was made on H4 timeframe with standard indicators of Metatrader 4 except the following indicator (free to download):

6345.0 - Wage Price Index, Australia, Sep 2017
  • www.abs.gov.au
SEPTEMBER KEY FIGURES SEPTEMBER KEY POINTS TOTAL HOURLY RATES OF PAY EXCLUDING BONUSES QUARTERLY CHANGE (JUN QTR 2017 TO SEP QTR 2017) The trend and seasonally adjusted indexes for Australia both rose 0.5% in the September quarter 2017. This continued the moderate rate of wage growth recorded by the series over the last two years. The...
 

USD/JPY - daily bullish ranging; 114.73 is the key (based on the article)

Daily price is above 200 peiod SMA in the primary bullish area of the chart: the price is on ranging within 114.73 resistance level for the bullish trend to be resumed and 113.08 support level for the secondary correction to be started.

By the way, if the price breaks 111.89 support level to below on daily close bar so the bearish reversal of the daily price movement will be started with 111.02 daily target to re-enter.


  • "The Bank of Japan is committed to “powerful monetary easing” in the oft-spoken words of its Governor, Haruhiko Kuroda, until annualized consumer price inflation tops 2%. Well, it’s now at 0.7% and holding so that easing could yet be with us for years. Meanwhile the US Federal Reserve has raised its own interest rates from their post-crisis depths. It’s still expected to do so once again in December and to continue the process in 2018 if the economics permit, albeit gradually."
  • "This thesis has seenUSD/JPYrise very sharply since early September but, tellingly, the Dollar remains unable to convincingly top the last two notable highs."

==========

The chart was made on D1 timeframe with standard indicators of Metatrader 4 except the following indicators (free to download):

DailyFX Home
DailyFX Home
  • www.dailyfx.com
The Bank of Japan is committed to “powerful monetary easing” in the oft-spoken words of its Governor, Haruhiko Kuroda, until annualized consumer price inflation tops 2%. Well, it’s now at 0.7% and holding so could yet be with us for years. Meanwhile the US Federal Reserve has raised its own interest rates from their post-crisis depths. It’s...
 

Intra-Day Fundamentals - EUR/USD, NZD/USD and GOLD: U.S. Advance Retail Sales

2017-11-15 13:30 GMT | [USD - Retail Sales]

if actual > forecast (or previous one) = good for currency (for USD in our case)

[USD - Retail Sales] = Change in the total value of sales at the retail level.

==========

From cnbc article :

  • "U.S. retail sales unexpectedly rose in October as an increase in purchases of motor vehicles and a range of other goods offset a decline in demand for building materials, suggesting consumer spending remained fairly strong early in the fourth quarter."
  • "The Commerce Department said on Wednesday retail sales increased 0.2 percent last month. Data for September was revised to show sales jumping 1.9 percent rather than the previously reported 1.6 percent advance."
  • "Retail sales increased 4.6 percent on an annual basis."

==========

EUR/USD M5: range price movement by U.S. Retail Sales news events


==========

NZD/USD M5: range price movement by U.S. Retail Sales news events


==========

XAU/USD M5: rrange price movement by U.S. Retail Sales news events


============

Chart was made on MT5 with BrainTrading system (MT5) from this thread (free to download) as well as the following indicators from CodeBase:

All about BrainTrading system for MT5:


AUD/USD Intra-Day FundamentalsAustralian Employment Change and range price movement 

2017-11-16 00:30 GMT | [AUD - Employment Change]

  • past data is 26.6K
  • forecast data is 17.8K
  • actual data is 3.7K according to the latest press release

if actual > forecast (or previous one) = good for currency (for AUD in our case)

[CNY - CPI] = Change in the number of employed people during the previous month. 

==========

From official report :

  • "Employment increased 3,700 to 12,297,100. Full-time employment increased 24,300 to 8,425,400 and part-time employment decreased 20,700 to 3,871,700."
  • "Unemployment rate decreased 0.1 pts to 5.4%."

==========

AUD/USD M5: range price movement by Australian Employment Change news event 


==========

Chart was made on MT5 with Brainwashing system/AscTrend system (MT5) from this thread (free to download) together with following indicators:

Same system for MT4:

  1. Brainwashing. Trades: manually and using EAs (MT4)
  2. Brainwashing EAs - the thread (MT4)
  3. Brainwashing: system setup for trading manually and for EAs (MT4) - the thread 
  4. Brainwashing: system development (MT4) - the thread
6202.0 - Labour Force, Australia, Oct 2017
  • www.abs.gov.au
OCTOBER KEY FIGURES OCTOBER KEY POINTS TREND ESTIMATES (MONTHLY CHANGE) Employment increased 20,000 to 12,301,200. Unemployment decreased 3,000 to 709,400. Unemployment rate remained steady at 5.5%. Participation rate remained steady at 65.2%. Monthly hours worked in all jobs increased 3.5 million hours (0.2%) to 1,720.3 million hours...
Reason: