Join our fan page
- Views:
- 14912
- Rating:
- Published:
- Updated:
-
Need a robot or indicator based on this code? Order it on Freelance Go to Freelance
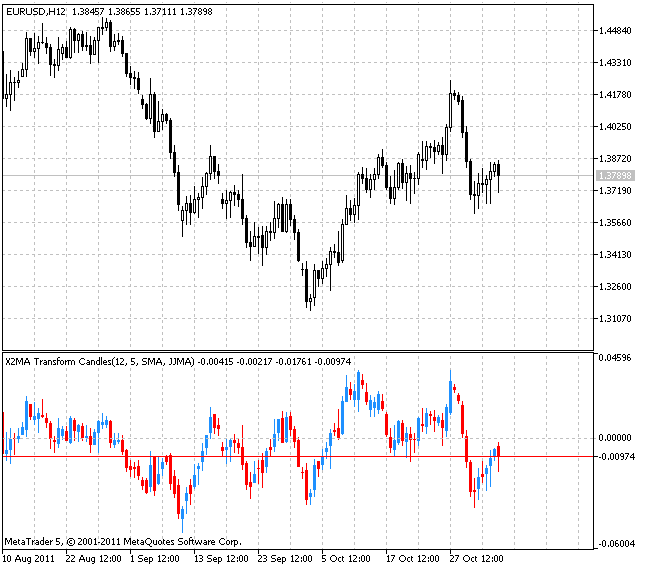
The indicator transfers the price data to the new coordinates system associated with X2MA indicator values.
The distance from High, Low, Open and Close source candlestick to X2MA moving average is used in the indicator for candlesticks parameters.
As a result, we have a candlestick chart altered by X2MA transformation allowing to perform all elements of technical analysis like a common chart. Appropriate custom and technical indicators can be applied to it. In fact, the indicator zero level is X2MA moving average location.
Smoothing algorithms can be selected out of ten possible versions:
- SMA - simple moving average;
- EMA - exponential moving average;
- SMMA - smoothed moving average;
- LWMA - linear weighted moving average;
- JJMA - JMA adaptive average;
- JurX - ultralinear smoothing;
- ParMA - parabolic smoothing;
- T3 - Tillson's multiple exponential smoothing;
- VIDYA - smoothing with the use of Tushar Chande's algorithm;
- AMA - smoothing with the use of Perry Kaufman's algorithm.
It should be noted that Phase1 and Phase2 parameters have completely different meaning for different smoothing algorithms. For JMA it is an external Phase variable changing from -100 to +100. For T3 it is a smoothing ratio multiplied by 100 for better visualization, for VIDYA it is a CMO oscillator period and for AMA it is a slow EMA period. In other algorithms these parameters do not affect smoothing. For AMA fast EMA period is a fixed value and is equal to 2 by default. The ratio of raising to the power is also equal to 2 for AMA.
The indicator uses SmoothAlgorithms.mqh library classes (must be copied to the terminal_data_folder\MQL5\Include). The use of the classes was thoroughly described in the article "Averaging Price Series for Intermediate Calculations Without Using Additional Buffers".

Input parameters:
//+-----------------------------------+
//|  Indicator input parameters       |
//+-----------------------------------+
input Smooth_Method MA_Method1=MODE_SMA;   // First smoothing averaging method
input int Length1=12;                      // First smoothing depth
input int Phase1=15;                       // First smoothing parameter
input Smooth_Method MA_Method2=MODE_JJMA; // Second smoothing averaging method
input int Length2= 5;                      // Second smoothing depth
input int Phase2=15;                       // Second smoothing parameter
input Applied_price_ IPC=PRICE_CLOSE;       // Applied price
input int Shift=0;                         // Horizontal shift of the indicator in bars
input int PriceShift=0;                    // Vertical shift of the indicator in points
input color BidColor=Red;                  // Bid line color
input ENUM_LINE_STYLE BidStyle=STYLE_SOLID;  // Bid line style
Translated from Russian by MetaQuotes Ltd.
Original code: https://www.mql5.com/ru/code/642
 Elder Impulse System
The candlesticks are colored in red, green and blue colors depending on a trend direction (Moving Average and MACD overall values).
 Percentage Crossover Channel
The channel based on the price percentage deviation from the previous value of the channel middle line.
 IncOsMAOnArray
COsMAOnArray class is designed for calculation of OsMA (Moving Average of Oscillator) values on indicator buffers. The example of use of the class is provided.
 VGridLine Intraday X6
Vertical time grid with six hours step.