
Overview | Castlist | Spotlight | Backstage
Spotlight Metrics Manual — Read Development and Compare Reliably
Spotlight shows how a metric changes after every trade. Use the chart for the path and the lower summary for result, efficiency, evidence speed and exposure.
Result of this guide
You will answer one trader question with the appropriate chart metric, inspect individual Trade Lines, interpret the lower metrics and use Align without losing sight of the absolute result.
Before you begin
Complete the first-comparison guide and keep one validated baseline visible. Record source, period, Magic#, costs and trade count. Add only one comparison until the baseline is understood.
Choose the metric by the question
| Metric | Question | Caution |
|---|---|---|
| PF | Does cumulative profit/loss balance change? | Sensitive with few trades |
| Winrate | Is the winning share shifting? | Needs payout context |
| Pay-out ratio | How do average win and loss compare? | Read with Winrate and PF |
| Cumm profit | Where does net result build or decline? | Sizing can differ by source |
| Drawdown | How deep, repeated and recoverable is decline? | Read depth and duration |
| Capital | How does available capital develop? | Depends on source and capital assumption |
| Margin | How does calculated margin develop? | Not proven historical broker margin |
Trade Lines reveal whether movement comes from an outlier or a sequence.
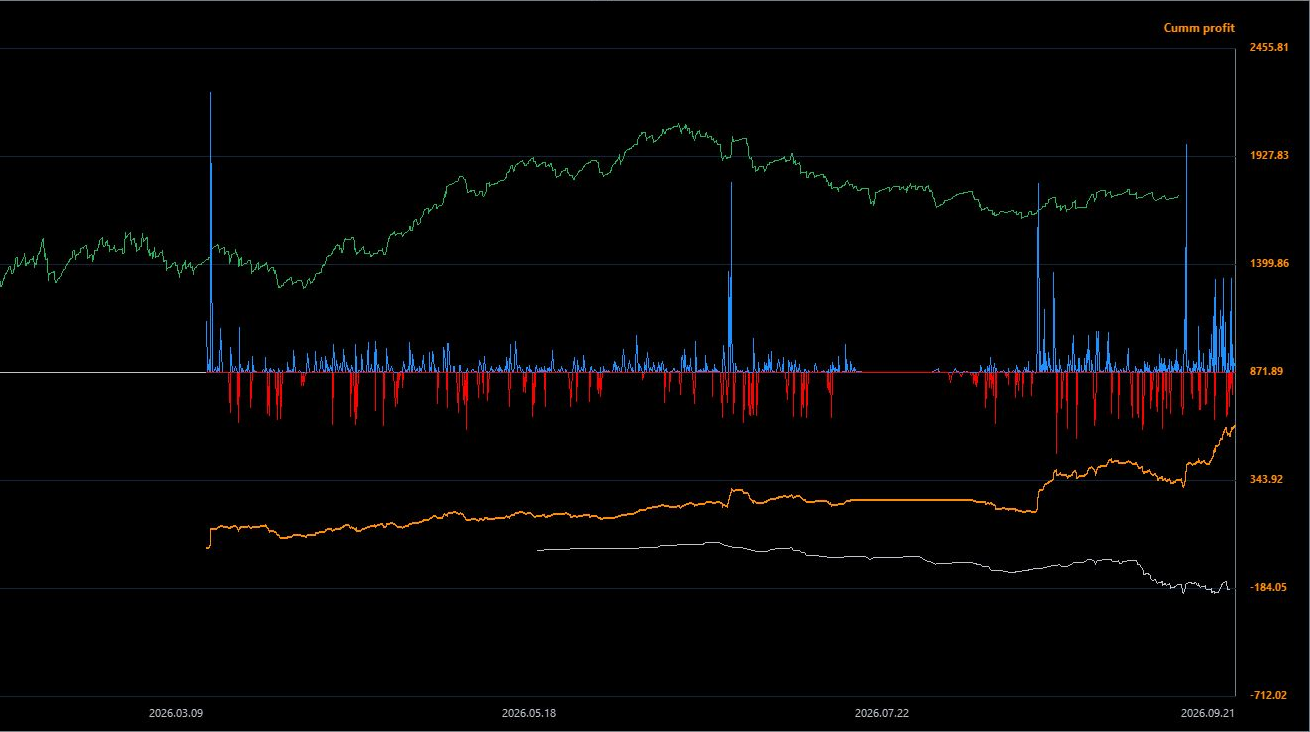
Trade Lines expose individual positive and negative outcomes behind the cumulative development.
Lower decision summary
The lower strip is not decoration. It lets the trader connect the shape of the chart to result, efficiency, evidence speed and capital use.
| Value | Meaning | Trader use |
|---|---|---|
| Gross profit / loss | Positive and negative flows before netting | See whether a result depends on gain, loss or both |
| Result | Net result of selection and period | Anchor the comparison in financial outcome |
| AVG trade | Result per trade | Judge whether an edge has room for friction |
| Return/trade | Result relative to total order value | Compare efficiency beyond nominal money |
| Trades/day / year | Speed at which evidence accumulates | Estimate how quickly a review can become meaningful |
| Annualized result / % | Linear scenario, not prediction or compounding | Standardise pace without calling it a forecast |
| Exposure time | Share of measured period with open exposure | Relate return to time at risk |

The lower summary connects result, efficiency, evidence speed and exposure.
Useful combinations include Result + AVG trade + Trades/year, Annualized result + Exposure, and Gross profit + Gross loss + Result.
Read one comparison step by step
- State the question before choosing the metric.
- Select the matching metric and keep both sources on the same period and cost treatment.
- Enable Trade Lines and identify whether a move comes from one outlier or a sequence.
- Read the lower summary from flows to net Result, then AVG trade, Return/trade, evidence speed and Exposure.
- Record first/latest trade, count and source freshness.
- Only then use Align for a deliberate anchor; return afterward to the absolute view.
The comparison is complete only when you can explain both what changed and which assumptions—capital, leverage, costs, sizing, period and matching tolerance—could affect that observation.
Reliable comparison checklist
- Confirm Magic#, EA version, market and timeframe.
- Check first/latest trade, export time and count for every source.
- Record period, costs, metric, tolerance, Align and Impact state.
- Record capital, leverage, contract and sizing assumptions.
- Read absolute lines before Align.
- State what the comparison observes and what it cannot prove.
Align correctly
Use Align for a meaningful anchor such as first Live trade, new EA version or start of an investigated deviation.
- Enable the intended lines.
- Click Align ; it becomes Select point .
- Click the deliberate real trade point.
- Verify dataset and date.
- Use Esc to cancel uncertainty.
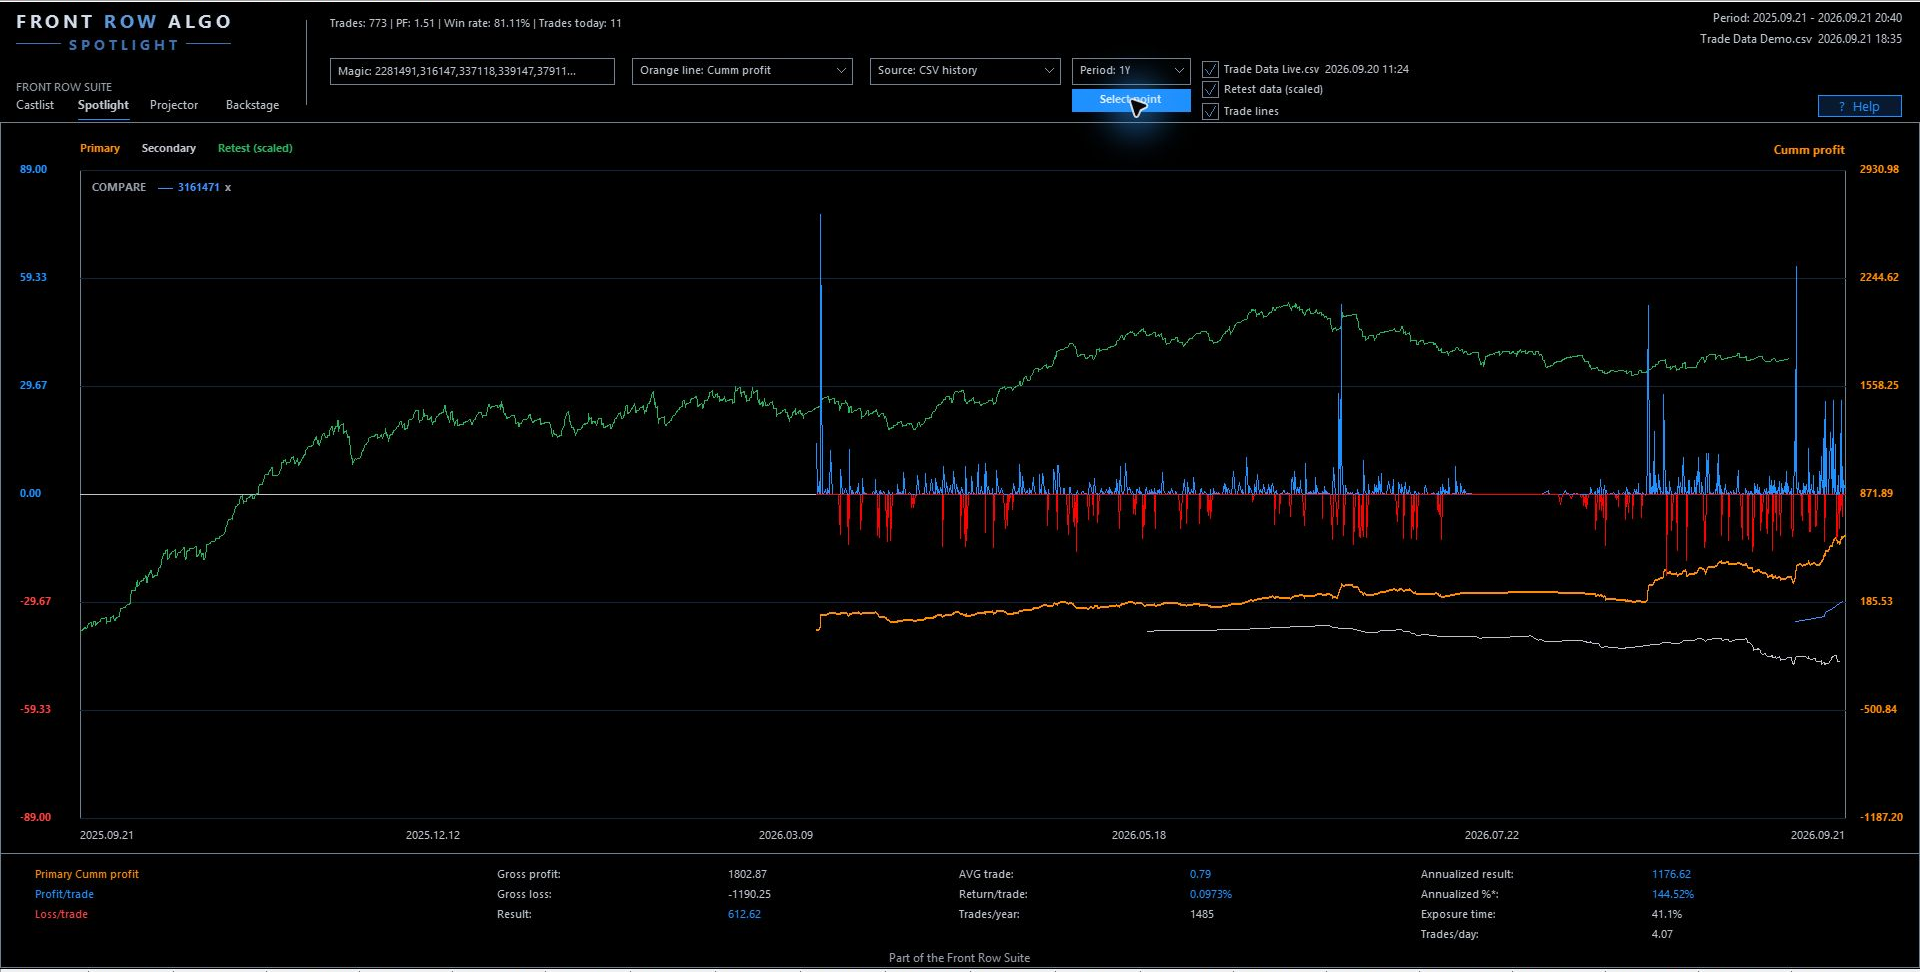
Align waits for a deliberate real trade point chosen by the trader.
Align rebases development; it does not add trades, equalise samples, correct sizing/costs or prove causality. Return to absolute view afterward.
Capital, Margin and leverage
AccountCapitalOverride > 0 supplies the reference capital; otherwise balance and then equity are used. Margin starts from:
Notional = volume × price × contract size
Margin = notional / leverage
The default MarginLeverageOverride = 2.0 provides a reproducible analytical comparison. It does not reconstruct what every broker historically reserved. SQX Retest does not reconstruct historical Capital or Margin.
Stop before concluding when
Identity is ambiguous, a source is stale, trades are missing, costs differ without explanation, counts are inexplicable, or Align is active without a known anchor.
Settings that influence the metrics
IncludeSwapComm affects Result and derived metrics. ShowTradeLines exposes individual trades. TradeMatchToleranceMinutes affects synchronisation. AutoScalePF and MaxPayoutRatioScale change scale, not economics. Capital and Margin overrides influence their respective curves.
If the metrics cannot be explained
Return to one source and one metric. Check dates, count, currency, sizing, costs and freshness. Disable Align and Impact. Do not use an unreconciled baseline for a management decision.
Verify the reading
Switch Align off and confirm that the absolute chart and lower Result still support the written observation. If Capital or Margin looks surprising, check AccountCapitalOverride, MarginLeverageOverride, contract size and source support before treating the curve as operational broker history.
Continue through the manual
Next: Spotlight VS, Portfolio Impact and Settings Manual — apply the metrics to individual and portfolio scenarios.
Other useful follow-ups:
- Castlist Management Manual — turn the analytical observation into a managed next action.
- Backstage Quick Start Manual — improve source continuity before later comparisons.
- Spotlight Quick Start Manual — return to the baseline and trade-axis procedure.



