Bullish and bearish engulfing patterns: what the context tells you

The engulfing pattern is a two-candle reversal pattern: a candle whose body covers the body of the candle before it, in the other direction. It is easy to spot, it appears on every market and timeframe, and that is exactly why the candle on its own says so little. This article covers how the pattern is defined and the variants you will meet, why context carries more weight than the candle, the mistakes that make engulfing signals look better or worse than they are, and how to read an overview by currency. The examples use EngulfingScanner (user guide), and the ideas apply to any chart.
The definition
A bullish engulfing forms after a down candle. The next candle opens at or below the prior close and closes at or above the prior open, so its up body covers the whole down body before it. A bearish engulfing is the mirror image: an up candle followed by a down candle that opens at or above the prior close and closes at or below the prior open.
What the two candles describe is a change of control. On the first candle one side pushed price its way. On the second, the other side started from that side's last price and pushed beyond where the first candle began.
Variants you will meet
Books, platforms and indicators do not all use the same rule. The common differences:
- Body only or full range. The classic pattern compares bodies only. A stricter version also wants the engulfing candle's high and low to cover the prior high and low, which is close to what some traders call an outside bar.
- Opposite colours or not. The classic pattern needs a down candle then an up candle (or the reverse). Some versions accept any prior candle, a doji for example, as long as the new body is larger and covers it.
- Equal prices. On forex the open of a candle often equals the prior close to the point. A rule that demands the open strictly beyond the prior close misses most intraday patterns, so many definitions accept equal prices.
- Minimum size. Without one, a tiny candle covering a tinier one counts as an engulfing. A minimum body measured in ATR removes those.
EngulfingScanner uses the classic body rule with opposite colours and equal prices accepted, plus a minimum body of 0.25 x ATR(14). The full range rule and the any-colour rule are inputs, and so is the minimum body. Whichever you choose, use the same rule every time, so what you learn from past patterns applies to the next one.
Why context matters more than the candle
On a watch list of 29 symbols and 6 timeframes, a few dozen fresh engulfings are on the screen at any moment; the screenshots show more than 80. They cannot all be meaningful, and the candle shape alone does not tell them apart. What does is the answer to a few questions:
- Where did it form? At a level other traders watch (the prior day or week high or low, a session high or low, a round number), or in open space?
- What did it take? Did the pattern sweep a recent swing high or low, taking the stops behind it, before closing back inside?
- Which way is the larger timeframe going? A bullish engulfing on M15 under a falling H1 trades against the bigger flow.
- How large is it? A body of one ATR or more is a real shift, a body barely larger than the prior one is not.
- When did it form? In London or New York hours, or in the quiet late session?
- Was there news? A release can print a large engulfing that is the market repricing a number, not a reaction to a level.
EngulfingScanner turns these into a grade: 2 points for a key level, 1 each for a sweep, the higher timeframe trend, size and session (below H4), and news nearby keeps a pattern from an A. An A needs 5 of 6 points, a key level and no release nearby; a B needs 3. On H4 and above the session is not counted and both thresholds are one point lower. The how-to How to trade engulfing candles at key levels goes through each check with worked examples.
Common mistakes
Pairing candles across the weekend. On an M15 chart, Friday's last candle and Monday's first sit side by side, but two days and a weekend gap separate them. A Monday candle that "engulfs" Friday's close is mostly the gap. EngulfingScanner never pairs two candles separated by a market closure below D1. On daily charts Friday to Monday is normally read as one pair, as traders do, but some brokers print a short Sunday daily candle, and a pattern that uses it deserves a second look.
Counting tiny bodies. In quiet hours, candles of a few points each produce engulfings all the time. They are real by the definition and mean very little. A minimum body in ATR filters them before they reach you.
Reading a forming candle. An engulfing is only an engulfing when its candle has closed. Mid-candle, a bullish body that covers the prior body can fall back by the close. Indicators that flag patterns on the forming bar show signals that later disappear. EngulfingScanner reads closed bars only: a cell never changes its past.
Judging the pattern with hindsight. A level drawn after the fact, or a higher timeframe bar that had not yet closed when the pattern formed, makes past patterns look better than they could have been traded. Every check in the scanner uses only what was known when the engulfing closed: the levels in force at the pattern's first candle, the higher timeframe bar closed by then, and swings already confirmed.
Ignoring the age. A bullish engulfing five bars ago at a level has already had five bars to work, and price may now be far from the stop. The scanner shows the age in closed bars on every cell, and the top setups list the newest first within each grade.
Placing the stop at the extreme. The stop belongs beyond the low of both candles for a buy (beyond the high of both for a sell), with a buffer. Exactly at the extreme, the next small spike takes it.
Trading a C as if it were an A. An engulfing in open space, against the higher timeframe, in the quiet hours is a different trade from one at the London low after a sweep. If you trade both, track them separately.
Reading the grid
In the scanner grid, an A cell is filled, a B cell is outlined and a C cell is faded, so the eye goes to the A grades first. A few habits help:
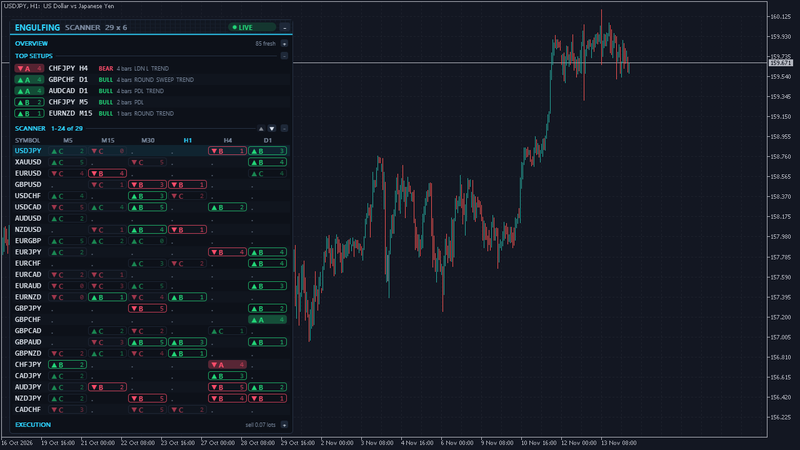
- Look along a row. The same direction on several timeframes of one symbol, for example a bullish M30 B and a bullish H4 B, means the turn shows on more than one scale.
- Look down a column. Many bearish patterns on H1 across unrelated pairs often point to one currency moving, which the overview makes explicit.
- Check the age. A 0 is the last closed bar. An A that is 4 bars old may already have run.
- Hover before you click. The tooltip lists each check with its points, so you know whether an A came from a sweep and a level, or a level and a big body.
Reading the overview by currency
Every pair has two currencies, so every engulfing says something about both. A bullish engulfing on EURUSD is bullish for EUR and bearish for USD. A bearish engulfing on USDJPY is bearish for USD and bullish for JPY. EngulfingScanner's overview adds these up for each currency across all scanned symbols and timeframes, and colours the badge by the side that leads. Gold counts as XAU.
Take the overview in the light screenshot: USD 15 bullish against 9 bearish, NZD 8 against 14, the rest close to even. That reads as the US dollar turning up and the New Zealand dollar turning down in more places than the other currencies, which puts NZDUSD in view as a pair where both sides line up. The timeframe tiles add the scale: 13 bullish against 1 bearish on D1, while M15 shows 5 against 12, so the daily and intraday pictures disagree. Hover a currency badge to split its counts by timeframe and see which scale the lean comes from.
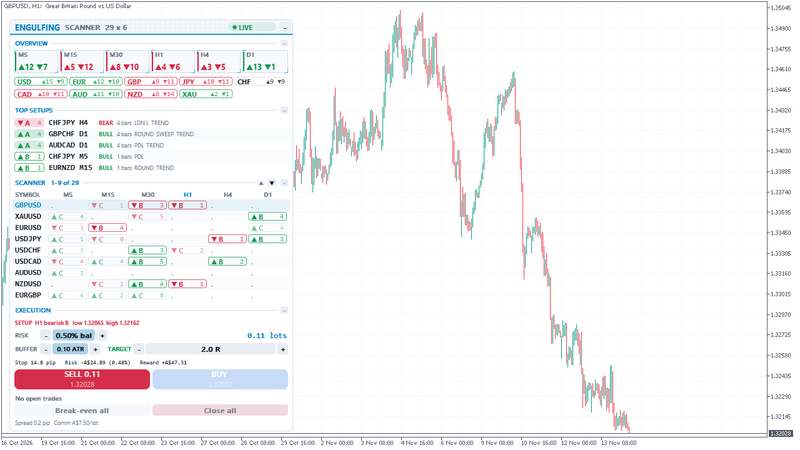
The overview is a map of where patterns are forming, not a strength meter: it counts patterns, not price moves. Use it to choose where to look first, then judge each pattern by its own context.
A short checklist
- Use one engulfing definition and stick with it.
- Ask where it formed, what it swept, what the higher timeframe says, how large it is and when it formed.
- Skip patterns built across a weekend gap, and treat tiny bodies as noise.
- Read closed candles only, and check the age before you act.
- Put the stop beyond both candles with a buffer, and size the trade from that stop.
- Use the currency overview to choose where to look, not as a signal by itself.
EngulfingScanner is available for MT5 and MT4. More on engulfingscanner.com.
Risk note: trading forex, gold and CFDs carries a high risk of loss. Engulfing patterns and their context are information for your decision, read together with your own plan; the examples above are illustrations, not trade recommendations. Stops can fill further away in gaps and fast markets. Test any approach on a demo account first, and never risk money you cannot afford to lose.