Failed Breakouts: Why the Fastest Moves Start with a Trap

This article is for informational and educational purposes only. It does not constitute financial advice or an investment recommendation. Trading in financial markets carries a high risk of loss.
Introduction
Breakouts attract attention: price leaves a range, stops are triggered and new positions are opened in the direction of the move. Many of those breakouts do not hold. Price returns inside the range, and the traders who entered or were stopped out on the way find themselves on the wrong side. Their exits often produce some of the fastest moves on the chart.
This article is divided into three sections. The first explains how a failed breakout develops and why it moves price so quickly. The second shows how to tell a failed breakout from a genuine one. The third covers how to trade it with defined risk, with a step-by-step example.
1. How a failed breakout develops
Three steps
A failed breakout usually follows the same sequence, whether it happens at the top or at the bottom of a range.
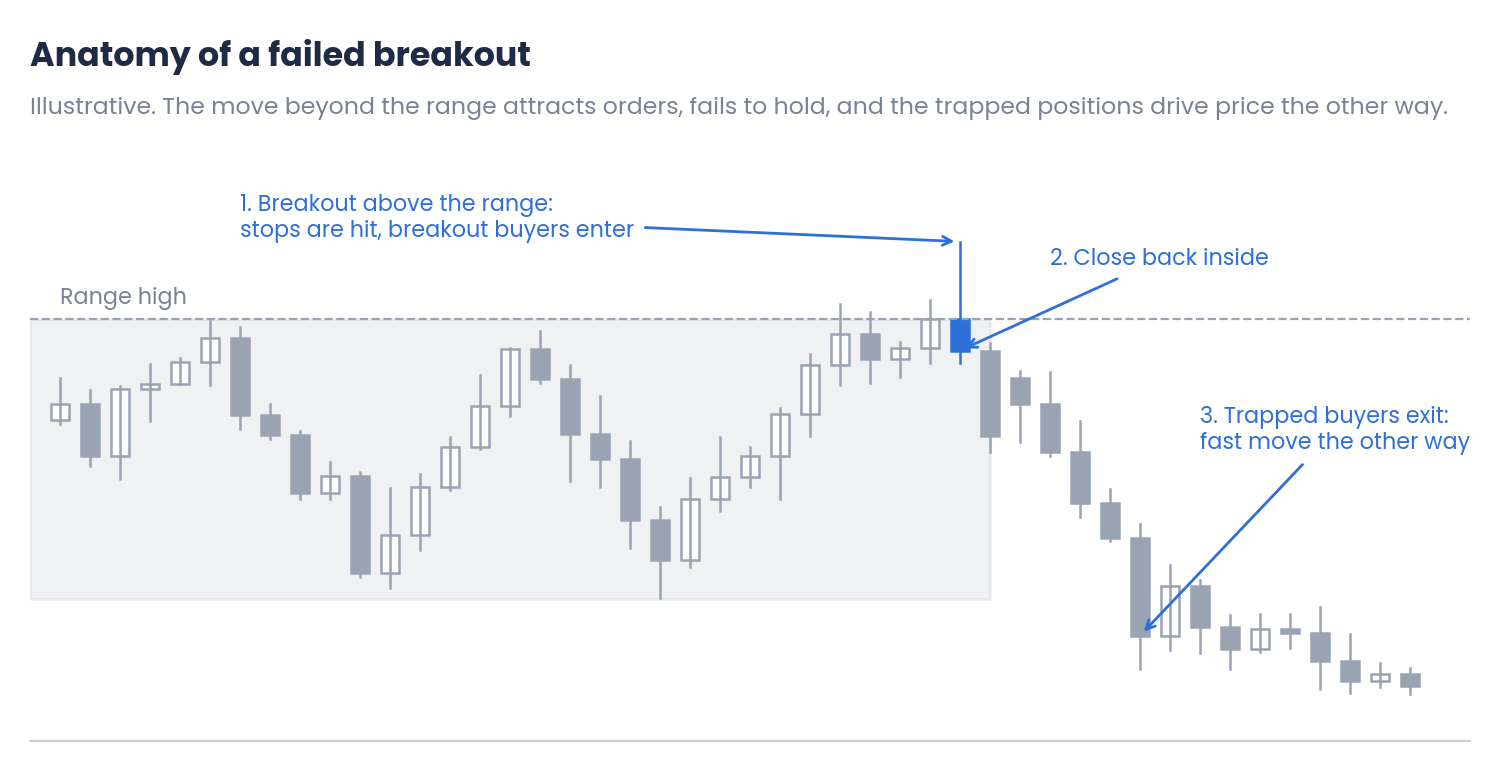
Figure 1. The three steps of a failed breakout above a range (illustrative)
- Breakout: price moves beyond the range. Stops of traders who were short inside the range are triggered, and breakout traders buy.
- Failure: the buying is not enough to keep price outside. The bar, or the next few bars, close back inside the range.
- Reversal: the breakout buyers are now losing, with their stops below. As they exit, their selling adds to the move in the other direction.
Why the move is fast
A normal move needs new participants to keep going. A move after a failed breakout also has the trapped traders closing their positions, and their exits push in the same direction. This combination is what makes the reversal sharp. Traders often summarise it with an old saying: from failed moves come fast moves.
The same pattern at the bottom of a range, where price breaks below support and quickly returns, is also known as a 2B, a term introduced by Victor Sperandeo for a new low or high that fails to hold.
2. Telling a failed breakout from a genuine one
The close is the key
During the breakout bar, both cases look the same. The difference appears when the bar closes and in the bars that follow.
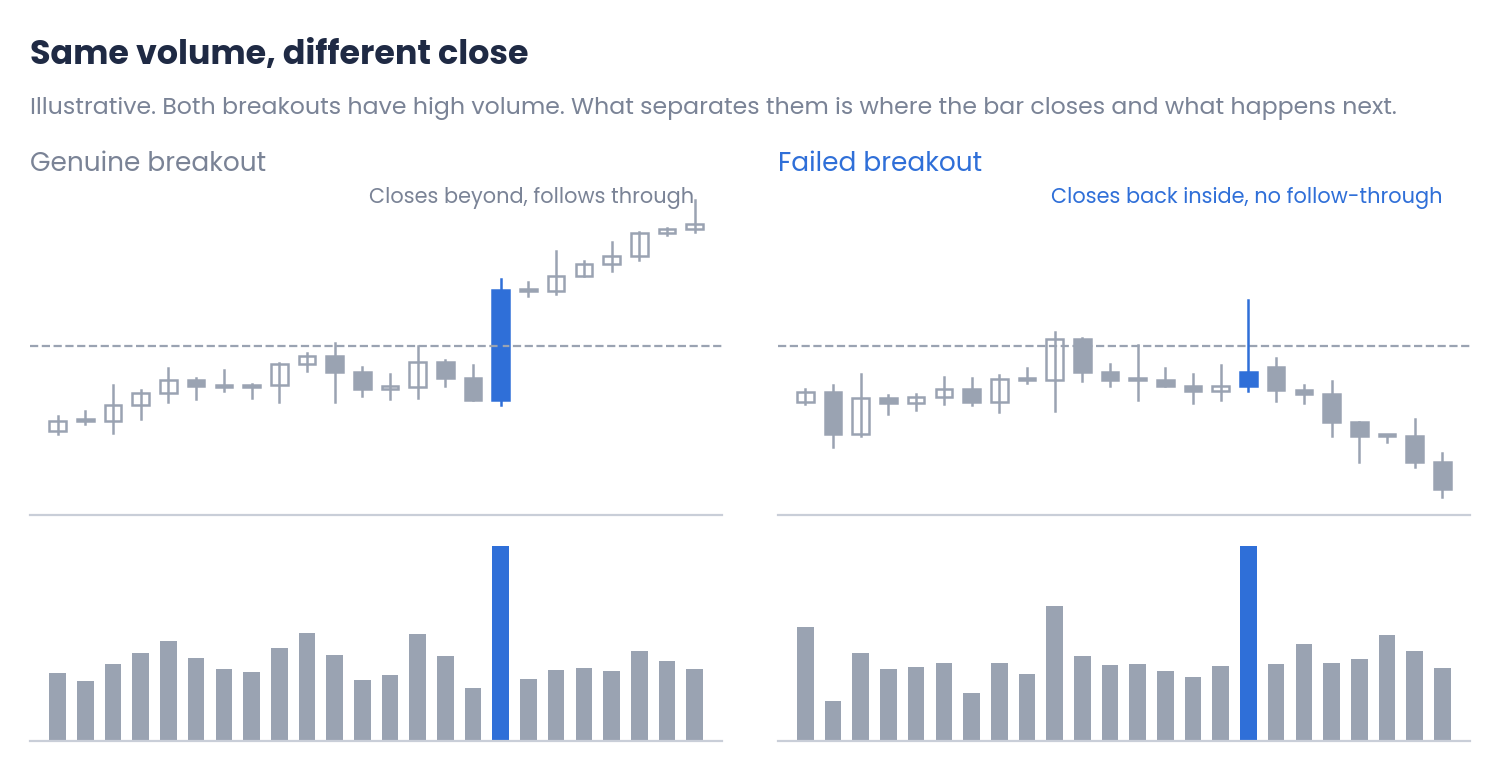
Figure 2. A genuine breakout and a failed one with the same volume (illustrative)
| Clue | Genuine breakout | Failed breakout |
|---|---|---|
| Close of the breakout bar | Clearly beyond the range | Back inside, with a long wick outside |
| Following bars | Stay outside or retest and continue | Return to the range quickly |
| Volume and range | High volume with a wide range | High volume with little progress |
| Context | In the direction of the higher timeframe trend | Against it, or after a long, wide range |
No single clue is decisive. The more of them point in the same direction, the more reliable the reading.
Time matters
A breakout that is going to fail usually does so quickly, within a few bars. The longer price stays outside the range, the more likely the breakout is genuine and the less the failed-breakout idea applies. A return to the range many bars later is better treated as a new situation.
3. Trading a failed breakout
A plan with defined risk
One advantage of this pattern is that it shows clearly where the idea is wrong: if price goes back beyond the failed extreme, the trap did not work.
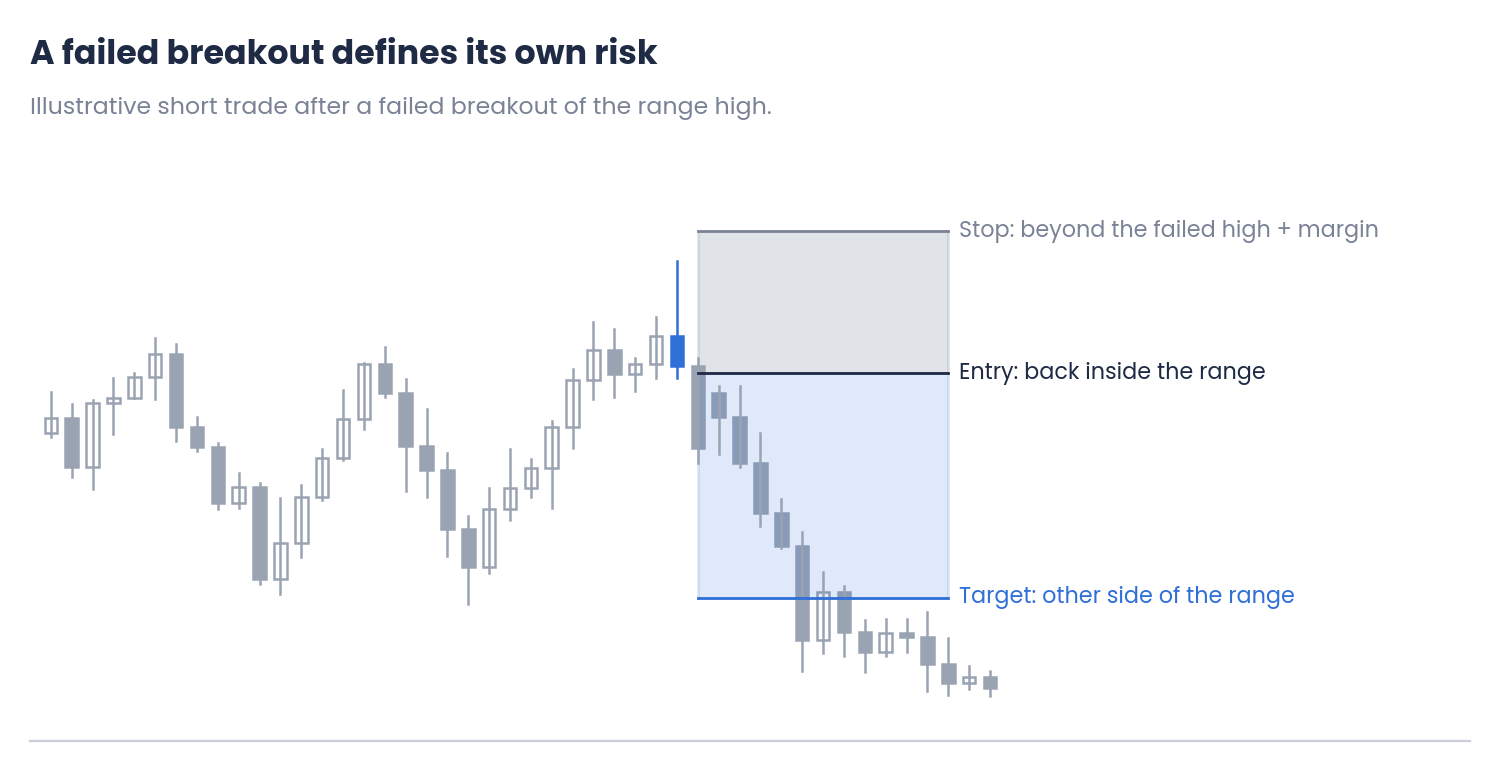
Figure 3. Entry, stop and target after a failed breakout of a range high (illustrative)
- Entry: after a close back inside the range. While the breakout bar is still forming, it can still close outside.
- Stop: beyond the extreme of the failed breakout, with a small volatility margin, as explained in the article on where to place a stop loss.
- Target: the middle of the range as a first target, and the opposite side as a second one.
Step-by-step example
Suppose GBPUSD on H1 has traded between 1.2650 and 1.2700 for several days. Price breaks above to 1.2712 and the bar closes at 1.2694.
| Step | Calculation | Result |
|---|---|---|
| 1. Failed extreme | High of the breakout bar | 1.2712 |
| 2. Entry | Short after the close back inside | 1.2692 |
| 3. Stop | 1.2712 + 0.25 × 16 pips (ATR) | 1.2716 (24 pips of risk) |
| 4. Target | Bottom of the range | 1.2650 (42 pips) |
| 5. Reward-to-risk | 42 ÷ 24 | 1:1.75 |
| 6. Breakeven win rate | 1 ÷ (1 + 1.75) | 36% |
Illustrative values, before spread and commission.
With a 1:1.75 ratio, the setup needs to work a little more than one time in three to break even. Why that line matters is explained in the article on risk/reward and win rate.
Avoiding the trap yourself
The same knowledge helps when you are the one trading the breakout. Waiting for a close beyond the range, looking for volume that produces real progress, and preferring breakouts in the direction of the higher timeframe trend all reduce the chance of being among the trapped traders.
Common mistakes
- Entering before the close. A bar that looks like a failure can still close outside the range.
- Ignoring the context. Against a strong higher timeframe trend, a breakout that pauses may simply continue.
- Placing the stop inside the wick. Price often retests the failed extreme before moving away.
- Acting on a return many bars later. The longer the breakout held, the less this pattern applies.
Conclusions
- How it develops: a breakout attracts stops and new positions, fails to hold, and the trapped traders' exits push price quickly the other way.
- Telling it apart: the close of the breakout bar is the key, together with the following bars, the relation between volume and progress, and the higher timeframe context. Failures usually happen quickly.
- Trading it: enter after the close back inside, place the stop beyond the failed extreme with a margin, and target the middle or the other side of the range.
Failed breakouts are a reminder that every move beyond a level attracts traders who can be trapped. Test any approach with your own data on demo or in the Strategy Tester, and combine it with disciplined risk management.
Disclaimer
This content is for informational and educational purposes only. It does not constitute financial advice or a recommendation to buy or sell any instrument. The patterns described are not a forecast. The charts and examples are illustrative, and every asset and every broker is different. Trading forex, CFDs and other leveraged products carries a high risk of loss. Every trading decision, and its outcome, is the sole responsibility of the reader. The author accepts no liability for any loss arising from the use of this information.




