
This article is for informational and educational purposes only. It does not constitute financial advice or an investment recommendation. Trading in financial markets carries a high risk of loss.
Introduction
A chart on a single timeframe tells only part of the story. A clear downtrend on H1 can be a small pullback in a strong daily uptrend, and a perfect breakout on M15 can run straight into a weekly resistance. Many trades that look correct on one timeframe fail because the larger picture was against them.
This article is divided into three sections. The first explains why one timeframe is not enough. The second proposes a simple framework with three timeframes, each with a different job. The third shows how to apply it in MetaTrader 5, with a step-by-step example and the most common mistakes.
1. Why one timeframe is not enough
The same price, different trends
Trends exist at every scale. A few days of falling prices form a downtrend on H1, while on the daily chart they are just a pause in an advance.
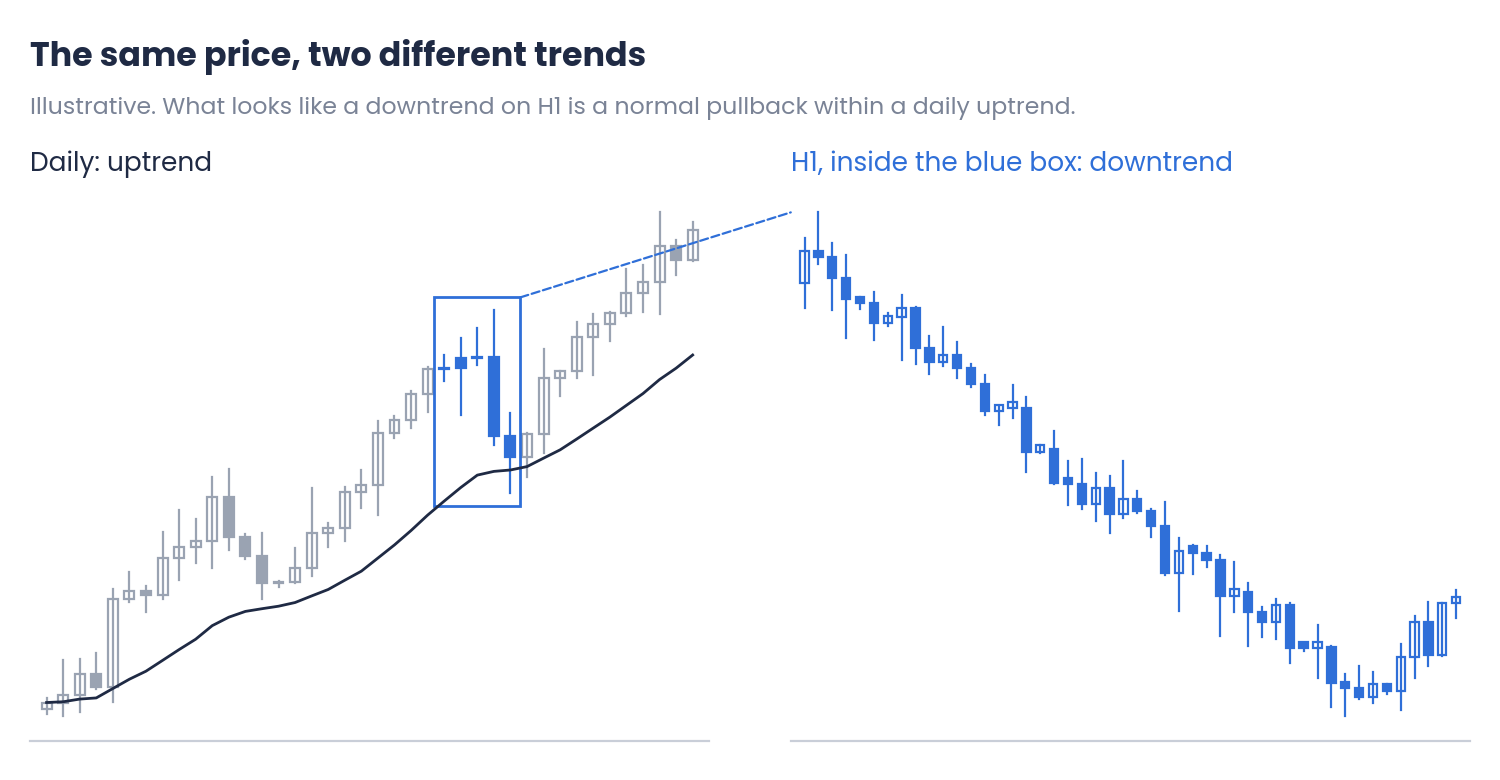
Figure 1. A pullback on the daily chart seen as a downtrend on H1 (illustrative)
Neither reading is wrong. The problem appears when a trader only looks at H1, sells the downtrend and finds that the daily buyers return exactly where the pullback was expected to end.
Larger timeframes usually dominate
Positions opened on the daily or weekly chart are usually larger and held for longer than those opened on M15. When the two disagree, the larger flow tends to prevail. A signal on a low timeframe in the same direction as the higher one has that flow behind it; a signal against it has to fight it.
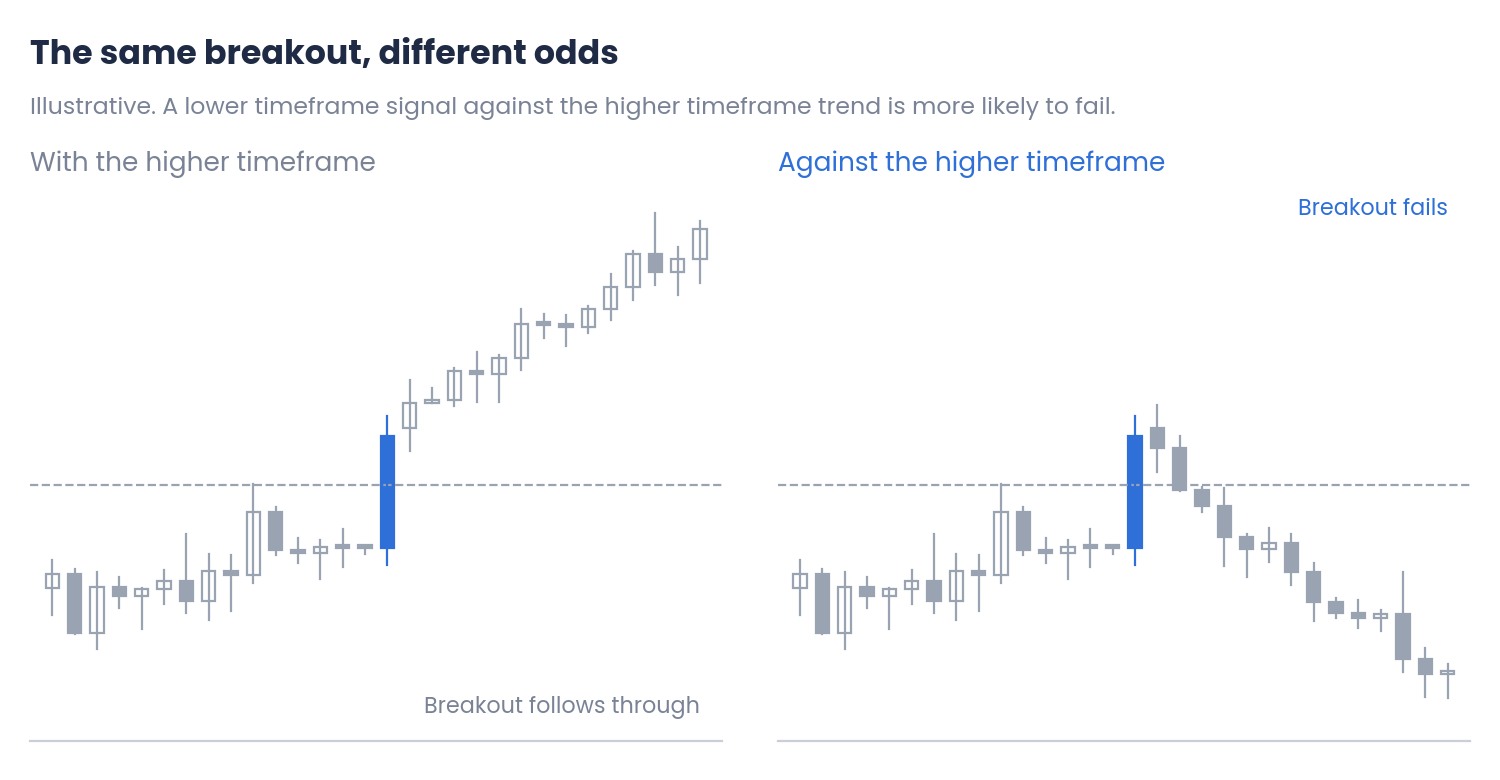
Figure 2. The same breakout with and against the higher timeframe trend (illustrative)
2. A framework with three timeframes
Three jobs
A practical way to combine timeframes is to give each one a single job, instead of looking at all of them for the same thing.
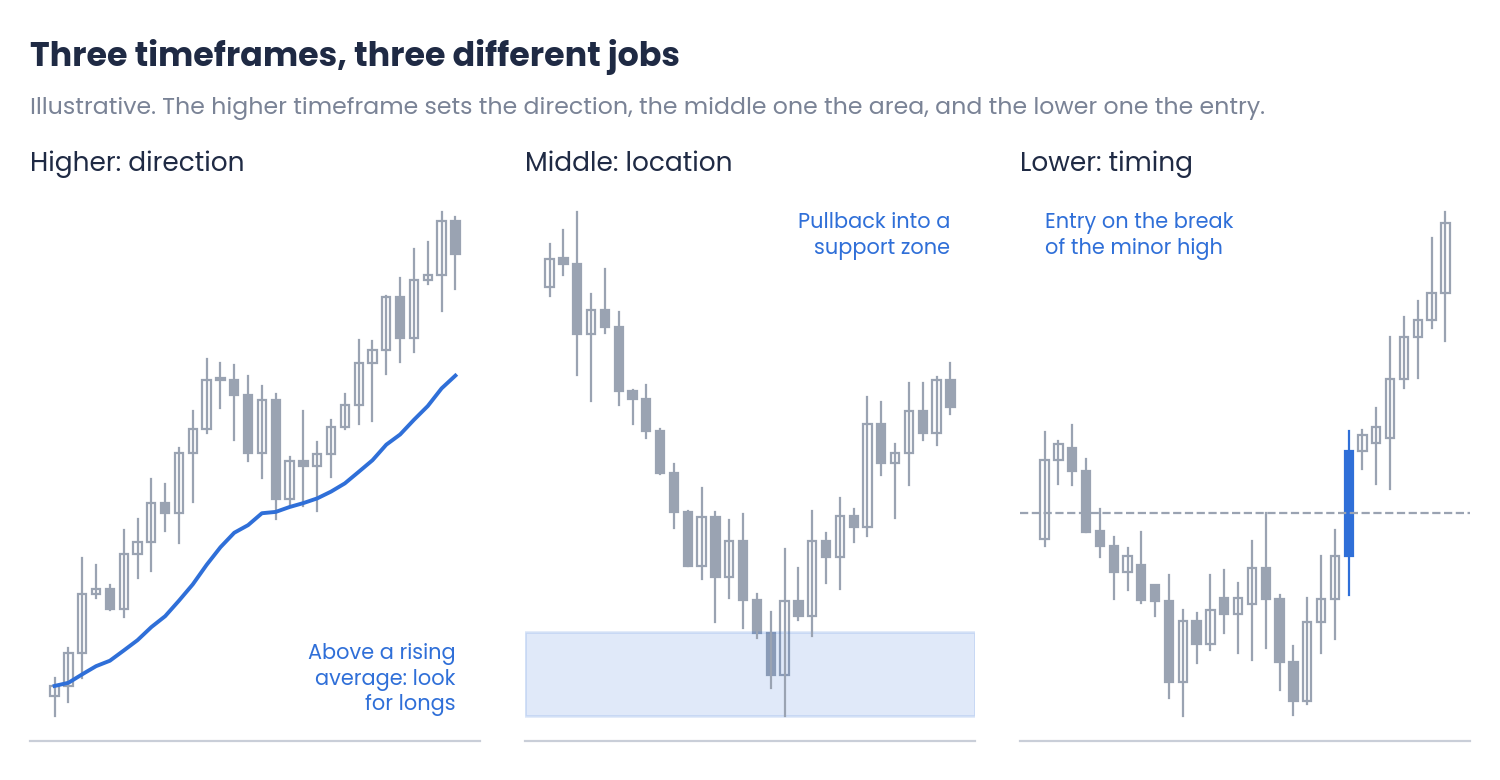
Figure 3. Direction, location and timing on three timeframes (illustrative)
- Higher timeframe: direction. Decide whether to look for longs, shorts or nothing. A simple rule is enough: price above a rising moving average, with higher highs and higher lows, means longs only.
- Middle timeframe: location. Find where it makes sense to act: a pullback into a support zone in an uptrend, or a rally into resistance in a downtrend.
- Lower timeframe: timing. Wait for price to show that it is turning in the expected direction, for example by breaking a minor high, and place the entry and the stop.
Choosing the combination
Each timeframe is usually about four to six times the next one. The middle timeframe should be the one you actually trade on.
| Trading style | Higher | Middle | Lower |
|---|---|---|---|
| Position | W1 | D1 | H4 |
| Swing | D1 | H4 | H1 |
| Intraday | H4 | H1 | M15 |
| Short-term intraday | H1 | M15 | M5 |
Common combinations. What matters is keeping the same set and the same rules every time.
When the timeframes disagree
Sometimes the higher timeframe has no clear direction, for example in a wide range. In that case, the framework has two honest answers: trade only at the edges of the range on the middle timeframe, or wait. A trade taken only because the lower timeframe looks good, with no support from above, is the kind of trade the framework is meant to filter out.
3. Applying it in MT5
Step-by-step example
Suppose a swing approach on EURUSD with D1, H4 and H1.
| Step | Timeframe | Observation | Decision |
|---|---|---|---|
| 1. Direction | D1 | Price at 1.0920, above a rising 50-period EMA at 1.0850, higher lows | Longs only |
| 2. Location | H4 | Pullback into a support zone at 1.0880 to 1.0895 | Watch the zone |
| 3. Timing | H1 | Price breaks the last minor high at 1.0902 | Entry at 1.0902 |
| 4. Stop | H4 | Below the zone with a margin: 1.0880 − 0.25 × 24 pips (ATR) | 1.0874 (28 pips) |
| 5. Target | D1 | Previous daily high at 1.0985 | 83 pips, about 1:3 |
Illustrative values. The ATR, zones and highs depend on the broker and the period.
Each timeframe contributes something the others cannot: the daily chart gives the direction and a realistic target, the four-hour chart the place to act and to put the stop, and the hourly chart a precise entry. The stop goes beyond the zone with a volatility margin, as explained in the article on where to place a stop loss.
Setting up the workspace
- Three charts side by side: open the same symbol on the three timeframes and arrange them with Window → Tile Windows.
- Profiles: save the layout as a profile (File → Profiles) so that the same set of charts opens with one click.
- Object visibility: in the properties of each zone or line, choose on which timeframes it is shown. A daily level can appear on every chart; an H1 line is better kept to the lower timeframes. The article on clean charts in MT5 explains why this matters.
- Templates: use one template per job, for example the moving average only on the higher timeframe chart.
Common mistakes
- Looking at too many timeframes. With five or six charts, one of them will always support the trade you want to take.
- Changing the combination from one trade to the next. The framework only works if the set and the rules stay the same.
- Using the lower timeframe to override the higher one. A strong signal against the main trend is still a trade against the main trend.
- Placing the stop on the lower timeframe structure only. It is often too close to survive normal movement on the middle timeframe.
- Forcing trades when the higher timeframe is unclear. Waiting is a valid decision.
Conclusions
- Why one timeframe is not enough: trends exist at every scale, and the larger timeframes usually dominate. A signal in their direction has more behind it than one against them.
- A framework with three timeframes: the higher one sets the direction, the middle one the location and the lower one the timing. Keep a ratio of about four to six between them and wait when the higher timeframe is unclear.
- Applying it in MT5: take the direction and target from the higher chart, the zone and stop from the middle one, and the entry from the lower one. Profiles, templates and object visibility make the workspace quick to use.
Looking at the higher timeframe first turns many doubtful trades into clear decisions, including the decision not to trade. Test any approach with your own data on demo or in the Strategy Tester, and combine it with disciplined risk management.
Disclaimer
This content is for informational and educational purposes only. It does not constitute financial advice or a recommendation to buy or sell any instrument. The patterns described are not a forecast. The charts and examples are illustrative, and every asset and every broker is different. Trading forex, CFDs and other leveraged products carries a high risk of loss. Every trading decision, and its outcome, is the sole responsibility of the reader. The author accepts no liability for any loss arising from the use of this information.