Reading Market Structure Without Repainting: HH, HL, LH, LL, BOS and CHoCH on XAUUSD

If you have ever marked highs and lows on XAUUSD by hand, you already use market structure. Higher highs and higher lows are an uptrend; lower highs and lower lows are a downtrend. A break of that sequence is often the first clear sign that the market has changed its mind.
The hard part is doing this in real time without fooling yourself on history. Many zigzag-style tools look perfect after the fact: they wait for a reversal of a given size, then pin a point to the extreme of that move. While the last bar is still open, that point often moves, jumps to a neighbouring bar, or disappears if the move continues. After a few bars the history looks as if the signal had always been there. The stricter question is: once a label is printed, will it still be in the same place tomorrow?
The examples use XAUUSD and the free MetaTrader 5 indicator Swing Structure ATR 2.30.
What swings and structure are
A swing high is a local peak left far enough behind to be treated as finished. A swing low is a finished local trough. Structure is the relationship between those swings:
- HH (higher high): this peak is above the previous peak.
- HL (higher low): this trough is above the previous trough.
- LH (lower high): this peak is below the previous peak.
- LL (lower low): this trough is below the previous trough.
A bullish structure is a sequence of HH and HL; a bearish structure is a sequence of LH and LL. What matters is the last confirmed peak and trough, and whether a later close takes them out.
How a confirmed swing works
Swing Structure ATR does not place an arrow on the extreme while the swing is still forming. It tracks the extreme close and confirms the swing only when a completed bar closes at least N times ATR away from that extreme. The defaults are three sizes: fast L1 at 1× ATR, medium L2 at 2× ATR (used for structure labels by default), and slow L3 at 4× ATR.
The arrow is drawn on the confirmation bar, not on the extreme, and is not moved afterwards. The HH, HL, LH or LL label is placed on the swing bar at the moment of confirmation, so it appears a few bars after that bar and is never moved or removed later. The forming bar is always empty. Confirmation always comes after the move has started, and a newly confirmed swing can still fail. The map is context, not a buy or sell command.
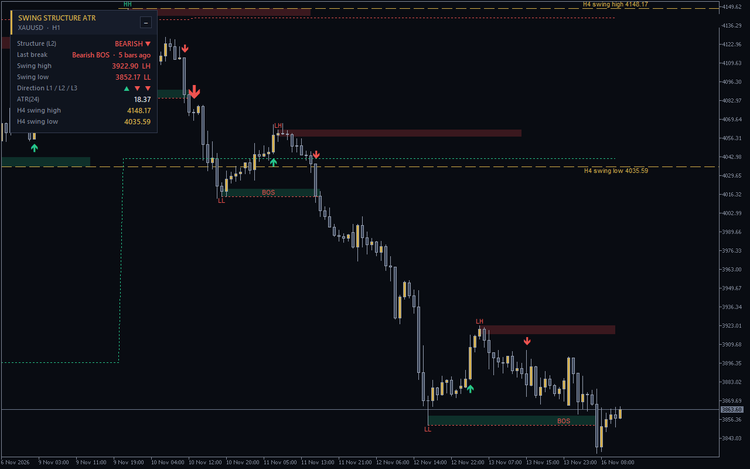
XAUUSD H1. Bearish structure, a bearish BOS through the last confirmed swing low, and H4 swing levels as gold dashed lines. Historical chart, not a trading result.
On the H1 chart above, a bearish BOS comes after a lower high and a lower low.
BOS, CHoCH, and higher-timeframe levels
Once a swing is confirmed, the next useful event is a close beyond it.
- BOS (break of structure) continues the current structure: a close below the last swing low in a downtrend, or above the last swing high in an uptrend.
- CHoCH (change of character) breaks the structure the other way: a close above the last swing high in a downtrend, or below the last swing low in an uptrend.
The mark is drawn only when a closed bar closes beyond the last confirmed swing, with a dotted line from that swing to the break bar.
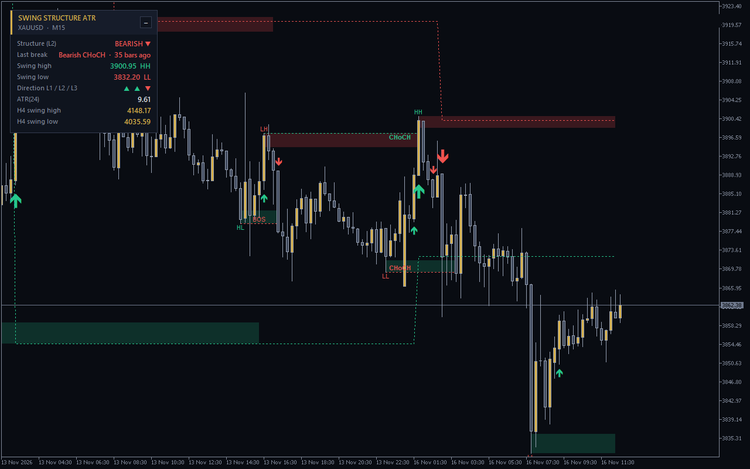
XAUUSD M15. A BOS and a later CHoCH on the same chart, with H4 swing levels in the panel. Historical chart, not a trading result.
A CHoCH on M15 is not the same event as a CHoCH on H1 or a break of a daily swing. The indicator can plot the last confirmed swing high and low from a higher timeframe — H4 by default, or D1 — as dashed gold lines with price labels, using closed higher-timeframe bars only. Read those levels as a frame, not as an entry: a bounce below the last H4 swing low is still inside a larger down move.
ATR and risk
ATR here is a yardstick. The same value that confirms a swing can also size an optional zone around that point. A stop tighter than a typical 1× or 2× ATR swing sits inside normal noise; a level several ATR away is a slower structural line. None of this claims that a particular stop will hold: XAUUSD can run more than one ATR in a single hour, and the defaults are starting values, not a fit for every market.
Did the labels really stay put?
Every buffer value was recorded bar by bar in the MetaTrader 5 Strategy Tester (1-minute OHLC, a single run, no optimisation). That live record was compared with the finished history of the same indicator instance, and with a fresh instance that recalculated the whole history in one pass. The forming bar was checked and had to stay empty.
On XAUUSD H1, from 1 May 2025 to 13 November 2026, that comparison covered 9,107 bars and 118,391 values: 0 mismatches against the same instance, 0 mismatches against the fresh instance, and 0 cases where the forming bar was non-empty. On EURUSD M15, from 1 June 2026 to 13 November 2026, it covered 11,351 bars and 147,563 values, again with 0 mismatches and 0 non-empty forming bars. Walking forward bar by bar gives the same picture as dropping the indicator onto the finished chart.
Swing Structure ATR 2.30 is free on the Market. It works on any symbol and timeframe, with a compact English or Russian panel, dark and light themes, and optional pop-up, sound, push and e-mail alerts for BOS, CHoCH and new L2 or L3 swings. It does not open, modify or close orders.
Swing Structure ATR — free indicator for MetaTrader 5.
More from the author: Golden Sniper XAU
Trading involves risk. The screenshots show historical charts, not trading results.