
Strategy Ledger Pro: take the interactive walkthrough in the Strategy Tester

Strategy Ledger Pro is a read-only analytics panel for MetaTrader 5. From version 5.00 it can show itself to you before you put it on an account: start it in the Strategy Tester's visual mode and it opens on a built-in sample account, with a walkthrough that takes you through the panel page by page.
This post explains how to start it, what you will see, and what the sample can and cannot tell you.
What it is
- A sample account inside the panel. The figures are invented. Every page carries the label SAMPLE DATA · not real trading, so a screenshot of the sample can never be mistaken for a real result.
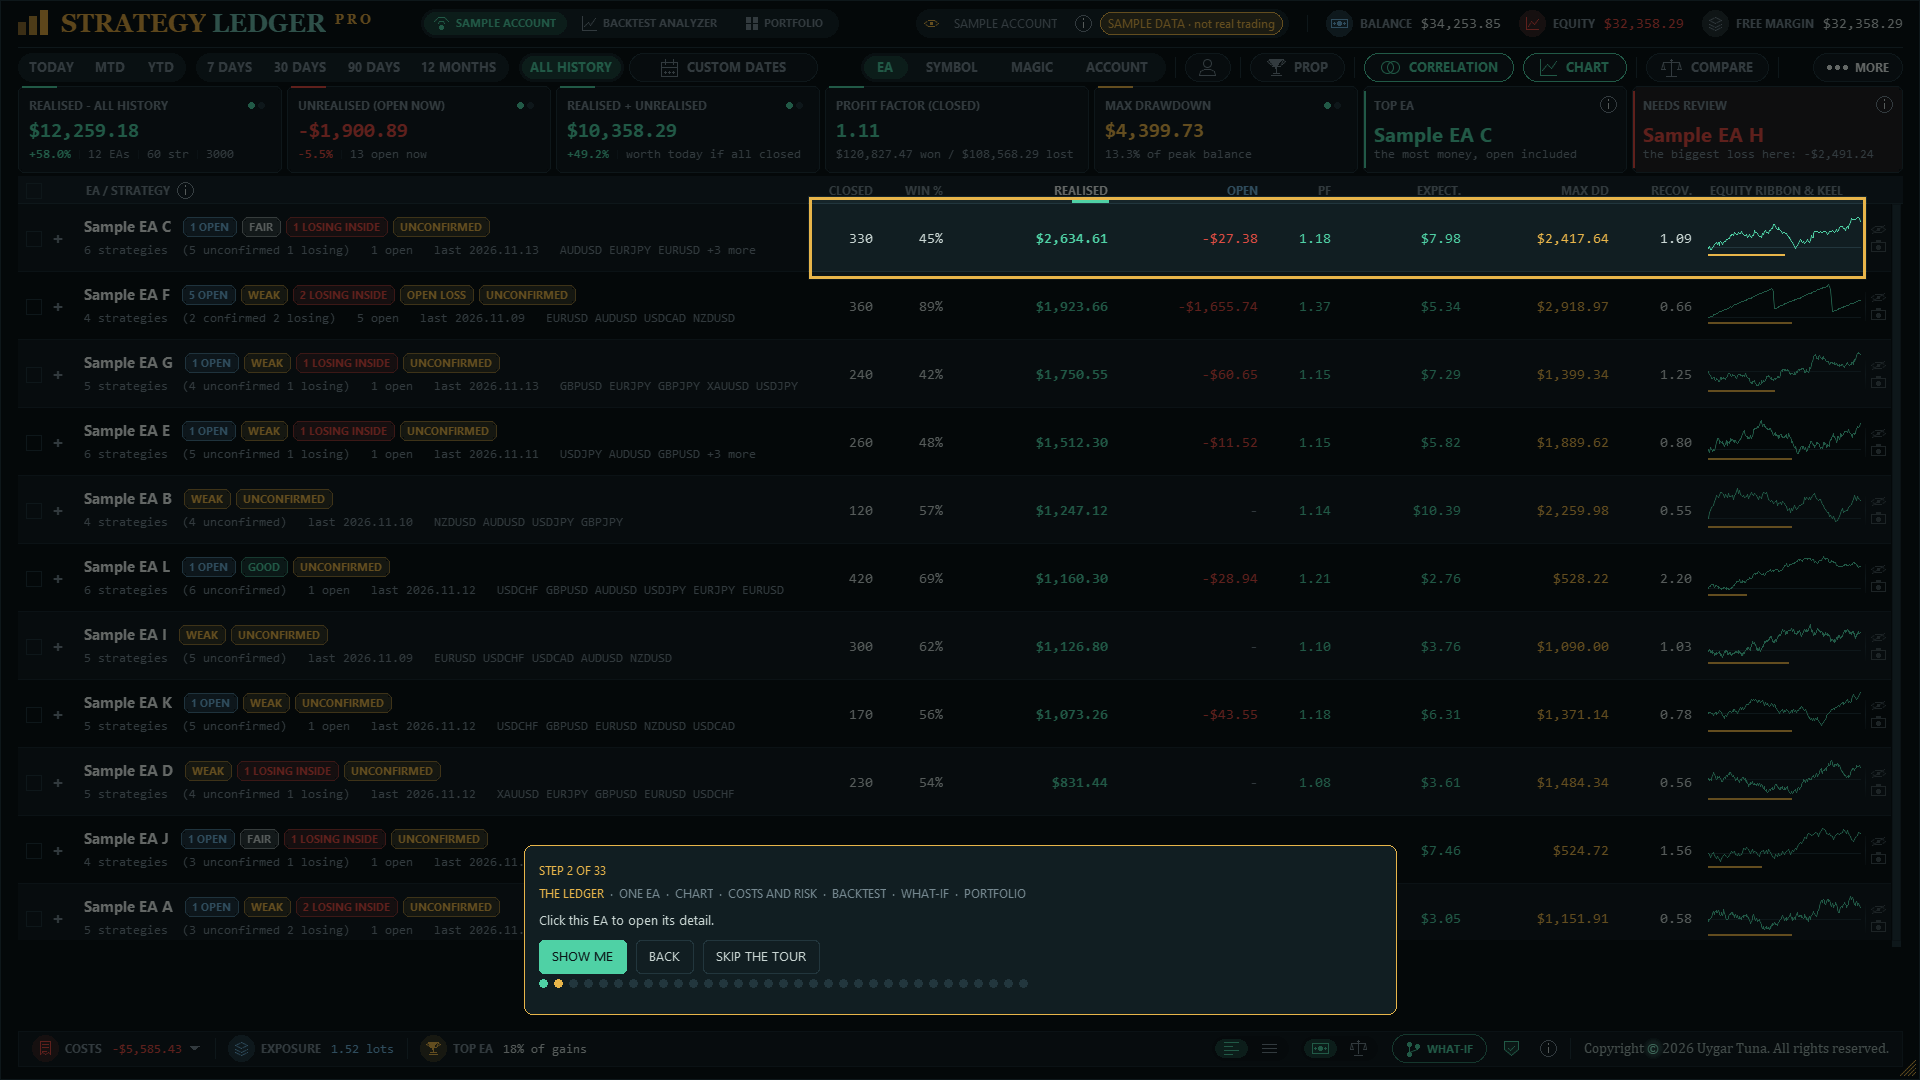
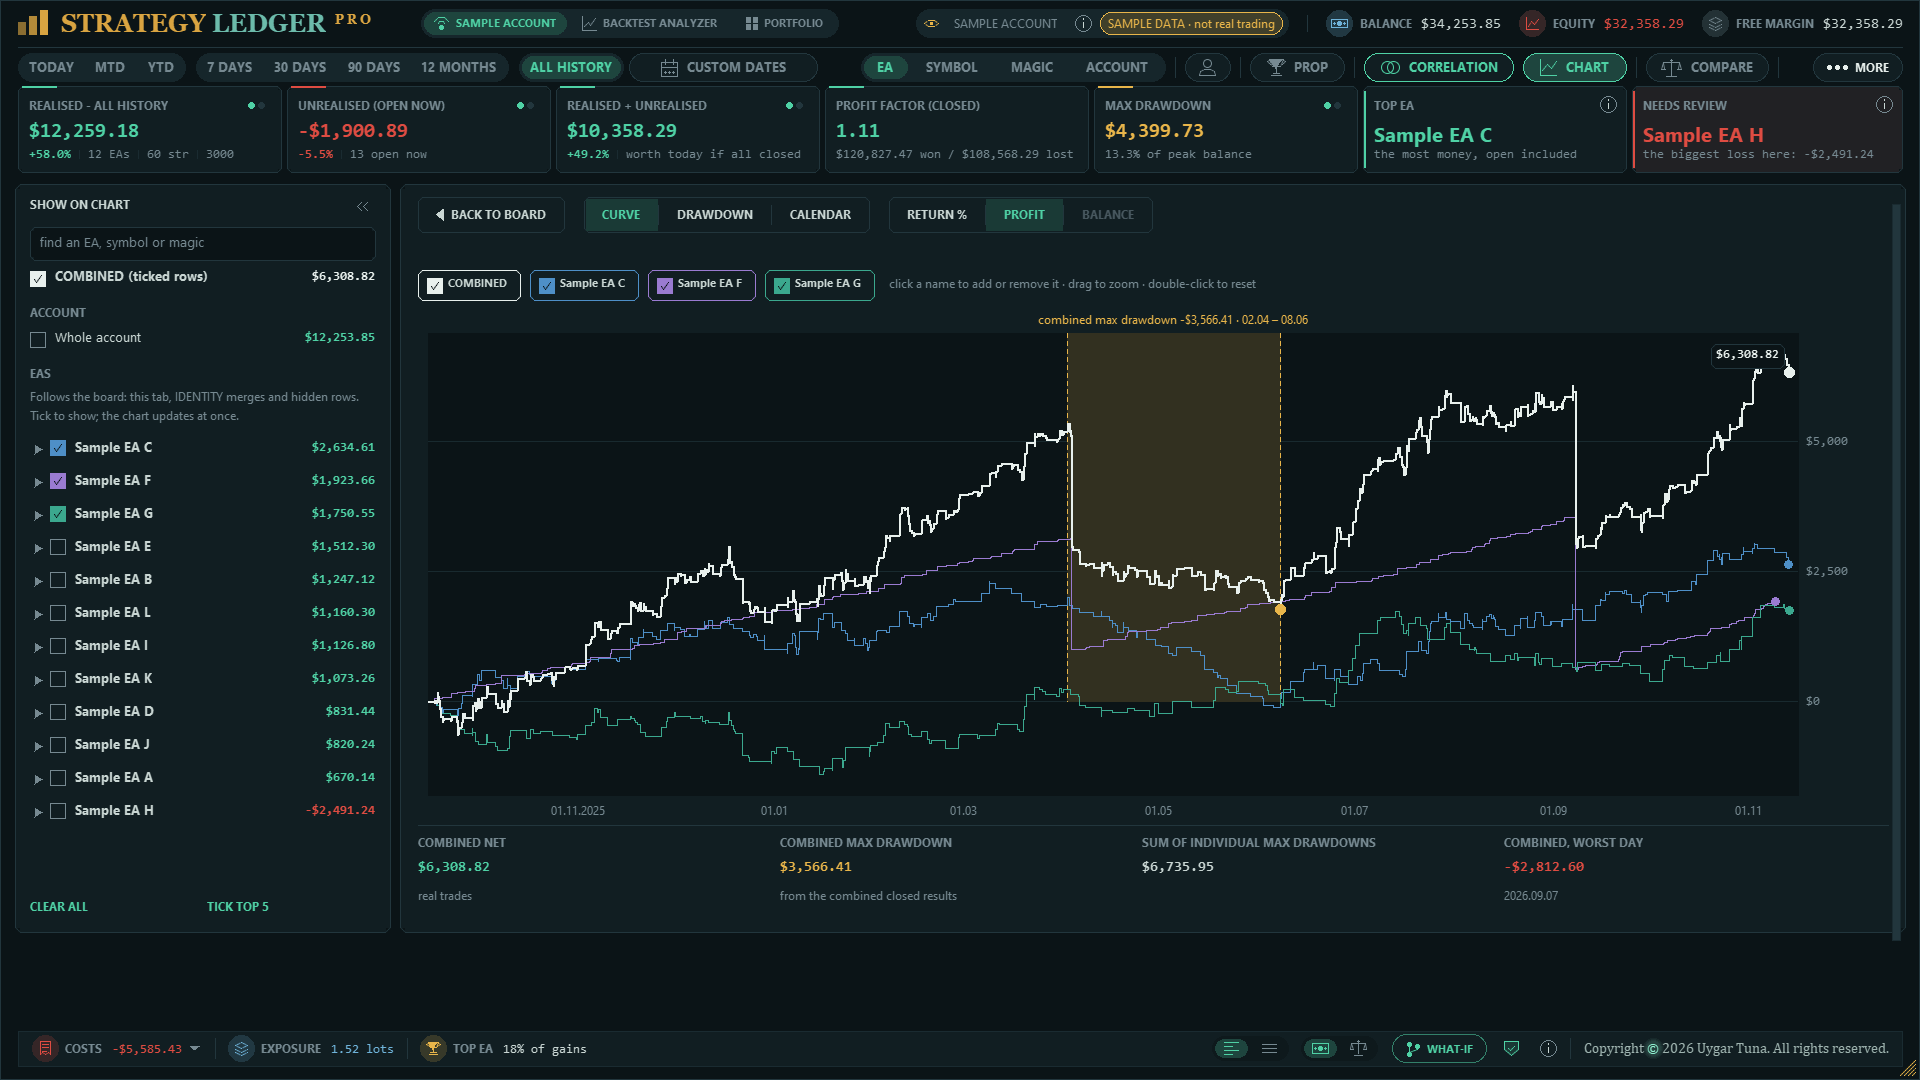
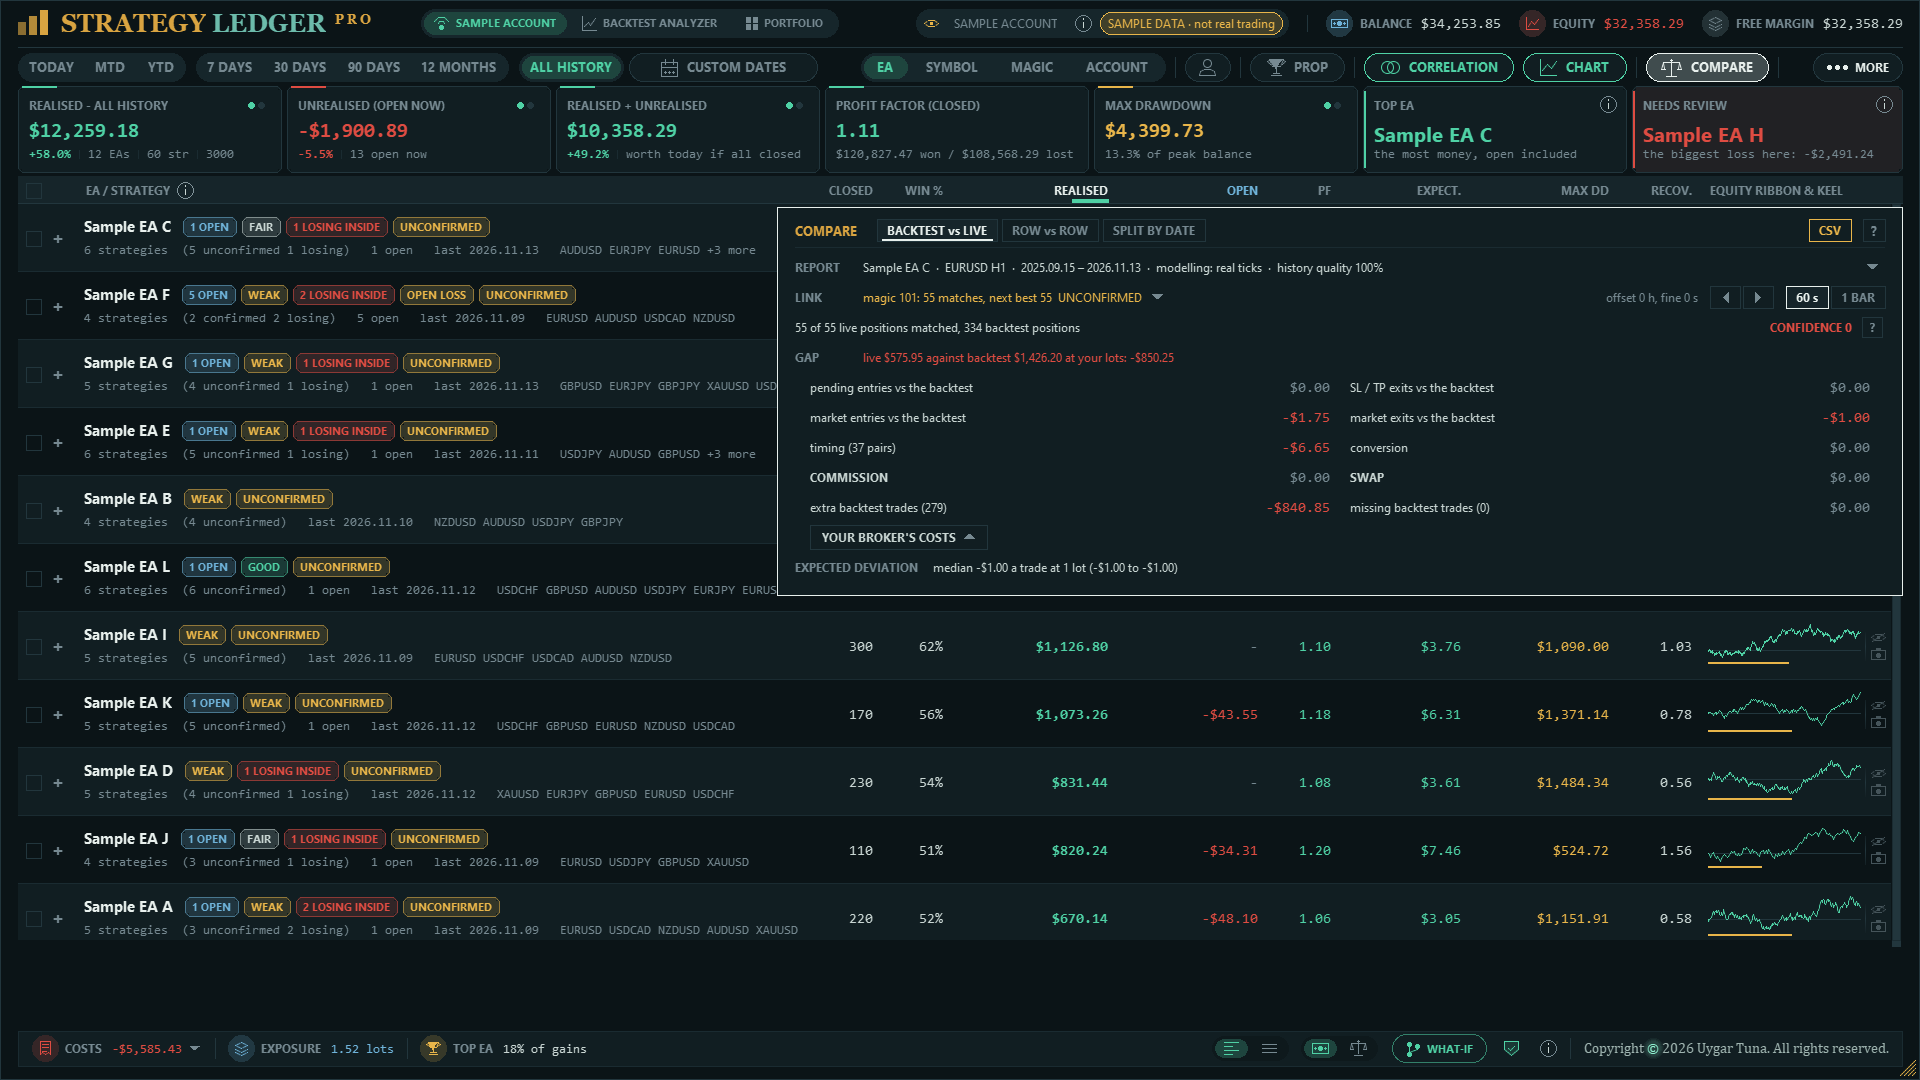
- A walkthrough in seven chapters: the ledger, one EA, the chart, costs and risk, a backtest report, What-if, and the portfolio.
- The real panel, not a video. When the walkthrough asks you to click something, the panel does what it would do on your own account, on the sample's data.
Nothing is read from the tester's account, and the panel writes no file while it shows the sample.
How to start it
- On the product page in the Market, download the demo version of Strategy Ledger Pro. MetaTrader 5 installs it under Experts › Market.
- Open the Strategy Tester (View › Strategy Tester, or Ctrl+R).
- Choose Strategy Ledger Pro as the Expert. Any symbol and any timeframe will do.
- Choose a long date range, for example the last year. The sample is shown for as long as the test runs, so a longer range gives you more time. The deposit and the modelling mode do not matter.
- Tick Visual mode (the option called "visual mode with the display of charts, indicators and trades").
- Press Start. When the chart opens, pull the speed slider down so the test does not finish early.
- The panel opens on the sample account with the first walkthrough box. Follow the box.
The walkthrough is written in all 11 of the panel's languages. To see it in yours, choose the language in the Expert's inputs before you press Start.
How the walkthrough works
- One step, one thing to look at. The panel dims, the control the step is about is lit, and the box says in one sentence what it does.
- SHOW ME runs the real action: it opens the EA, ticks the curves, loads the sample backtest report. You can also click the lit control yourself.
- After the action the box stays on the same step and points at the result; NEXT moves on.
- BACK returns to the previous step. SKIP THE TOUR closes the walkthrough and leaves you on the sample account.
- Step aside whenever you like. Click anywhere else and the walkthrough makes room; the panel works normally. CONTINUE THE TOUR brings it back where you left it, and after a minute without input it comes back by itself.
- Or just watch. If you click nothing, each step runs by itself after about 20 seconds, and the whole tour takes about a quarter of an hour. Give the test a date range and a speed that last longer than that.
- At the end you can START AGAIN or EXPLORE FREELY.
The seven chapters
- The ledger. Every EA on one board: closed trades, win rate, realised and open result, profit factor, drawdown, a grade and the status marks.
- One EA. The detail page: the verdict in plain words, the key cards, the equity curve trade by trade with monthly bars, and the hours and sessions in which it earns.
- The chart. Tick any mix of EAs or strategies and see each curve next to their combined result, with the combined drawdown marked.
- Costs and risk. What trading cost in commission, swap and slippage, and the open risk that a closed-trade balance does not show.
- A backtest report. A sample Strategy Tester report in the Backtest Analyzer, and the comparison of backtest against live.
- What-if. The same trades replayed at other sizes and costs, and the Sizing Optimizer.
- The portfolio. Several sample accounts on one page.
What the sample does not do
- It saves and sends nothing. The functions that write a file (CSV and audit exports, share cards, saved records) are switched off on the sample and answer "Not in the demo" when you click them.
- It ends with the test. When the visual test reaches its end date, the run stops and the panel with it. Start it again with a longer range or a slower speed.
- It is not your account. The sample's figures are invented to show every page with something on it. They say nothing about any Expert Advisor, broker or market, and nothing about what you will see on your own history.
On your own account
On a live or demo trading account the panel reads your own history and positions and shows the same pages with your data. It stays read-only there as well: it never places, changes or closes a trade.