USOIL — three timeframes, three different answers, one barrel of oil

Crude oil closed at 81.518 on Friday. Three charts of the same instrument, three different measurements, and they do not agree with each other.
That is not a fault in any of them. It is what happens when you ask three questions that only sound like the same question.
The monthly chart says accumulation

USOILm Monthly with Oscillator Regime Suite. Closed 2026.08.01 bar: CVD histogram 1,239,300.47 against an upper band of 184,290.57, Force histogram 2,409,573.17, regime bias 2.00 on all three panes.
The monthly volume oscillators — cumulative delta, Force Index and on-balance volume, each with adaptive bands — have been expanding upward since early 2026. The CVD histogram reads 1,239,300.47 against an upper band of 184,290.57, and the Force histogram 2,409,573.17. Regime bias sits at 2.00 on all three panes.
Volume has been arriving on the buy side, consistently, for months. On a monthly chart that is the slowest reading available and the hardest to reverse.
The weekly chart says neutral, leaning bearish

USOILm Weekly with Trend Survival Rate. Closed 2026.08.09 bar: state NEUTRAL, bull pressure 41%, bear pressure 59%, balance −18, survival rate 87.5%, forecast score 0.13.
On the weekly bar closed 9 August, the state classification reads NEUTRAL. Bull pressure 41%, bear pressure 59%, balance −18. The spread between the two pressure components is −4.8183, below its band centre of 4.8257.
The survival rate for that state is 87.5%, with a forecast score of 0.13 — better than a coin flip, which would score 0.25.
So the weekly says: slightly more selling than buying, and this state has historically persisted about seven times in eight. Neither bullish nor bearish. Genuinely undecided, and confident about being undecided.
The daily chart says four stops long, one short
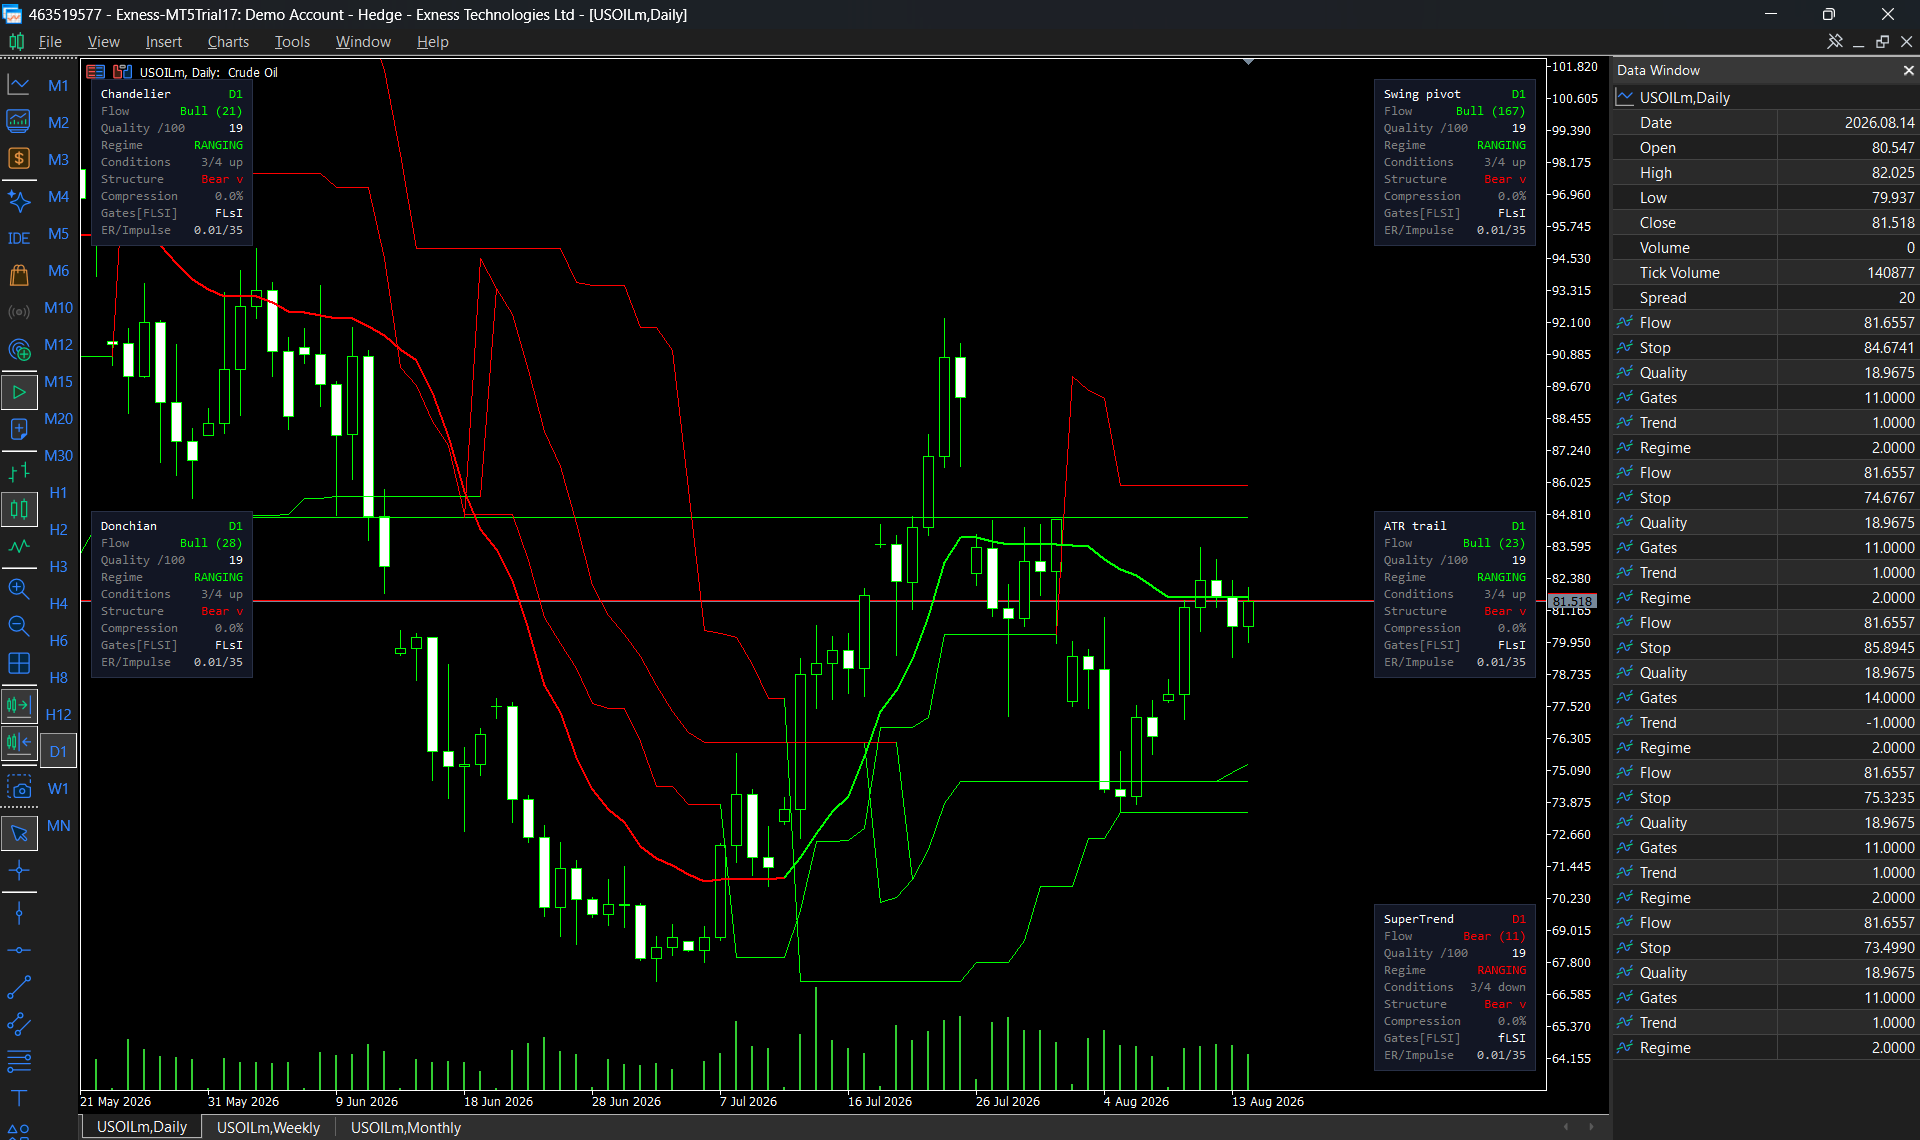
USOILm Daily with five instances of Structure Flow, one per trailing-stop method. Closed 2026.08.14 bar: swing pivot, Donchian, ATR trail and Chandelier all read bullish; SuperTrend reads bearish. All five report the regime as RANGING and the structure as bearish.
Five trailing stop methods on the same daily chart, same settings, five separate instances. Four read bullish — swing pivot for 167 bars, Donchian for 28, ATR trail for 23, Chandelier for 21. SuperTrend reads bearish, and has for 11.
All five agree on the context: the regime is RANGING, the structure is bearish, compression is 0.0% and the condition quality is 19 out of 100. They agree on everything except direction.
And the stop levels they would place are not close together. ATR trail sits at 85.8945, swing pivot at 84.6741, Donchian at 75.3235, Chandelier at 74.6767, SuperTrend at 73.4990. More than twelve dollars a barrel between the tightest and the widest, on one chart, on one bar.
Why this is the ordinary case, not an anomaly
Each measurement is answering a different question, and the questions have different time horizons built into them.
The monthly volume reading asks what has been accumulating over quarters. The weekly state asks what the pressure balance is right now against its own recent range. The daily stops ask where price would have to go to invalidate a position — and each method anchors that to something different: a swing low, a volatility band, a channel edge.
A trader holding for six months and a trader holding for six days are looking at the same chart and correctly seeing different things. The disagreement is information about horizon, not a contradiction to be resolved.
The reading that would actually be suspicious is all three agreeing. That happens in strong trends, and it is precisely when the disagreement would have been most useful to see.
What this does not tell you
None of these numbers say what oil does next. The monthly accumulation could continue or stall; the weekly neutrality could break either way; four bullish stops can all be taken out in one session.
A 87.5% survival rate is a statement about how often that state has persisted in the searched history. It is not a probability that it will persist tomorrow, and the forecast score exists so that the difference is visible rather than assumed.
What is on the charts
Oscillator Regime Suite — the monthly chart. Cumulative volume delta, Force Index and on-balance volume, each with adaptive bands and a five-state regime classification.
Trend Survival Rate — the weekly chart. Bull and bear pressure, a five-state classification, and how often the current state has survived to the next bar, scored against what actually followed. A free version, Trend Survival States, draws the identical pressures, spread, bands and states without the survival rate.
Structure Flow and Trailing Stop — the daily chart, five instances, one per method. Several can run on one chart, each with its own panel, which is how that screenshot was made.
All figures are from closed bars: the 2026.08.01 monthly, the 2026.08.09 weekly and the 2026.08.14 daily. A reader opening these charts later will see different numbers.
Charts are from my own terminal on Exness, where every indicator here is developed and tested. I am an introducing broker for them; broker notes are on my profile.