Your Broker's Hidden Bill: What Slippage, Swap and Commission Really Cost You

Every trade you place pays a bill. Some of it is printed on your statement: commission and swap. The largest part usually isn't printed anywhere. It hides inside the fill price, in the gap between the price your order asked for and the price it actually got. That gap is slippage, and MT5 never adds it up for you.
Here is what that bill looked like on one of my live accounts, running 12 EAs over the last 12 months.
A real account, 12 months

| Cost | Amount | Where you would normally see it |
|---|---|---|
| Slippage on entries | −€1,882.57 | nowhere |
| Slippage on exits | −€301.31 | nowhere |
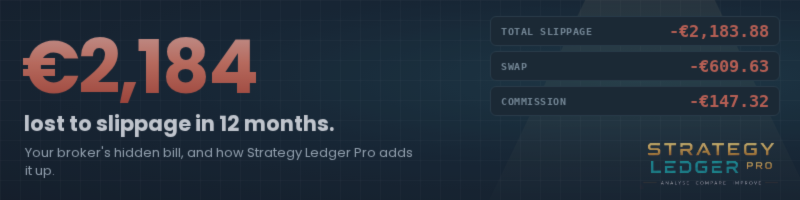
| Slippage, total | −€2,183.88 | nowhere |
| Swap | −€609.63 | one line per trade |
| Commission | −€147.32 | one line per trade |
| All costs together | −€2,940.83 |
Over the same 12 months the account realised +€6,405.94. In other words, the trades themselves earned about €9,347, and costs took €2,941 of it: almost a third. Slippage alone cost nearly three times as much as swap and commission put together.
Why scalpers feel it most
Slippage is charged per trade, not per euro of profit. A strategy that aims for small moves pays the same slippage as one that aims for large ones, so its share of the profit is far bigger.
One gold scalper on this account shows it clearly. Its entries slipped by €152.52 and its exits by €60.04, €212.56 in total. That is 30% of everything it moved. The worst single fill cost €5.77, over 40% of its average winning trade (€13.45). Its commission, by comparison, was only €14.56. On paper, it is an excellent EA. At this broker, almost a third of its edge goes to fills.
What Strategy Ledger Pro shows you
Strategy Ledger Pro rebuilds every position from your own history and adds up what MT5 leaves scattered:
- The whole bill in one line. The footer of the panel always shows commission, swap, entry slippage, exit slippage and the total, for the period you choose, across every EA on the account.
- Per EA and per strategy. Open any row and you get its own commission, swap, entry slip, exit slip, the worst single fill, and "slip drag": slippage as a share of what the strategy moved.
- Explained in plain words. The verdict under each row says how much slippage took and what share of the result that is, so a cost problem is never hidden behind a good profit factor.
- Measured honestly. Slippage is only counted where there was a price to compare against: pending entries, stop losses, take profits and pending exits. How many fills were measured is always shown next to the figure (here 1,069 of 1,932 entries). Market orders have no requested price, so the real total is likely higher, not lower.
- A broker execution report. Per symbol: slippage in both directions, whether the broker is fair (does it slip in your favour as often as against you?), execution speed, and a grade. It is the same method I described in my broker evaluation post.
The panel is read-only: it cannot place, modify or close trades, and nothing leaves your terminal.
Five questions to ask about your own bill
- What is my total slippage for the last 12 months, and how does it compare with my commission?
- Which EA pays the most, as a share of what it makes? Scalpers usually top this list.
- Is my broker fair? Good brokers slip in both directions; a broker that only slips against you is a warning.
- Which symbols are expensive? Gold and indices often cost far more to fill than major pairs.
- Would a different broker pay for itself? If slippage takes a third of your profit, a better execution venue may be the easiest improvement you can make.
See your own bill
You can't improve a cost you can't see. Attach Strategy Ledger Pro, pick a period, and read the footer.