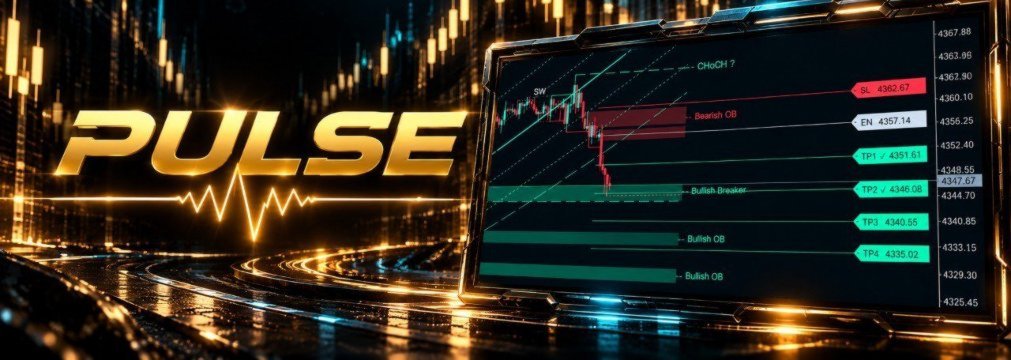
From Market Structure to Liquidity: Building a Structured Trading View with GAM Pulse

Market analysis often becomes complicated not because traders lack information, but because that information is scattered across too many tools.
Market structure may be analyzed with one method, liquidity with another, Order Blocks drawn manually, volatility checked separately, and potential Entry, Stop Loss and Take Profit levels calculated afterward.
The result can be a chart filled with information but lacking structure.
GAM Pulse was developed around a different idea: bring the most relevant analytical components into one organized environment while keeping price action readable.
1. Market Structure as the Foundation
Price structure provides context.
Before evaluating liquidity, Order Blocks or potential trade levels, it is useful to understand how price is structurally developing.
GAM Pulse continuously analyzes price structure and identifies:
- BOS — Break of Structure
- CHoCH — Change of Character
- Bullish structural development
- Bearish structural development
The objective is not simply to place labels on the chart.
The purpose is to create a visual map of structural changes so that other information can be interpreted within the correct market context.
2. Adding Liquidity to the Structure
Structure explains how price is developing.
Liquidity helps identify areas where price interaction may become important.
GAM Pulse detects and displays relevant liquidity zones and monitors how price interacts with them.
This includes:
- Bullish and bearish liquidity areas
- Liquidity zone detection
- Liquidity sweeps
- Active price areas
- Liquidity density information
A liquidity sweep alone should not automatically be interpreted as a trading decision.
Its value increases when it is viewed together with structure, location and the surrounding market environment.
This relationship between structure and liquidity is one of the central ideas behind GAM Pulse.
3. Order Blocks and Breaker Zones
Order Blocks provide another layer of market context.
GAM Pulse identifies bullish and bearish Order Blocks and integrates them with the broader structural view.
When an identified level is invalidated and later changes its role, the system can also classify it as a Breaker Zone.
Rather than displaying every historical zone indefinitely, the objective is to keep the chart practical and focused on relevant information.
The dashboard also provides information about nearby Order Blocks, allowing the trader to quickly evaluate their relationship to current price.
4. A Statistical View of Price
Structural analysis can also benefit from a statistical reference.
For this reason, GAM Pulse includes a dynamic linear regression channel calculated over recent price action.
The channel provides a visual representation of:
- The prevailing statistical direction
- The average path of recent price
- Deviation around that path
- How extended price may be relative to its recent behavior
The regression channel is not intended to replace market structure.
Instead, it adds another layer of context to the structural and liquidity analysis.
5. Volatility Matters
The same price movement can have a very different meaning under different volatility conditions.
GAM Pulse therefore monitors ATR-based volatility and presents it directly inside the dashboard.
A compact volatility sparkline also provides a quick visual representation of recent volatility behavior.
This allows structure, liquidity and volatility to be evaluated together rather than as completely separate elements.
6. From Analysis to Structured Trade Planning
Once the indicator identifies its configured setup conditions, GAM Pulse can display a structured trade framework directly on the chart.
The framework can include:
- Entry Level
- Stop Loss
- TP1
- TP2
- TP3
- TP4
These levels provide an organized visual framework for evaluating a potential setup.
They are analytical outputs — not guarantees of execution or profitability.
The trader remains responsible for deciding whether the market conditions, risk profile and overall context justify taking any trade.
7. Why Closed-Bar Confirmation Matters
Intrabar price movement can change significantly before a candle closes.
A structure that appears broken during an unfinished candle may look very different once that candle is complete.
For structural confirmation, GAM Pulse therefore uses confirmed closed-bar information.
This reduces the influence of unfinished candle movements on confirmed structural events and provides a more stable representation of market structure.
8. One Dashboard Instead of Multiple Indicators
The goal of GAM Pulse is not to maximize the amount of information displayed.
It is to organize it.
The compact dashboard provides an overview of:
- Market Direction
- Current ATR / Volatility
- Volatility behavior
- Liquidity Zone Density
- Nearby Order Blocks
The chart remains the primary workspace while the dashboard provides supporting information without unnecessarily covering price action.
A Structured Analytical Environment
Market Structure, Liquidity, Order Blocks, Breaker Zones, Volatility and statistical price behavior are different concepts.
The important part is not simply detecting each one individually.
The challenge is understanding how they interact.
That is the philosophy behind GAM Pulse:
Analyze the Structure.
Track the Liquidity.
Follow the Pulse.
GAM Pulse for MetaTrader 5
View GAM Pulse on the MQL5 Market
Risk Disclaimer
GAM Pulse is a chart-based analytical and decision-support tool for MetaTrader 5. It does not execute trades or guarantee future market performance.
All analytical outputs, zones, Entry, Stop Loss and Take Profit levels are provided for informational and analytical purposes only.
Traders remain responsible for their own trading decisions and risk management.