When a Great EA Starts to Fade: Catching Decay Before It Costs You

The most expensive moment in an EA's life is not its worst drawdown. It is the quiet stretch before it, when the overall record still looks excellent but the edge has already started to shrink. By the time the total turns red, the fading has usually been going on for weeks.
The problem is that almost every statistic you look at is an average over the whole history. A great start keeps the average high long after the strategy has stopped delivering. Here is a real example, and how to catch it early.
A real example: excellent on paper, fading underneath

This gold scalper on one of my live accounts has everything a trader wants to see:
- 56 closed trades, 48 won and 8 lost: an 86% win rate;
- a profit factor of 9.85 and a recovery factor of 29.75;
- a t-stat of 4.50, meaning its results are very unlikely to be luck;
- +€579.90 realised, a score of 100/100 and an EXCEPTIONAL rating.
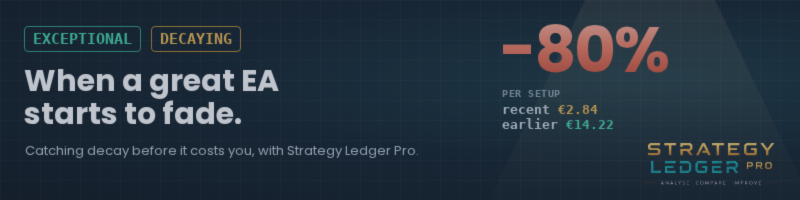
Right next to that rating sits a second badge: DECAYING. The verdict explains why in one sentence: its recent setups average €2.84, where earlier ones averaged €14.22. That is about 80% less per trade. The monthly chart tells the same story: €513 in its first month, and about €67 since.
Both statements are true at the same time. The EA's history is exceptional. Its present is not.
Why "a bad week" is not enough to call it
Every EA has losing streaks, and reacting to each one is its own mistake. The question is whether the recent drop is bigger than normal randomness would produce.
Strategy Ledger Pro answers it with a trend test. It compares recent setups with earlier ones and measures how unusual the difference is. The result is the TREND figure, here −3.04. A strategy is only marked DECAYING when that figure passes −1.96 (the usual 95% line) and it has at least 30 setups behind it. One bad week can't trigger it; a sustained change can.
It also counts setups, not raw positions. Trades opened together, such as a grid's levels, count as one decision, so a busy grid can't fake a trend in either direction.
What Strategy Ledger Pro shows you
- Both badges, side by side. EXCEPTIONAL and DECAYING appear together. The panel never hides a warning behind a good overall grade.
- The reason, in plain words. The verdict gives the recent and earlier averages, so you can judge the size of the drop yourself.
- The likely suspects, on the same screen. Here the verdict also notes that slippage has taken €212.56, 30% of everything the strategy moved. For a scalper whose edge per trade is shrinking, rising costs are the first thing to check.
- Month by month. The monthly net chart and the cumulative grade show when the change began.
- Grade history. Every month's grade is kept, so a slide from EXCEPTIONAL to GOOD to FAIR is visible as it happens, not only afterwards.
- Luck, measured. A Monte Carlo reshuffle of its closed trades shows how deep a drawdown ordinary bad luck could produce (here €29.20), so you can tell a normal dip from a real change.
The panel is read-only: it cannot place, modify or close trades, and nothing leaves your terminal.
What to do when an EA starts to fade
- Don't switch it off on a feeling. Check that the decay is statistically real (the DECAYING badge does this for you).
- Check the costs first. If slippage or spreads have grown, the strategy may be fine and the execution is the problem.
- Compare with its backtest. Load the tester report into the Backtest Analyzer. If the backtest also fades in the same period, the market has changed; if it doesn't, look at execution and settings.
- Reduce size before you remove it. A smaller lot keeps the strategy under observation at lower risk while the evidence builds.
- Keep watching the grade history. Decay that reverses shows up there just as clearly as decay that continues.
Catch it early
An EA rarely fails overnight. It fades first, and the fade is measurable long before the total turns red.