

Daily Market Analysis: Blind Spots in Execution Logic.
Each trading session generates new trading signals. Price fluctuations activate indicators, and automated systems react. Most intermediate traders using MT5 don't underestimate the quality of the signals themselves; rather, they overlook the gap between receiving a signal and responsibly executing it based on current market conditions. This gap is a blind spot in the execution logic. Bridging this gap determines whether the automated system functions as a decision support tool or entrusts trading risk to a system that doesn't consider current market conditions.
This article is based on content published by Bloomberg Markets Daily . Bloomberg Markets Daily tracks the performance of stock, bond, foreign exchange, and commodity markets and analyzes factors that may influence these markets in the future. This article uses a structural analysis approach, rather than predictive analysis. When the conditions of multiple assets change simultaneously, the basic assumptions of most professional advisory services for retail investors no longer apply, necessitating a deeper analysis of trade execution logic.
1. What the source actually said.
Bloomberg Markets Daily is a professional newsletter focusing on real-time trends in the stock, bond, foreign exchange, and commodity markets, providing analysis of the factors most likely to influence the markets in the future. It does not offer buy or sell signals, but rather provides background information on current market conditions, not a market entry guide.
This distinction is crucial. Technical data tables describing market fluctuations indicate the conditions under which professional tools operate , not whether entry conditions for a trade are met. Most automated systems are designed to assess the second question: whether entry conditions are met. Almost all systems execute trades after evaluating entry conditions.
To correctly interpret market information sources, such information must be viewed as input signals that filter market conditions, rather than triggering factors. Confusing these two concepts will create blind spots in the workflow execution logic.
2. Why is this important for traders using MT5?
MetaTrader 5 is a long-established order execution platform with a sophisticated event-driven architecture. Through its Expert Advisor (EA) framework, traders can automate entry and exit points, position management, and risk management with remarkable precision. However, these powerful features also come with specific risks. Specifically, the system is more likely to function correctly even in environments not originally designed for it .
Let's look at the following example scenario.
- Your EA uses trend-following logic based on moving average crossovers and is confirmed by ATR extension.
- The release of macroeconomic indicators exacerbated intraday volatility in the stock market.
- Sharp fluctuations in bond yields have led to a narrowing or widening of currency spreads.
- As news of the proposed terms spread, raw material prices surged as soon as the market opened.
In this context, ATR-based stop-loss calculations can utilize historical analysis periods that reflect relatively stable environments. Even if the candlestick body is formed by a single news event rather than a sustained one-sided trend, crossover signals may still appear. This system is effective, and its logic is technically sound. However, it is rarely executed correctly.
The concentration of volatility across multiple assets is a well-known structural characteristic of financial markets. In this context, execution logic designed for a specific volatility environment can produce drastically different results in other environments. This is not due to a flaw in the code itself, but rather because its fundamental assumptions no longer hold true.
If an MT5 trader reads the Daily Markets and immediately asks, "What should I trade?", then that's the wrong question. The correct question is: "Does what I've read confirm that the assumptions of my current Expert Advisor (EA) trading model are still valid?"
3. A common mistake in automation is assuming that "one method works for all situations".
The most common mistake intermediate MT5 traders make when implementing automated systems is assuming that a system optimized for specific market conditions will be universally applicable to all market conditions. This assumption is inherent in the standard process of developing Expert Advisors (EAs) for retail investors.
The development cycle is generally as follows.
- Choose a strategic concept.
- Please conduct a retrospective survey.
- Optimize parameters to obtain the best Sharpe ratio or profitability metric.
- Try it out on a demo account first.
- Actual operation and implementation.
Note the missing part. The developers did not ask questions such as "Under what market mechanism does the system operate, and how do we determine when that mechanism ends?" It seems that the definition of the market mechanism is treated as an optional parameter, or implicitly handled by the optimizer. However, this is not the case.
The optimizer identifies the set of parameters that produces the best results during the analysis period. If the period exhibits a stable trend, the optimizer returns parameters that match that trend. When the market enters a mean-reverting pattern, these parameters remain unchanged, and losses accumulate until the trader intervenes manually or the system's stop-loss limit is reached.
The error in the automation process lies not in using the intelligent advisor, but in using it without imposing pattern constraints—that is, without meeting the conditions that must be observed and measured before the intelligent advisor can run.
4. Technological causal relationships
To understand why inconsistencies lead to losses, and not just decreased efficiency, it is useful to analyze causal relationships at the performance level.
Step 1: Generate a signal in an incorrect context.
Most trading guidance programs aimed at individual investors use price indicators such as moving averages, Relative Strength Index (RSI), Moving Average Convergence/Divergence (MACD), Bollinger Bands, and Average True Range (ATR) to generate trading signals. These indicators are descriptive summaries of past price fluctuations. Therefore, when the price formation process changes (e.g., from a trending market to a volatile market, or from a low-volatility market to a high-volatility market), the trading guidance program cannot detect this change and will adjust the indicator output values accordingly.
Step 2: Stop-loss correction failed
Stop-loss orders based on ATR are a common method, but they rely on a subtle assumption: that the ATR lookup period accurately reflects the volatility the trade will face. When market conditions change, the rate of increase or decrease in volatility may exceed the adjustment rate of the ATR lookup period. In periods of low volatility, setting the stop-loss at 1.5 times the ATR (14) may fall within the normal range of volatility in a new period of high volatility. The trade may close not because of a trend reversal, but because the stop-loss is no longer suitable for the current market conditions.
Step 3: Expand the scale of the position.
When calculating position size by dividing a certain percentage of account assets by the stop-loss distance (in points), the narrower the stop-loss range calculated based on ATR, the larger the position size. In a highly volatile market environment, such a large position faces greater price volatility risk, which contradicts the original intention of adjusting position size according to risk.
Step 4: Slide to execute and expand coverage
When asset prices fluctuate, spreads between brokers tend to widen. Advisors who have placed limit orders may execute trades at very unfavorable prices, negating the statistical advantage that limit orders are supposed to provide. This factor is rarely considered in strategy backtesting because most backtesting strategies assume constant spreads.
Step 5: Calculate the interest on simultaneously opened positions.
When a financial advisor manages multiple positions simultaneously, the differences between the various options become more pronounced. The correlation between financial instruments tends to increase during periods of high market volatility, meaning that a portfolio that appears diversified during stable market times may become risk-concentrated in specific instruments during periods of market turmoil.
The causal relationship is as follows: Signal generation → Incorrect stop-loss setting → Incorrect volume setting → Slippage leading to decreased input quality → Underestimation of correlation → Accelerated downtrend. None of these steps require errors in the automated trading system's code. All problems stem from the same cause: the trading pattern has changed, but the automated trading system lacks a detection mechanism.
5. How to test in MetaTrader 5: Workflow using a demo account
This algorithm is designed for advanced traders using the MT5 platform and aims to help existing and new Expert Advisor (EA) developers improve their understanding of market patterns. All testing must be conducted on a demo account before applying it to a real trading environment.
Step 1: Determine the mode filter using ATR coefficients.
A simple and verifiable pattern filter compares the short-term Average True Range (ATR) with the long-term ATR. If this ratio exceeds a certain threshold, the market is considered to be in a high-volatility pattern, and the Expert Advisor (EA) should stop making new entries. The following pseudocode illustrates this logic. This pseudocode is conceptual and has not yet been compiled.
// Pseudocode — Uncompiled MQL5 code snippet // Only explains the concept of pattern filters. int handleATRShort = iATR(_Symbol, PERIOD_CURRENT, 5); int handleATRLong = iATR(_Symbol, PERIOD_CURRENT, 50); double bufShort[], bufLong[]; CopyBuffer(handleATRShort, 0, 0, 1, bufShort); CopyBuffer(handleATRLong, 0, 0, 1, bufLong); double ratioVolatility = bufShort[0] / bufLong[0]; bool regimePermitsEntry = (ratioVolatility < 1.5); // If ratioVolatility >= 1.5, then the short-term volatility is 50% higher than the long-term average. // Suppress new entries until the ratio normalizes.
The 1.5 threshold is for illustrative purposes only. A suitable threshold should be determined by analyzing the historical distribution of the ATR ratio for a specific financial product, rather than using a generic value.
Step 2: Add a scatter plot check before each item.
In MQL5, you can use SymbolInfoTick to get the current spread, compare it with the maximum allowed spread, and then open a position.
// Acceptable use cases for the MQL5 API - Conceptual example of MqlTick currentTick; if(SymbolInfoTick(_Symbol, currentTick)) { double spreadPoints = (currentTick.ask - currentTick.bid) / _Point; double maxAllowedSpread = 20.0; // Unit is points - adjusted according to the trading instrument if(spreadPoints > maxAllowedSpread) { Print("Spread too large:", spreadPoints, " points. Input suppressed."); return; // Exit the OnTick or OnBar event without executing the order. } }
This test can identify significant losses due to slippage during periods of high trading volatility. It is observable, auditable, and applicable to specific financial instruments.
Step 3: Verify that the position size is consistent with the position size adjusted by ATR.
Before calculating the trading volume, use the CopyBuffer function with the ATR identifier to obtain the current ATR value. When filtering by pattern, during periods of high volatility, use the long-term ATR value (or the higher of the short-term and long-term values) to set stop-loss orders. This prevents the problem of insufficient stop-loss order size due to the aforementioned cause-and-effect relationship.
// Pseudocode - Select stop distance based on pattern. double atrShort = bufShort[0]; double atrLong = bufLong[0]; // Conservatively adjust the stop point size using the larger of the two values. double atrForSizing = MathMax(atrShort, atrLong); double stopDistancePoints = atrForSizing * 1.5 / _Point;
Step 4: Run the strategy testing tool for different date ranges.
When running an expert trading system in the MT5 strategy tester, select at least three historical periods representing different volatility environments for testing. Do not optimize all three periods simultaneously; instead, apply the parameters obtained from the first period directly to the second and third periods without any adjustments. A decrease in parameter values under different volatility environments is the most obvious indicator of system instability in those environments.
Step 5: Use the "Logs" and "Experts" tabs during the demo run.
When testing futures trading on a demo account, configure your Expert Advisor (EA) to log information such as pattern filter status, spread verification, and ATR value for each candlestick. After each trade, review these logs to verify that the gateway is functioning correctly and identify the periods during which the EA suppressed trades that would otherwise have been executed without filters.
6. A practical checklist for decision-making: observable control points and termination conditions.
The following checklist is intended for use before each run of the automated trading system. It contains a series of observable checks. If any check fails, you must immediately stop using the system and monitor your demo account until things return to normal.
| Door | Items to be checked | What to do if the door is broken |
|---|---|---|
| Gates of Power | Is ATR(5) / ATR(50) below the corrected threshold? | Pause adding new entries and manually manage existing transactions. |
| Extended shutter | Is the deviation of the current measurement within the normal range of the measuring equipment? | Please ensure that the advisor does not open any new positions until the price spread returns to normal. |
| Related Doors | Are there any abnormal synchronous fluctuations in the trading instruments managed by your automated trading system? | Reduce the maximum number of simultaneous localizations to 1 until the correlation decreases. |
| Newsgate | Is there a major version release in the next 30 minutes? | Suspend EA trading or set a period of no trading before or after the release date. |
| Water level drop valve | Is the current rate of descent within the set limits? | If you reach your limit, please stop using the advisory service until the session ends. Please check the results before your next session. |
| Parameter aging prevention mechanism | When was the last time you checked the EA parameters using the latest data? | If more than 60 days have passed since the last inspection, the system is considered to have not been maintained and can only be used in demo mode. |
Each checkpoint represents a specific link in the causal relationship described in Section 4. Completing this checklist will take approximately 5 minutes. Skipping this checklist during periods of high asset volatility is a common cause of unnecessary losses, even for technically seemingly perfect automated systems.
7. Things to do before the next class.
Market information from sources such as Bloomberg Markets Daily covers price movements in stocks, bonds, currencies, and commodities, as well as factors that may influence the future performance of these markets. When used properly, this information can serve as a benchmark to assess whether the assumptions of an automated trading system remain valid for the next trading day.
Before opening MT5
- Don't just treat daily market analysis data as a series of signals; use this data to understand its context.
- Pay attention to asset classes that are described as having increased or unusually active trading.
- Ask yourself a simple question. Which of the following indicators suggest that my advisor's assumptions about volatility, trends, or correlations are at risk?
When opening MT5
- Before using an Expert Advisor (EA) for actual trading, please complete all 6 steps on the checklist.
- View the current ATR ratio for each financial instrument covered by your EA.
- Compare the current variance value with the maximum value set on the device.
- Please check if the door status is accurately recorded in the expert log.
During the meeting
- Regularly monitor the activity logs of your automated trading system. Do not assume the system is functioning correctly just because no alerts are generated.
- If an Expert Advisor (EA) initiates a trade when price spreads spike or data is released, this should not be considered an isolated anomaly that can be ignored, but rather a systemic error that must be corrected before the next trading day.
After class
- Review all trades executed by your Expert Advisor (EA). For each trade, confirm that the entry method, spread, and news conditions are met.
- All transactions that occur during periods when the risk control system is malfunctioning, even if profitable, must be recorded. A profitable transaction resulting from a violation of the risk control system does not prove that the system was unnecessary, but rather demonstrates that risk management should not be evaluated on a per-transaction basis.
- If you have already checked the EA's default parameters, please update the parameter expiration record to the current date.
Basic principles
A single signal is insufficient. The signal activation method, the execution conditions when the order is executed, and the risk management mechanisms related to position size and stop-loss order settings all jointly determine the effectiveness of actions taken based on that signal. Automated systems can consider these three factors, but only if they are explicitly created and maintained.
Blind spots in execution logic are not signal errors, but rather stem from a failure to assess whether the underlying signal architecture aligns with current market conditions. Eliminating these blind spots is the task of well-trained intermediate traders, which begins with checklists, demo accounts, and objective assessments of how current market conditions affect system assumptions.
Analysis Notes: The strategy logic, thresholds, and code examples provided in this document are for illustrative and analytical purposes only. They do not constitute investment advice, nor do they imply, promise, or guarantee any specific financial or other results. Before implementing the strategy in a real trading environment, be sure to test it on a demo account and familiarize yourself with the relevant regulations before trading leveraged products.
The specific steps are as follows. If you wish to evaluate this mechanism without applying the same strategy to all market conditions, try using the MT5 system included in the Ratio X Trader Toolbox, which is specifically designed for various tasks. Use the demo version to observe how the pattern- and volatility-based workflow applies to the situations described above.
Actual screenshots from Ratio X users
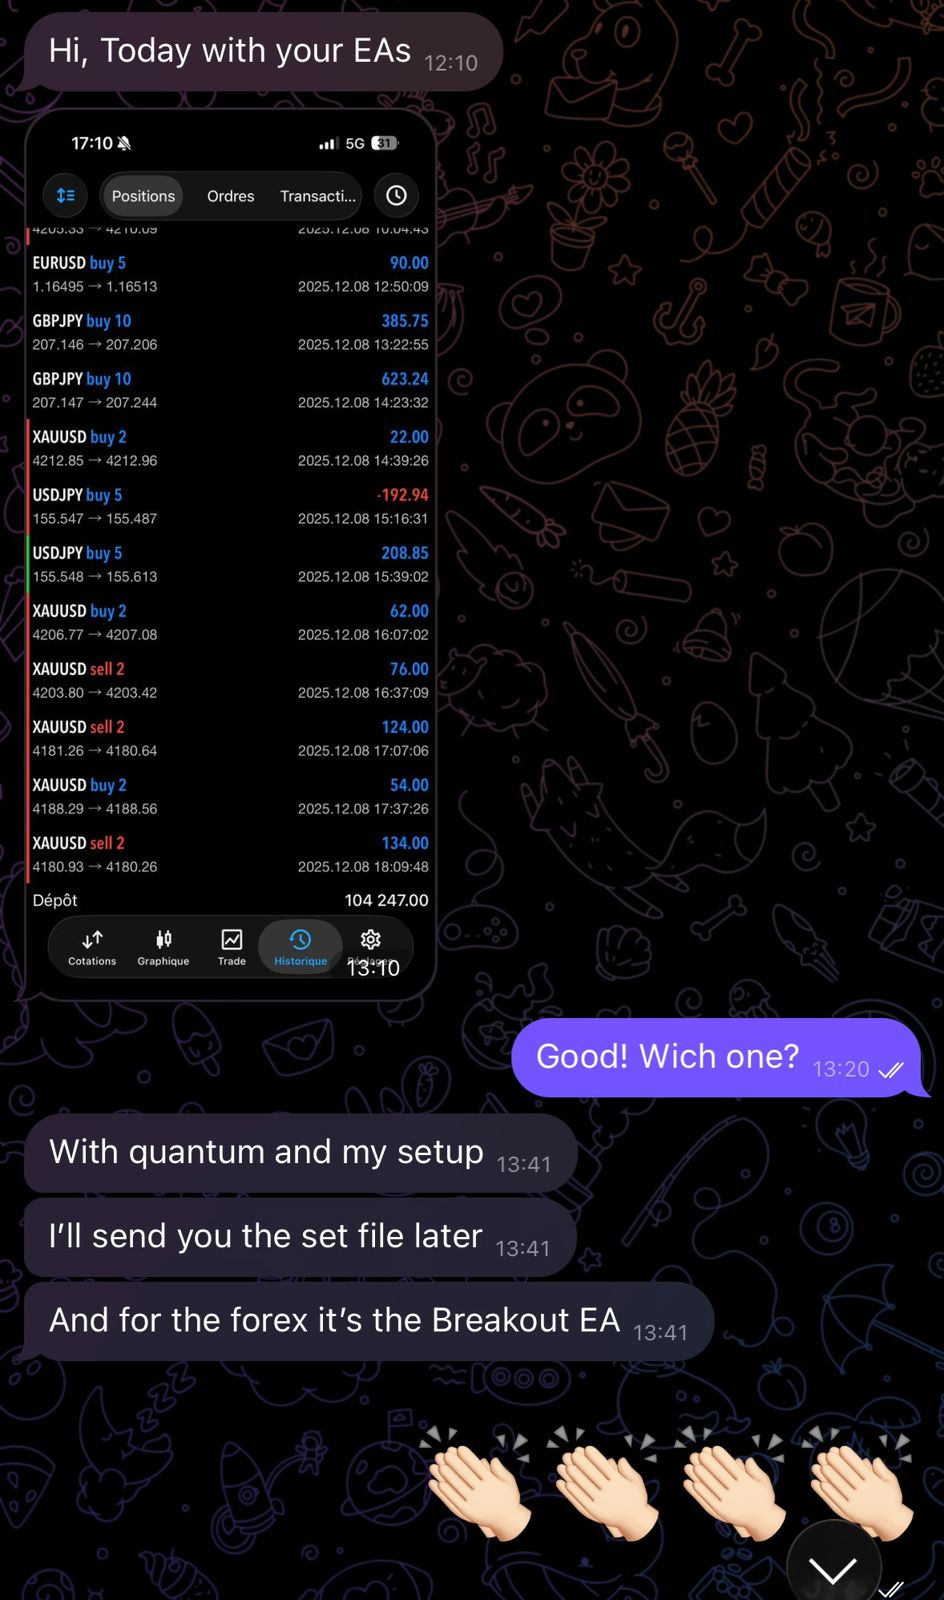 Multiple pairs of devices can operate simultaneously and be used by the same Ratio X user.
 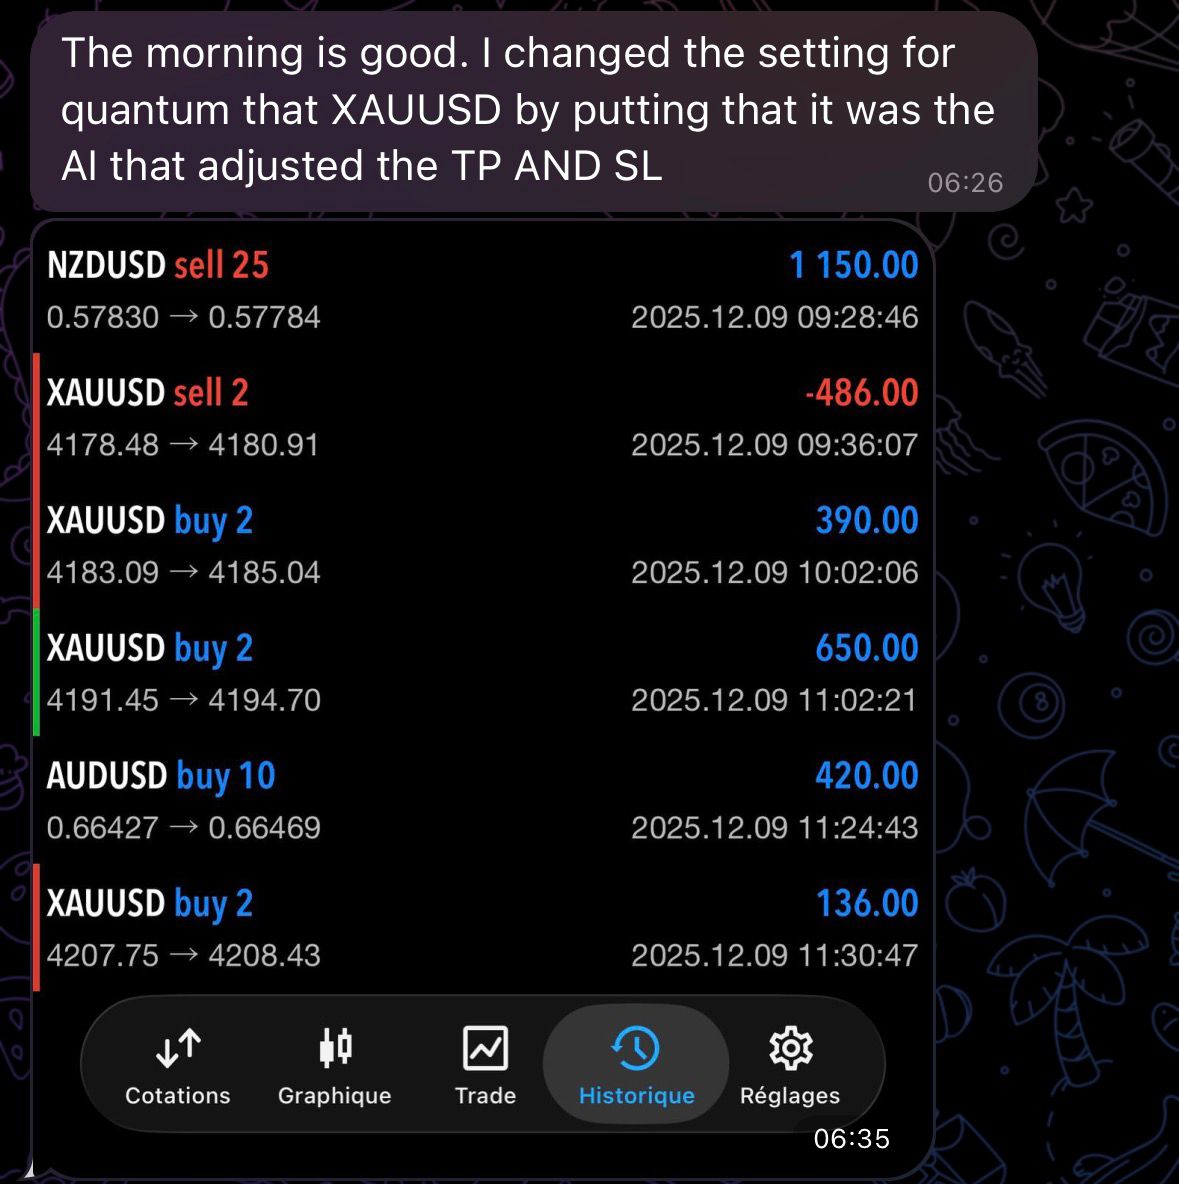 According to user Ratio X, AI Quantum is adjusting its profit-taking and stop-loss levels.
 This screenshot is a real image shared by a Ratio X user. It represents only the result of an individual case and does not represent a general or guaranteed result. Trading in financial markets involves the risk of loss.
Try out the Ratio X Trader toolkit with a demo account.
The Ratio X Trading Toolkit integrates 10 professional systems (including indicators) for analyzing the patterns, trends, ranges, breakouts, order execution, and trading process of the XAUUSD currency pair. This tool is intended to provide systematic analysis and does not guarantee trading results.
For a one-time payment of $147 , you can enjoy this service for life, with a 7-day money-back guarantee . You can try out the appropriate modules in the demo, follow the installation instructions, and determine if it meets your needs.
Please see the ratio X operator toolkit.
If you're looking for a toolbox set and price is your only consideration, use promo code MQLFRIEND20 to enjoy a 20% discount . Only 10 coupons available each month.


