

This manual covers everything a trader needs to install, configure, and use Shadow Flare Indicator in day-to-day trading. Read it once end-to-end, then keep it as a reference for the input dialog and the dashboard.
Download the indicator:
- MetaTrader 5: Shadow Flare MT5
- MetaTrader 4: Shadow Flare MT4
Section 1 — What You Get
A purchased copy of Shadow Flare Indicator includes:
- The compiled MetaTrader 4 build ( Shadow_Flare_Indicator.ex4 )
- The compiled MetaTrader 5 build ( Shadow_Flare_Indicator.ex5 )
- Free version updates for the lifetime of the product, delivered through the automatic MQL5.com synchronisation pipeline
- This manual and the companion educational article on the MQL5.com blog
Both builds expose the same input list, produce the same visual output on the same symbol and timeframe, and respond to the same alert configuration. A trader who learns one build does not have to relearn the other.
Section 2 — Installation via the MQL5.com Market
Shadow Flare is distributed through the MQL5.com Market, which means installation happens automatically and there is no need to copy any file manually.
- Open MetaTrader 4 or MetaTrader 5
- Sign in with the same MQL5.com account that purchased the indicator (Tools → Options → Community)
- Open the Market panel (CTRL+M, or View → Market)
- Click the Purchased tab — Shadow Flare Indicator will be listed
- Click Install — the platform downloads the compiled file directly into the correct folder and refreshes the Navigator
- Open the Navigator (CTRL+N) and expand Indicators → Market — the indicator appears under that node
There is no manual copying of files into MQL4/Indicators/ or MQL5/Indicators/ , and no need to restart the platform. The Market install pipeline also handles future updates: when a new version is published, the platform synchronises in the background without any trader action.
If the Purchased tab does not show the indicator, verify that the MQL5.com account signed into MetaTrader is the same account that made the purchase. If it is, click the refresh button at the top of the Market panel.
Section 3 — Adding the Indicator to a Chart
Once installed:
- Open any chart (any symbol, any timeframe)
- Open the Navigator (CTRL+N)
- Expand Indicators → Market
- Drag Shadow Flare Indicator onto the chart, or right-click and choose Attach to chart
The Inputs dialog appears immediately. The defaults are tuned to be reasonable on EURUSD H1, but they work without modification on every symbol and timeframe — the trend cloud is ATR-scaled, so volatile pairs automatically get wider envelopes.
To use the indicator with default settings, click OK. To customise it before the first attach, switch to the Inputs tab and adjust the parameters described in Section 5.
After you click OK, the indicator computes the historical buffers, draws supply / demand zones for the most recent pivots, and renders the dashboard in the top-right corner. The first calculation may take a moment on charts with very long history; subsequent ticks update only the latest two bars.
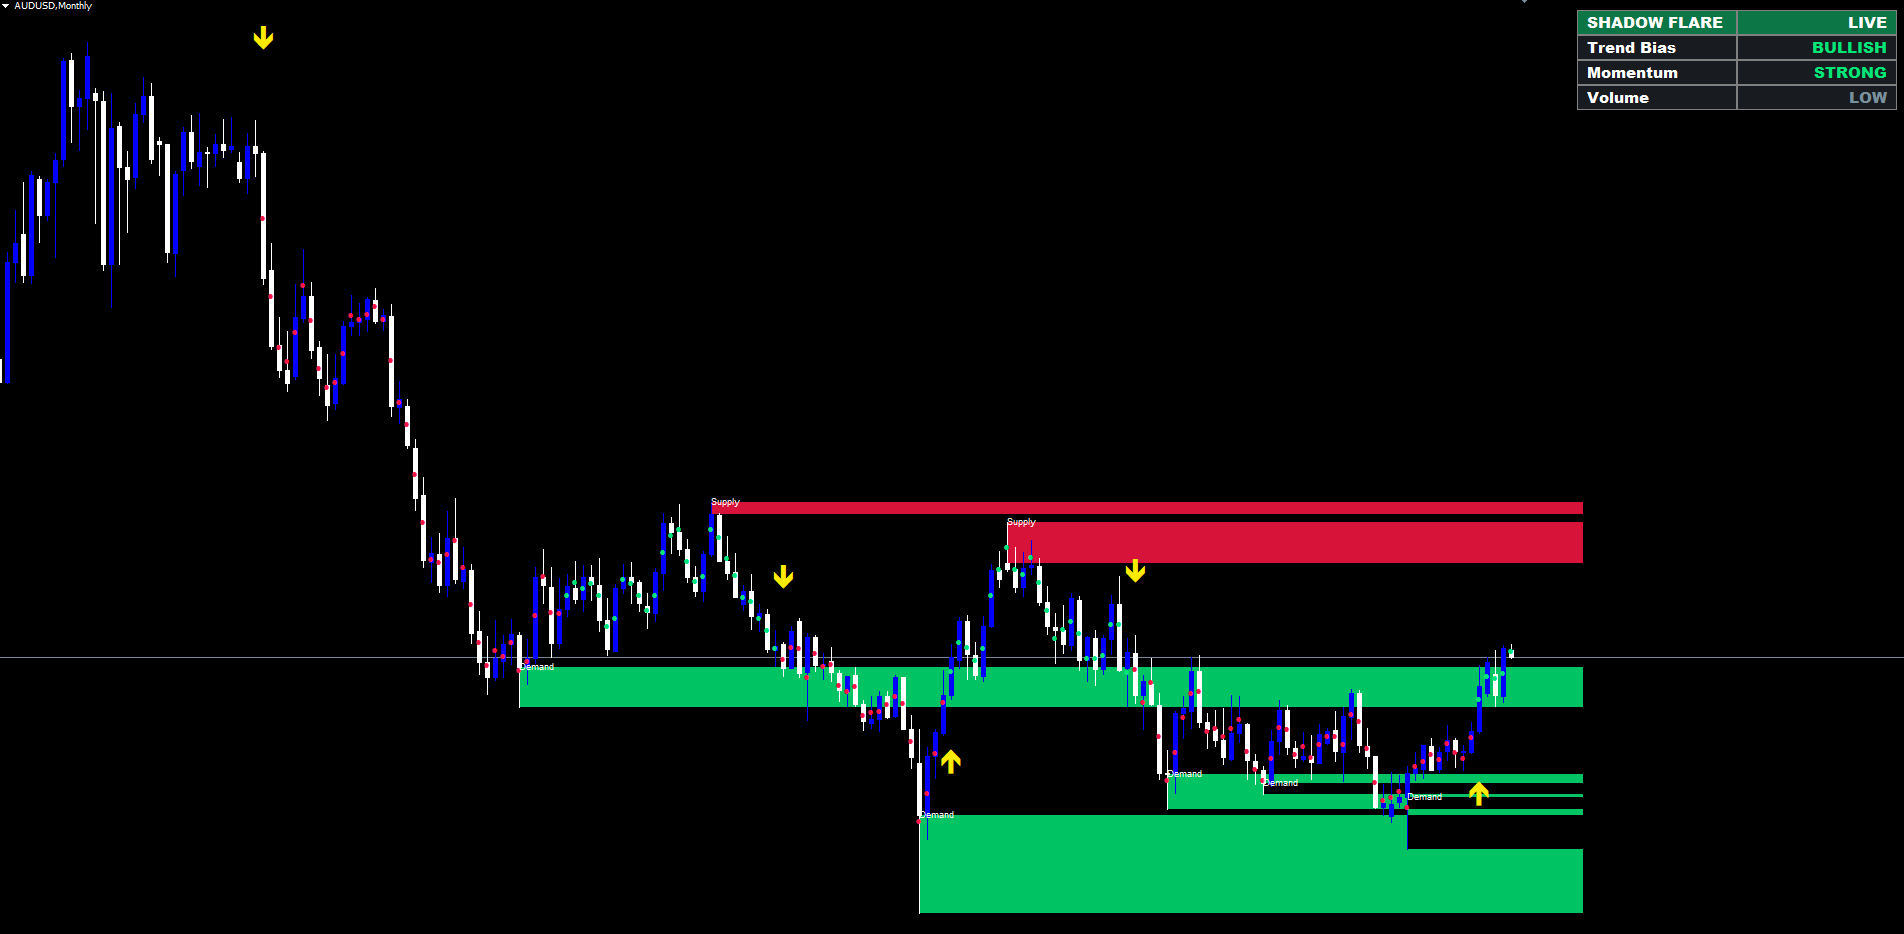
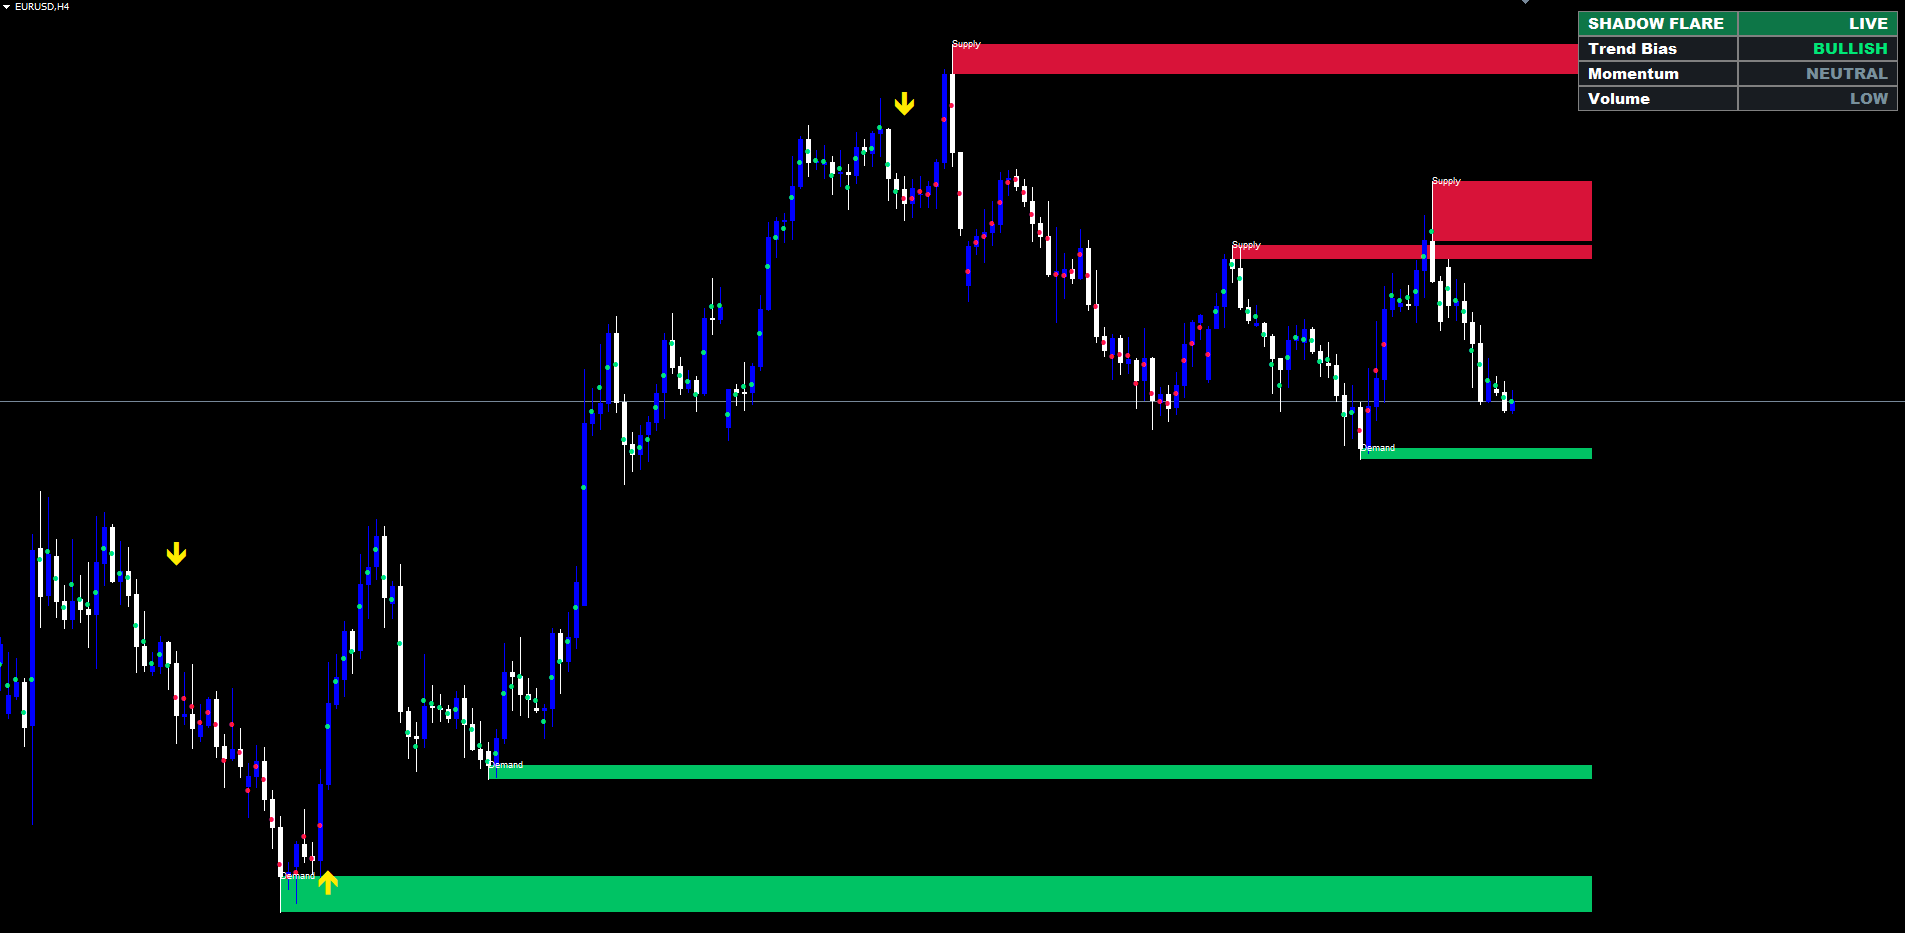
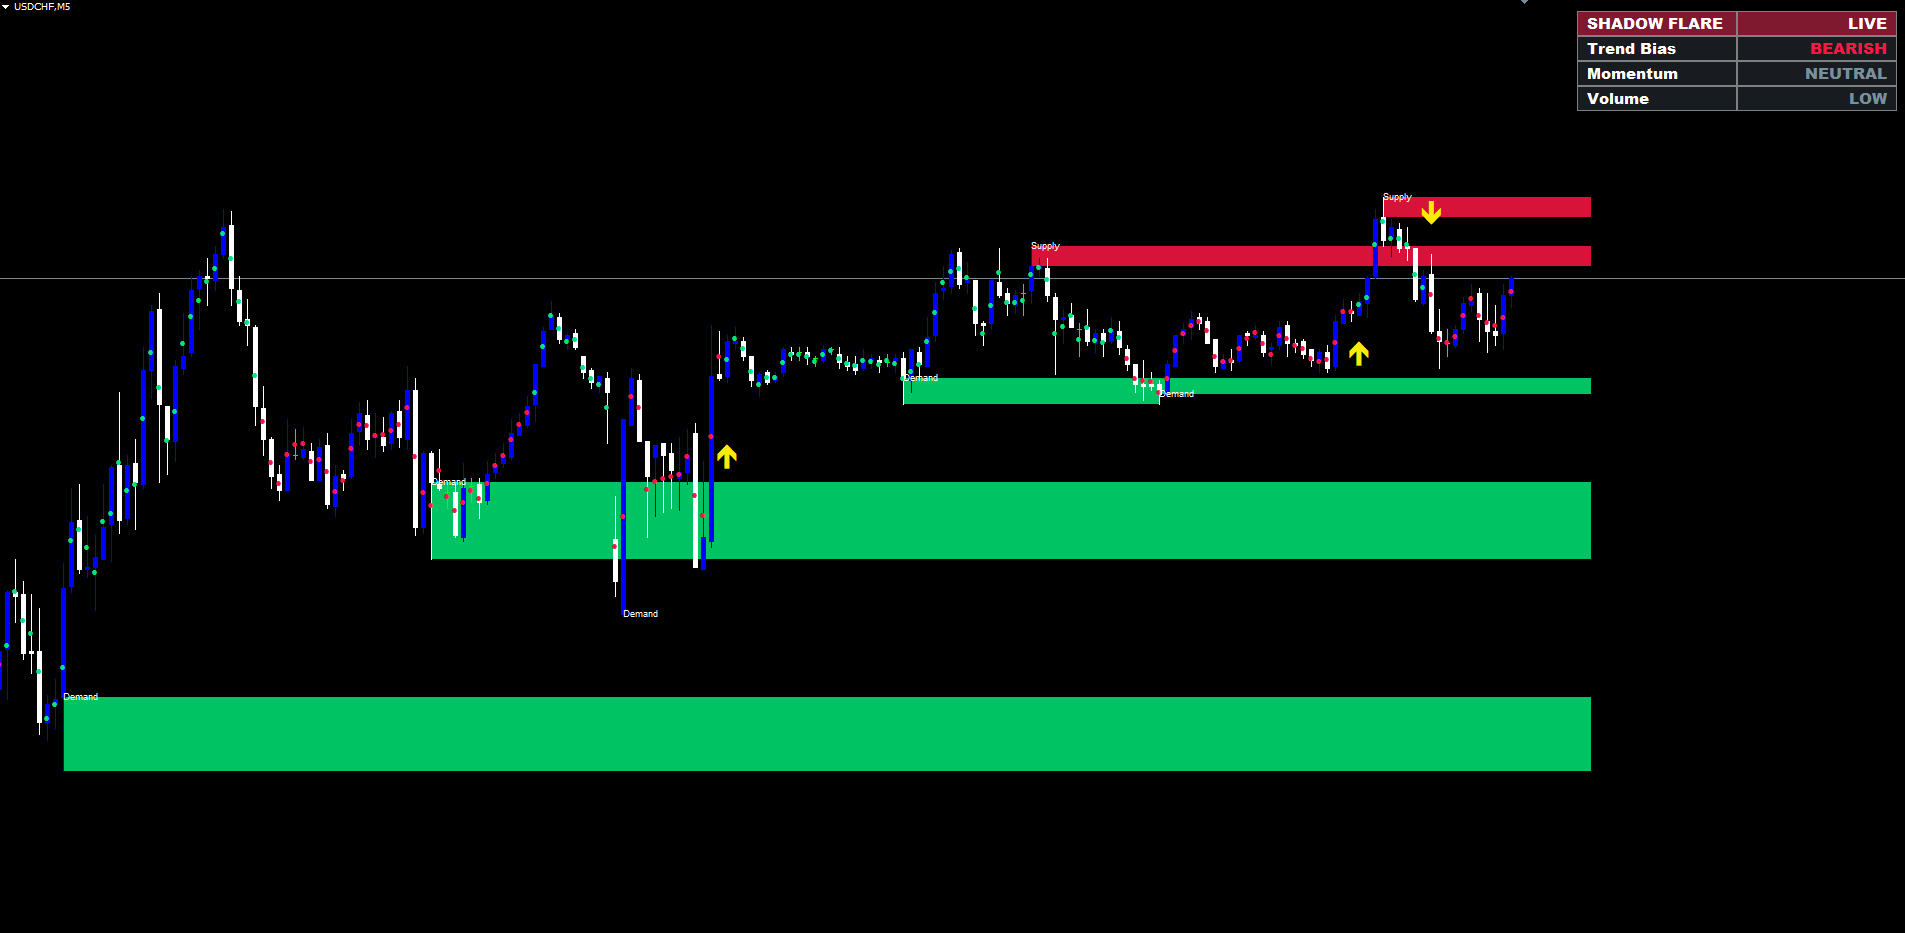
Section 4 — What You See on the Chart
Once Shadow Flare is attached, four classes of objects appear on the chart:
- Yellow Buy / Sell arrows — printed at the bar where the trend state flips bullish or bearish, optionally filtered by volume and / or RSI
- Per-bar trend marker dots — a small green or red dot at the centre of each bar showing the current trend state during that bar
- Supply (red) and Demand (green) zones — pivot-anchored boxes labelled "Supply" or "Demand" in the corner
- Dashboard panel — a 2x4 grid in one of the four chart corners reporting trend bias, momentum, and volume
Buy / Sell Arrows
The arrows are yellow so they remain clearly visible against both red supply zones and green demand zones. A buy arrow prints below the low of the bar where trend transitioned to bullish (offset by 1.2 × ATR for breathing room). A sell arrow prints above the high of the bar where trend transitioned to bearish.
By construction at most one buy arrow can exist per uptrend regime — the next buy arrow can only print after a sell arrow has flipped the state. There is no possibility of multiple consecutive buys stacking inside a single trend.
Bar Marker Dots
The per-bar dots are a compact way to see the current trend state at a glance without reading the bands. Each bar carries one small dot at its mid-price in the trend colour: green during a bullish state, red during a bearish state. Bars in the warmup zone (the oldest bars before the indicator could begin its calculation) carry no dot.
These dots make it easy to see the duration of the current trend and the precise bar where past trend transitions occurred. They can be disabled by setting Color Candles by Trend ( InpShowBar ) to false .
Supply and Demand Zones
A supply zone is drawn whenever a pivot high is confirmed by N bars of confirmation on each side (the Pivot Lookback input, default 10). The box top sits at the pivot bar's high and the box bottom at the larger of that bar's open or close. A "Supply" label appears at the top-left corner of the zone.
Demand zones use the mirror logic for pivot lows in green, with a "Demand" label.
A zone is automatically removed the moment price closes through it. For a supply zone that means a confirmed close above the box's bottom; for a demand zone, a confirmed close below the box's top. Active zones extend their right edge forward each tick (default 10 bars) so the level remains projected into the prices the trader is about to encounter.
Dashboard
The dashboard appears in the corner specified by Dashboard Position (default Top Right). The header row shows "SHADOW FLARE" on the left and "LIVE" on the right, both with a background tint based on the current trend colour. Three data rows underneath:
- Trend Bias — BULLISH / BEARISH / NEUTRAL in the trend colour
- Momentum — STRONG / NEUTRAL / WEAK based on RSI position relative to the OB / OS bands
- Volume — HIGH / LOW relative to the volume moving average
The font is Arial Black at three preset sizes (Tiny / Small / Normal). The whole panel auto-positions when the chart is resized.
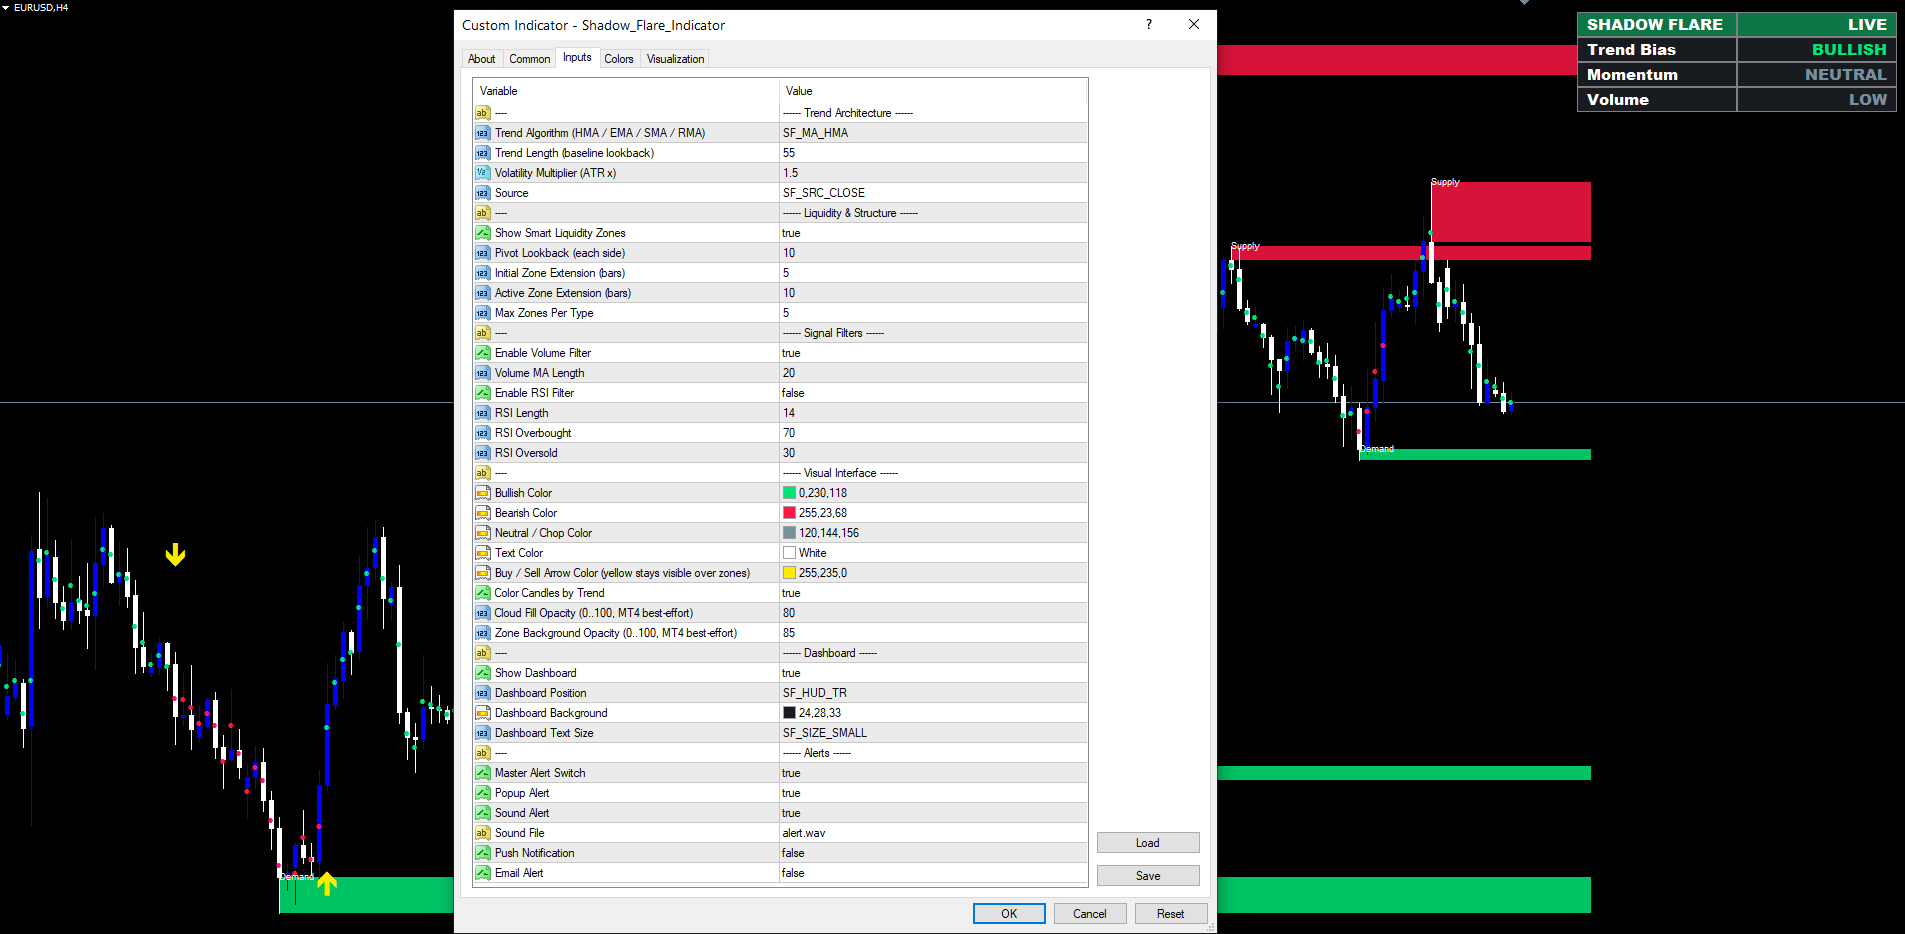
Section 5 — Complete Input Reference
The Inputs dialog is divided into six groups, separated by visual headers in the form of underscore-prefixed strings ("------ Trend Architecture ------" etc.). Each input has a tooltip in the dialog explaining its function.
Group 1 — Trend Architecture
| Input | Default | Range | Purpose |
|---|---|---|---|
| InpMaType | HMA | HMA / EMA / SMA / RMA | Selects the moving-average method used for the baseline. HMA reacts faster while staying smooth. SMA is most familiar to chart-reading traders. EMA is a compromise. RMA (Wilder's smoothing) is slowest. |
| InpLenMain | 55 | ≥ 2 | Lookback period for the baseline. Larger = slower trend, fewer flips, less sensitive. Smaller = faster trend, more flips. |
| InpMult | 1.5 | > 0 | ATR multiplier. The cloud envelope is baseline ± ATR(LenMain) × Multiplier . Larger = wider cloud, slower flips. |
| InpSrc | Close | Close / Open / High / Low / HL2 / HLC3 | Price series fed into the baseline. Close is standard. HL2 = (High+Low)/2. HLC3 = (High+Low+Close)/3. |
Recommended starting points: HMA(55) with multiplier 1.5 works on every symbol and every timeframe. For very low-volatility instruments such as DXY, dropping the multiplier to 1.0 may produce more frequent setups. For very high-volatility instruments such as crypto, raising the multiplier to 2.0 may filter out chop.
Group 2 — Liquidity & Structure
| Input | Default | Range | Purpose |
|---|---|---|---|
| InpShowLiq | true | true / false | Master toggle for the supply / demand zone module. |
| InpLiqLen | 10 | ≥ 2 | Pivot lookback bars on each side. Larger = stronger but later-confirmed pivots. |
| InpZoneExt | 5 | ≥ 1 | How many bars forward a freshly-detected zone projects when first drawn. |
| InpActiveExt | 10 | ≥ 1 | How many bars forward an unmitigated zone keeps extending each tick. |
| InpMaxZones | 5 | 1..25 | Maximum active zones per type (supply or demand). Older zones are removed when the cap is exceeded. |
Lookback choice: A 10-bar lookback works well on H1 to H4. On M15 or M5, dropping to 5 captures faster intraday swings. On D1, raising to 15 or 20 isolates only the major swing pivots.
Group 3 — Signal Filters
| Input | Default | Range | Purpose |
|---|---|---|---|
| InpUseVol | true | true / false | Require volume above its moving average for signals. |
| InpVolLen | 20 | ≥ 1 | Lookback for the volume moving average. |
| InpUseRsi | false | true / false | Block buys above OB and sells below OS. |
| InpRsiLen | 14 | ≥ 2 | RSI calculation period. |
| InpRsiOb | 70 | 0..100 | RSI overbought level (must be > OS). Buys are blocked when RSI ≥ this level. |
| InpRsiOs | 30 | 0..100 | RSI oversold level (must be < OB). Sells are blocked when RSI ≤ this level. |
Filter philosophy: Volume on by default because almost every legitimate trend transition occurs on average-or-above volume. RSI off by default because filtering by RSI guards against entering already-overextended moves but also blocks the very first stage of a strong continuation. Traders who want a more conservative profile turn the RSI filter on.
Group 4 — Visual Interface
| Input | Default | Purpose |
|---|---|---|
| InpBullColor | #00E676 (green) | Bull cloud, demand zones, bull bar markers. |
| InpBearColor | #FF1744 (red) | Bear cloud, supply zones, bear bar markers. |
| InpNeuColor | #78909C (grey) | Neutral / chop accents, neutral momentum. |
| InpTextColor | white | Label and dashboard text colour. |
| InpArrowColor | #FFEB00 (yellow) | Buy / sell arrow colour. Yellow because it stays visible over red and green zones. |
| InpShowBar | true | Toggle per-bar trend marker dots. |
| InpCloudOpc | 80 | (Reserved — preserved for future use) |
| InpZoneOpc | 85 | Zone background opacity (0 = transparent, 100 = solid). |
Colour customisation: All chart colours are inputs, so a trader using a light chart background can re-tune the palette to match. Yellow arrows are recommended over green/red even on dark backgrounds because the supply zones (red) would otherwise hide red arrows.
Group 5 — Dashboard
| Input | Default | Range | Purpose |
|---|---|---|---|
| InpShowHud | true | true / false | Master toggle for the dashboard. |
| InpHudPos | Top Right | Top Right / Bottom Right / Top Left / Bottom Left | Which corner the dashboard sits in. |
| InpHudBg | #181C21 (dark grey) | Panel background colour. Choose to contrast with the chart background. | |
| InpHudSize | Small | Tiny / Small / Normal | Text scale: 9 / 11 / 13 px in Arial Black. |
Position choice: Top Right is the default because it does not overlap the price scale (which is on the right but only at the very edge). Top Left works well when traders use a left-aligned price scale. Bottom corners are useful when the trader has news or other indicators stacked at the top.
Group 6 — Alerts
| Input | Default | Purpose |
|---|---|---|
| InpEnableAlerts | true | Master switch — overrides all individual alert toggles when off. |
| InpAlertPopup | true | Show MetaTrader popup dialog. |
| InpAlertSound | true | Play the configured sound file. |
| InpSoundFile | alert.wav | Sound filename (must be present in the MetaTrader Sounds folder; alert.wav ships standard). |
| InpAlertPush | false | Send a mobile push notification (requires MetaQuotes ID configured). |
| InpAlertEmail | false | Send an email alert (requires SMTP configured in MetaTrader). |
Alert configuration: See Section 7.
Section 6 — Reading the Dashboard
The dashboard is the fastest way to read the current market regime. Each row encodes one piece of information:
Header row. "SHADOW FLARE" on the left and "LIVE" on the right. The cell background tint reflects the current trend colour — green during BULLISH, red during BEARISH, grey during NEUTRAL. A glance at the corner of the chart tells you the directional bias without reading any text.
Trend Bias. BULLISH (green text), BEARISH (red text), or NEUTRAL (grey text). NEUTRAL only appears in the warmup zone before the first trend transition has occurred — once the indicator establishes a bias, it remains BULLISH or BEARISH until a confirmed flip.
Momentum. Computed from the latest RSI(14) reading:
- RSI > (RsiOb − 10), default > 60: STRONG (green)
- RSI < (RsiOs + 10), default < 40: WEAK (red)
- otherwise: NEUTRAL (grey)
The momentum reading does not require the RSI filter to be enabled — it always reflects current RSI position, even when the filter is off.
Volume. Compares the latest bar's tick volume to the volume moving average:
- Volume > moving average: HIGH (green)
- otherwise: LOW (grey)
A "BULLISH / STRONG / HIGH" reading is the indicator's strongest configuration: trending market, confirming momentum, broad participation. A "BULLISH / WEAK / LOW" reading is the weakest within an uptrend: trend is up but momentum is fading and volume is light, often the precursor to a corrective phase.
Section 7 — Alert Configuration
The four alert channels are wired through a single dispatcher. Each can be turned on or off independently; a master switch turns them all off at once.
Popup. No setup required. The standard MetaTrader popup dialog appears the moment the alert fires. The dialog is modal — it stays on screen until the trader clicks OK.
Sound. No setup required for alert.wav (the default), which ships with every MetaTrader install. To use a custom sound, place the WAV file in MQL4/Files/Sounds/ (MT4) or MQL5/Files/Sounds/ (MT5) — actually, place it in <terminal>/Sounds/ — and put its filename (with the .wav extension) in the Sound File input.
Push notifications. To receive push notifications on the MetaTrader mobile app:
- Install MetaTrader 4 or 5 on a mobile device
- Open the mobile app → Settings → Messages → Find your MetaQuotes ID
- On the desktop terminal, open Tools → Options → Notifications
- Tick Enable Push Notifications
- Enter the MetaQuotes ID from the mobile app
- Click Test — confirm a test notification arrives on the phone
- In the indicator's Inputs, set InpAlertPush to true
Email alerts. To receive email alerts:
- Configure SMTP in MetaTrader: Tools → Options → Email
- Tick Enable email
- Enter the SMTP server, port, login, password, and the From / To email addresses
- Click Test — confirm a test email arrives in the inbox
- In the indicator's Inputs, set InpAlertEmail to true
The dispatcher fires once per signal at bar close. It does not re-fire alerts for historical signals when the indicator is added to a chart that already has signals in its past — the alert tracker is seeded with the time of the most recent historical signal on first calculation.
Section 8 — Tuning by Symbol and Timeframe
Shadow Flare's defaults work without modification on most major forex pairs (EURUSD, GBPUSD, USDJPY, AUDUSD) on intraday timeframes (M15, M30, H1, H4). For other instruments and timeframes, consider these adjustments:
Very low volatility (DXY, low-vol crypto, calm equity indices). Reduce the volatility multiplier ( InpMult ) from 1.5 to 1.0–1.2 so the cloud is narrow enough to flip on real moves. Reducing the trend length to 34–45 also helps capture quicker shifts.
Very high volatility (volatile crypto, news-driven currencies). Raise the multiplier to 2.0 and the trend length to 70–89 to keep the trend state stable through the noise. The RSI filter on (default OB/OS at 75/25) further tightens entries.
Lower timeframes (M1, M5). Reduce the pivot lookback ( InpLiqLen ) from 10 to 5 so zones form at the faster swings. Reduce the volume MA length to 10. Consider HUD size Tiny so the panel does not dominate the small chart area.
Higher timeframes (D1, W1). Raise the pivot lookback to 15 or 20 so only the most prominent swings produce zones. Consider the HMA(89) baseline with multiplier 2.0 for cleaner trend reads on weekly charts.
Indices and CFDs with limited tick volume. Disable the volume filter ( InpUseVol = false ) since tick-volume data is sometimes unreliable on broker-aggregated feeds. The dashboard's Volume row will still display, but signals will not be blocked by it.
Section 9 — Strategy Tester Use
Shadow Flare runs in the Strategy Tester for visual back-checking of past signals. Open the Tester (CTRL+R), choose Indicator from the Type dropdown (MT4) or use the Indicators tab (MT5), select Shadow Flare, pick a symbol and date range, choose Visualization mode, and click Start.
For visual review:
- Set InpEnableAlerts to false to silence alerts during fast-forward replay
- Set InpHudSize to Normal if the Tester chart is small
- Use the Tester's Pause and Step buttons to walk through each signal bar by bar
The Tester's bar-by-bar replay confirms the non-repainting behaviour. Each signal arrow appears at the close of its bar and never moves on subsequent ticks, exactly as it does on the live chart.
Section 10 — Frequently Asked Questions
Does the indicator repaint?
No. Trend state is updated only at bar close, and pivots are confirmed by N bars of both-sides lookback. Once an arrow or a zone has been drawn, it is permanent. The indicator's logic produces the same chart on closed bars regardless of when the chart is opened.
Why does a zone appear N bars after the actual pivot?
Pivot confirmation requires N bars to close on the right side of the candidate. Until those bars exist, the indicator cannot know whether the candidate is a true pivot — a higher high a few bars later would invalidate it. This delay is the cost of non-repainting integrity. It is the same reason that a pivot detected on TradingView's ta.pivothigh function appears N bars after the fact.
Why do trend flips lag by one bar?
Signals fire at bar close, not on intraday ticks. The first close that breaks the upper or lower band fires the signal, but only after that bar finalises. This is intentional — evaluating signals on still-forming bars is the definition of repainting and produces unreliable results in live trading.
Can I run multiple instances on the same chart?
Yes. Each instance maintains its own object names (prefixed with SF_ and SFHUD_ ), so two attached instances will not interfere with each other. To avoid visual clutter, tune one instance with the volume filter on and one with it off, or one with HMA(34) and one with HMA(89), to compare profiles.
Why are the buy / sell arrows yellow instead of green / red?
Because supply zones are red and demand zones are green, a red sell arrow at the top of a supply zone or a green buy arrow at the bottom of a demand zone would blend into the zone background and disappear. Yellow stays visible against both. The colour is configurable via InpArrowColor for traders who want a different palette.
Where did the "trend cloud" go?
A trend cloud was part of an earlier version. In live testing on MT5 the cloud caused rendering artifacts in some configurations, so the visible cloud was removed in favour of a pure-state-driven design — the trend is now communicated through the per-bar marker dots and the dashboard Trend Bias row instead. The internal cloud math (baseline ± ATR × multiplier) is still the trigger for trend transitions; it is just not rendered as a visible overlay.
The indicator doesn't show anything on a fresh chart.
The first calculation requires at least 2 × LenMain + 10 bars of history (e.g., 120 bars at the default LenMain = 55 ). On a fresh chart with very limited history, the indicator returns 0 from OnCalculate and waits. Once the broker has fed enough bars in, the indicator initialises automatically.
Can I use this in an Expert Advisor?
Yes — the indicator can be loaded by an EA via iCustom() . Each plot buffer is exposed: buffer 0 is the buy signal, buffer 1 is the sell signal, buffers 2 and 3 are the bull / bear marker dots. An EA can read these via iCustom(_Symbol, _Period, "Market\\Shadow_Flare_Indicator", ..., 0, 1) for the most recent buy-signal value (or EMPTY_VALUE if no signal). The exact iCustom signature must match the input list — please contact support@forexobroker.com for the parameter order to use in EA code.
Does it work on synthetic indices and exotic crosses?
Yes. The indicator uses only standard built-in functions (iATR, iRSI, iMA) and predefined OHLC data, all of which are available on every symbol in MetaTrader. There are no symbol-specific assumptions in the code.
Section 11 — Compatibility
- Platforms: MetaTrader 4 (build 1380+), MetaTrader 5 (build 4000+)
- Account types: Hedging and netting both supported (the indicator does not place trades)
- Symbols: Forex, indices, commodities, crypto, CFDs, equities — all supported
- Timeframes: M1, M5, M15, M30, H1, H4, D1, W1, MN1
- Strategy Tester: Visual mode supported on both platforms
- Free demo: A free demo version is available on the product's MQL5.com Market page — click the "Free Demo" button to download the demo to your MetaTrader
Download the indicator:
- MetaTrader 5: Shadow Flare MT5
- MetaTrader 4: Shadow Flare MT4
CONTACT & SUPPORT
- Email: info@forexobroker.com
- Questions: Use the Comments section on the product page or send a private message
- Bug Reports: Please include your broker name, account type, and a screenshot
-
✅ All MQL Tools: https://www.mql5.com/en/users/forexobroker/ ✅
--------------------------------------------------------------------------------------------------------------
🏦 **Broker I use**: https://icmarkets.com/?camp=55869
🏦 **Broker For EU Traders I use 1**: https://www.ictrading.com?camp=91414
🏦 **Broker I use 2**: https://one.exnessonelink.com/boarding/sign-up/a/c_thuv62ocfq
💻 **VPS**: https://chocoping.com/processing/aff.php?aff=738
💼 **Companies I use for getting funded**:
Fundednext: https://fundednext.com/?fpr=kestutis39
The5ers: https://www.the5ers.com/?afmc=16kl
FTMO: https://trader.ftmo.com/?affiliates=nRAyOhmFRnEnFdOpdLeh
Risk Disclaimer
Trading foreign exchange and CFDs on margin carries a high level of risk and may not be suitable for all investors. You may sustain a loss exceeding your initial investment. Trend Quorum is a technical analysis tool and does not guarantee profitable trades. Past performance is not indicative of future results. The authors accept no liability for any loss arising from use of the indicator. By using Trend Quorum you acknowledge sole responsibility for your trading decisions.


")
")
![[XAUUSD]: Weekly Liquidity Activation Points (timings), June 22-26, 2026](https://c.mql5.com/6/1013/splash-preview-771790.png "[XAUUSD]: Weekly Liquidity Activation Points (timings), June 22-26, 2026")