
Shadow Flare Indicator: Adaptive Trend Engine + Smart Liquidity Zones for MetaTrader 4 and 5

Introduction
Most retail trend indicators fall into one of two camps. The first camp draws a single moving average and asks the trader to interpret price relative to it — a system that flips noisily on every minor pullback. The second camp uses fixed bands or static support and resistance lines that quickly become stale as the market evolves. Neither approach handles the two situations traders actually face in practice: a strong trending market that needs a stable directional bias, and a ranging market that needs to highlight the structural levels where price is likely to reverse.
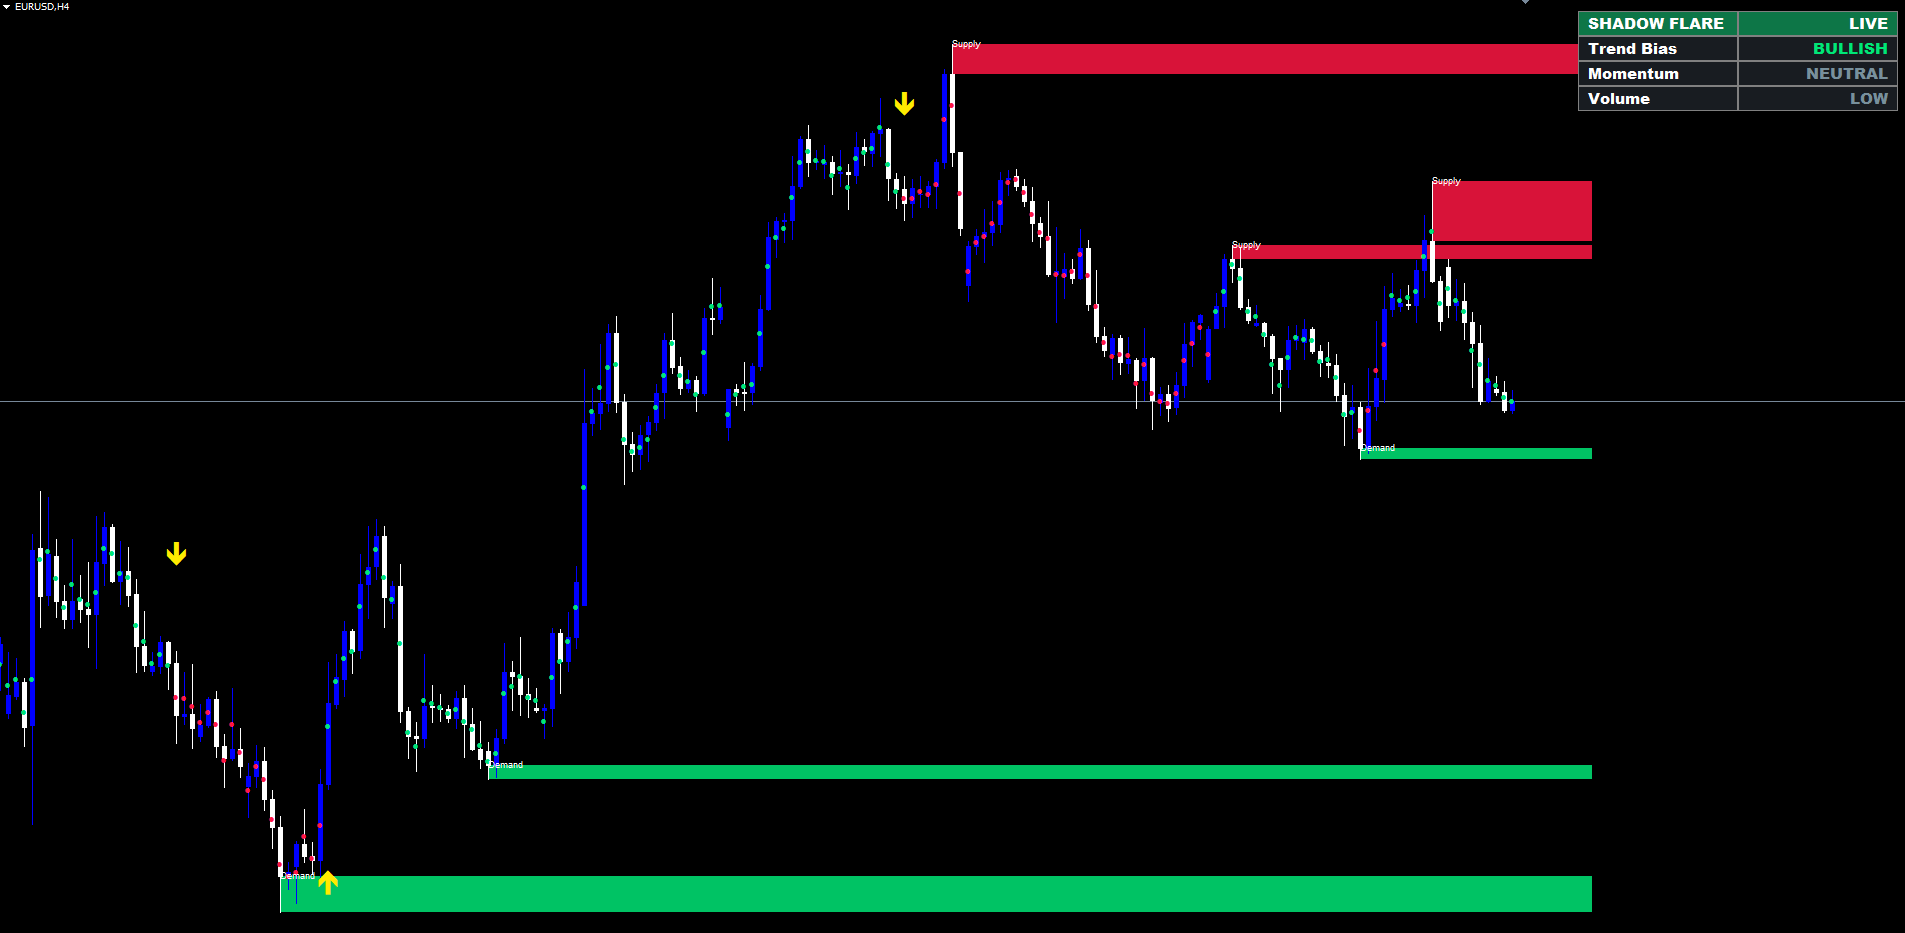
Shadow Flare Indicator combines both jobs into a single tool. It runs an adaptive moving-average baseline (HMA, EMA, SMA, or RMA) wrapped in an ATR envelope to derive a sticky trend state, and independently scans the chart for pivot highs and pivot lows that produce automatic supply and demand zones. The trend state drives Buy and Sell signals; the liquidity zones mark the exact prices where price has previously reversed. A small dashboard reports current bias, momentum, and volume in real time.
The indicator is available for both MetaTrader 4 and MetaTrader 5, and the two builds are written to produce identical visual output and identical signal counts on the same chart.
Download the indicator:
- MetaTrader 5: Shadow Flare MT5
- MetaTrader 4: Shadow Flare MT4
This article walks through each component — the trend engine, the liquidity-zone module, the signal filters, the dashboard, and the non-repainting architecture — and explains the reasoning behind each design choice. The companion user manual covers installation, the full input reference, and a recommended trading workflow.
Why Trend Trading Needs Adaptive Bands
A simple moving-average crossover system answers the question "is price above or below its average?" That binary is useful only when the market is decisively trending. In ranging conditions, price oscillates around the average and crossover systems generate a long sequence of false signals — buys at the top of the range, sells at the bottom, and an account drawdown that has nothing to do with the underlying market structure.
The fix is to widen the decision boundary. Instead of asking "is price above the average?", a robust system asks "has price decisively moved away from the average?" — which means moving the trigger lines a meaningful distance above and below the baseline. The size of that distance has to scale with current volatility. A 30-pip envelope is too tight on GBPJPY during the London open and too loose on EURUSD during the Asian session. The natural unit is the Average True Range, which captures the symbol's recent typical bar size in a single number.
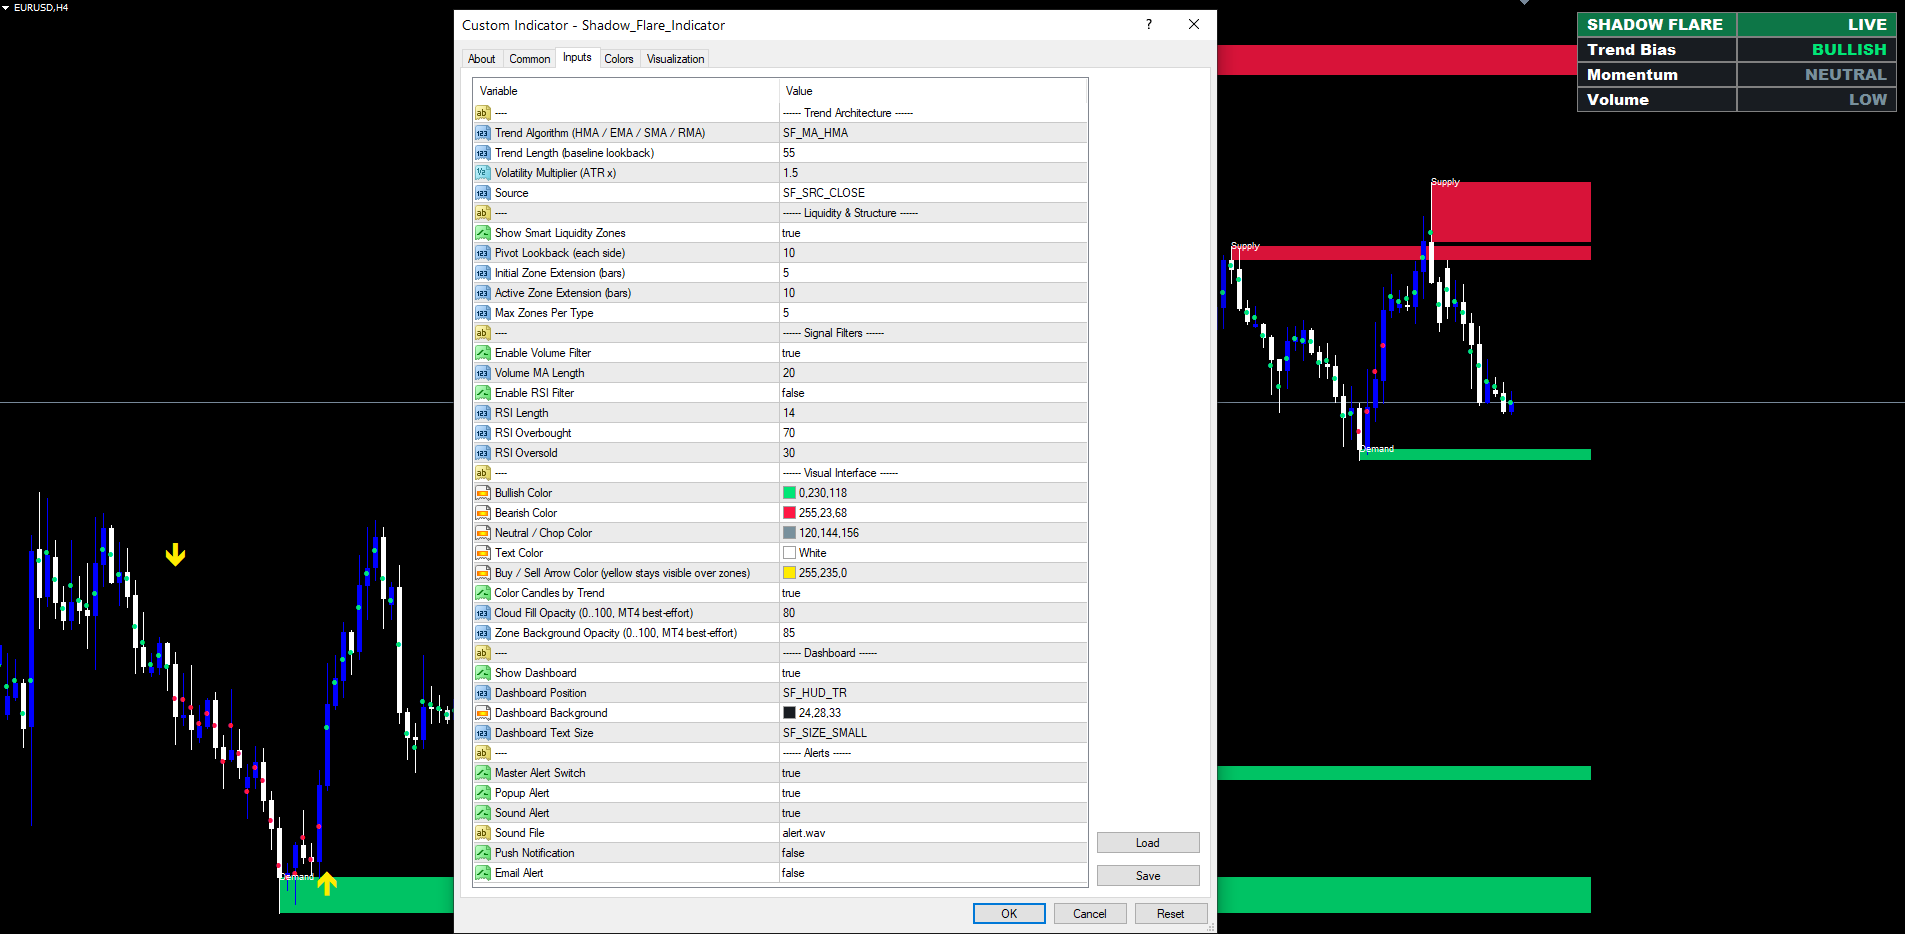
Shadow Flare implements this by computing a baseline moving average (default HMA(55)), then adding and subtracting ATR(LenMain) × Multiplier to define an upper band and a lower band. The default multiplier of 1.5 means a typical signal requires price to push 1.5 ATR away from the baseline before the trend state is allowed to flip. On a quiet pair this might be 25 pips; on a volatile pair it might be 80 pips. The indicator does not need to be retuned per symbol because the threshold scales automatically.
The choice of HMA as the default baseline is deliberate. The Hull Moving Average reduces the lag inherent in long-period moving averages while keeping the line smooth — it does this by computing two weighted moving averages (one at the full length, one at half the length), taking their weighted difference, and then smoothing that difference with a final WMA at sqrt(length). The result tracks recent price action faster than an EMA of the same period without producing the staircase appearance that plagues short-period EMAs. Traders who prefer the more familiar smoothing characteristics of an EMA, SMA, or RMA can switch the baseline method via a single input.
The Sticky Trend State
A simpler indicator might say: "trend is bullish whenever price is above the upper band, bearish whenever below the lower band, and neutral in between." That definition produces a flickering trend reading every time price re-enters the cloud — exactly the whipsaw an envelope was meant to eliminate.
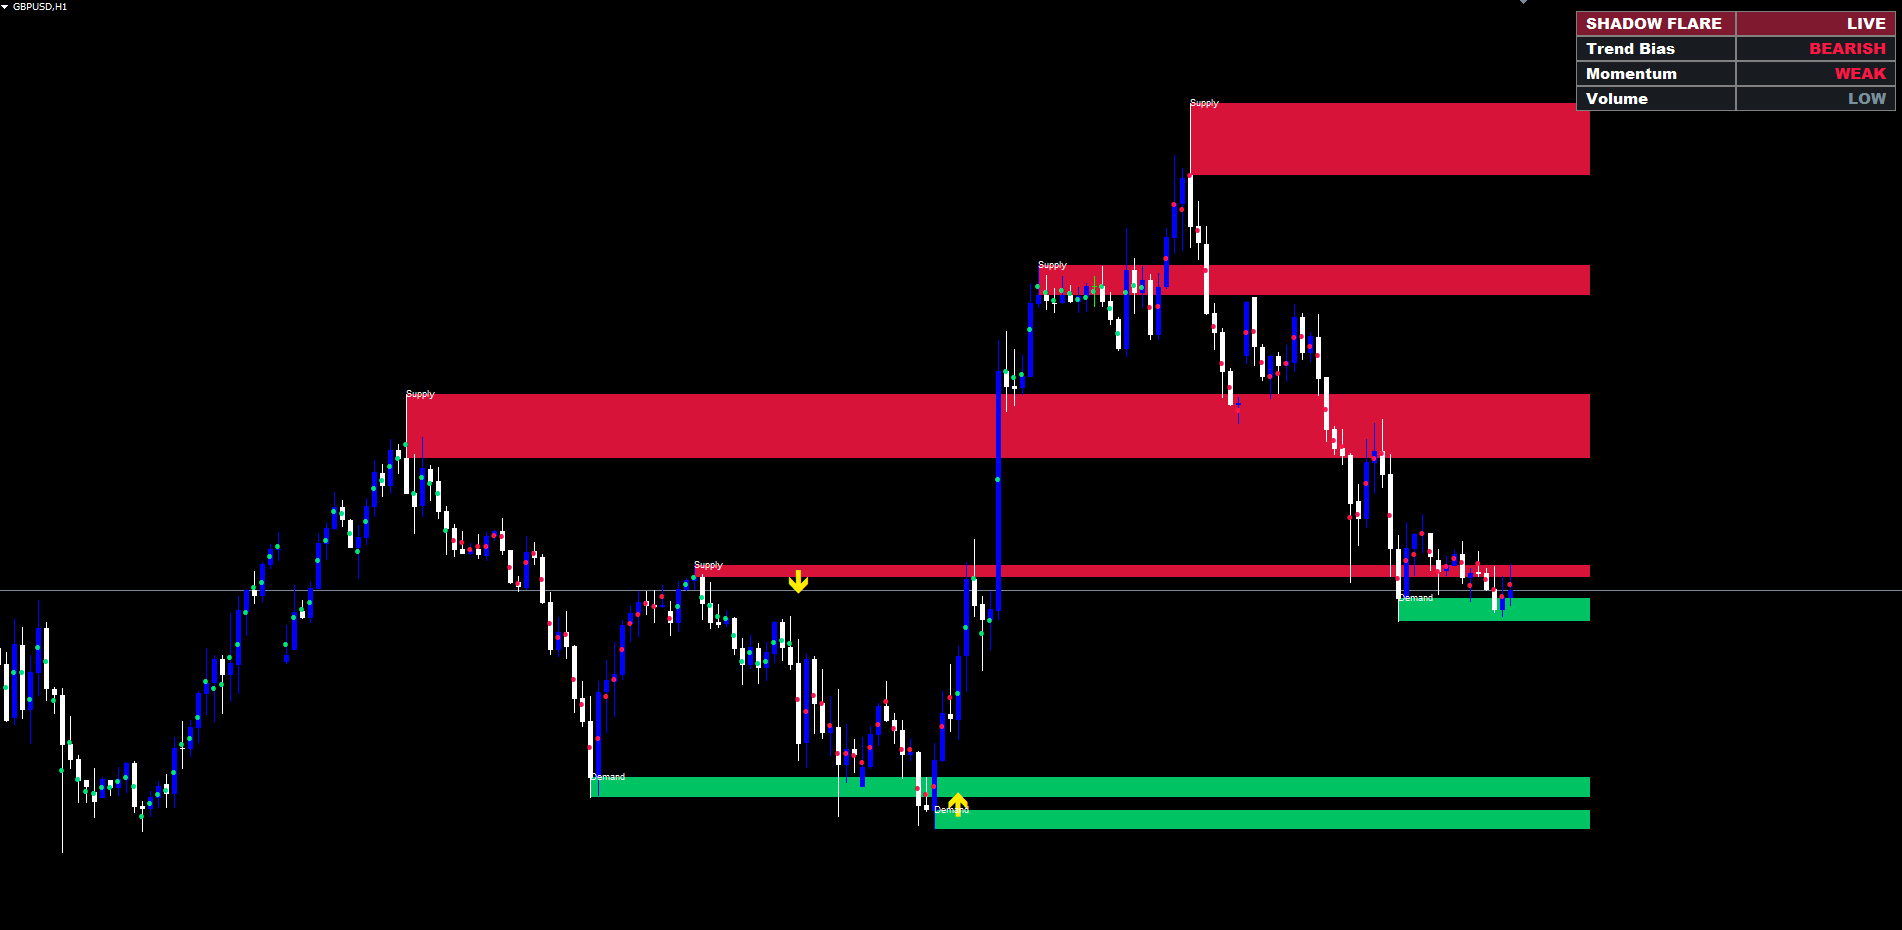
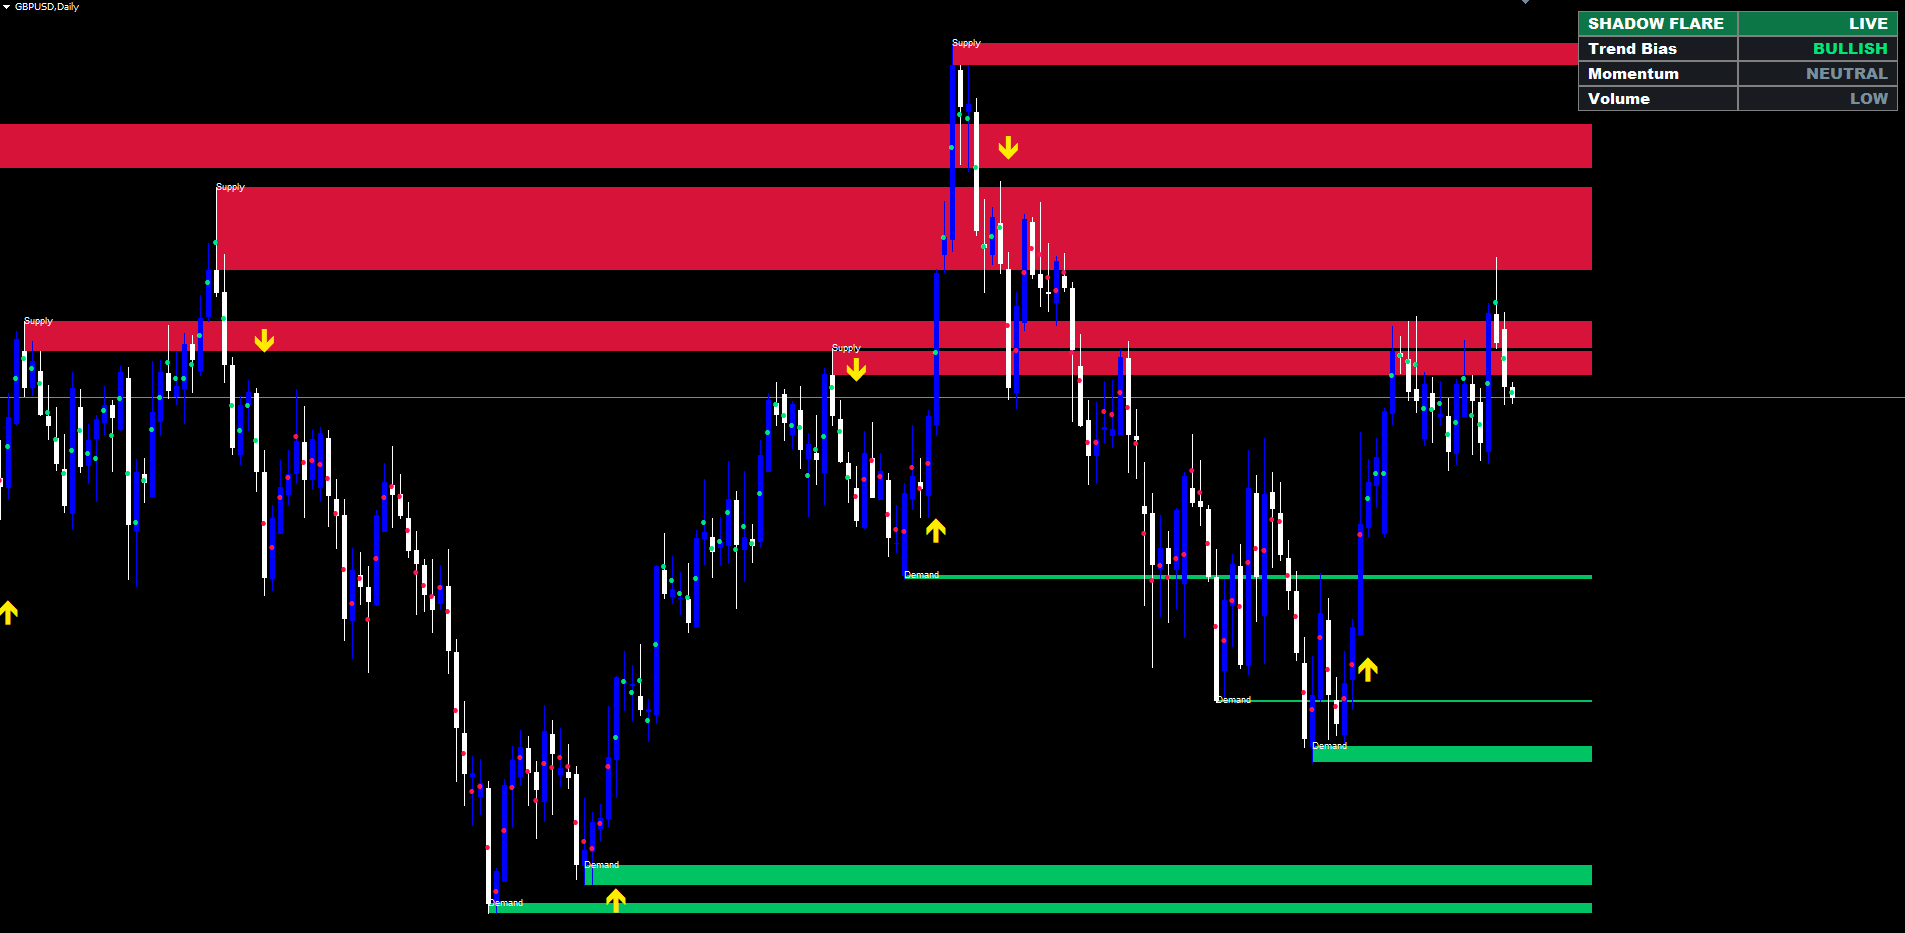
Shadow Flare uses a sticky state machine instead. The state starts at zero (neutral). The first close above the upper band sets the state to +1 (bullish). The first close below the lower band sets the state to -1 (bearish). Once the state is set, it persists through subsequent bars even if those bars close inside the cloud. The state only flips to the opposite sign when price closes through the opposite band.
The practical consequence is that the trend reading is stable. A bullish state, once established, can survive several pullbacks into the cloud without flipping. Only a decisive close below the lower band can break the bullish reading and switch it to bearish. This matches how experienced trend traders interpret price action: a bull trend ends not when the price dips slightly but when sellers prove they can drive the market through prior support.
Trend transitions are exactly what produce Buy and Sell signals. A buy signal fires on the bar where the state transitions from non-bullish (zero or -1) to +1. A sell signal fires on the bar where the state transitions from non-bearish to -1. By construction this happens at most once per directional regime — there is no possibility of multiple consecutive buy signals stacking on top of each other during a single uptrend.
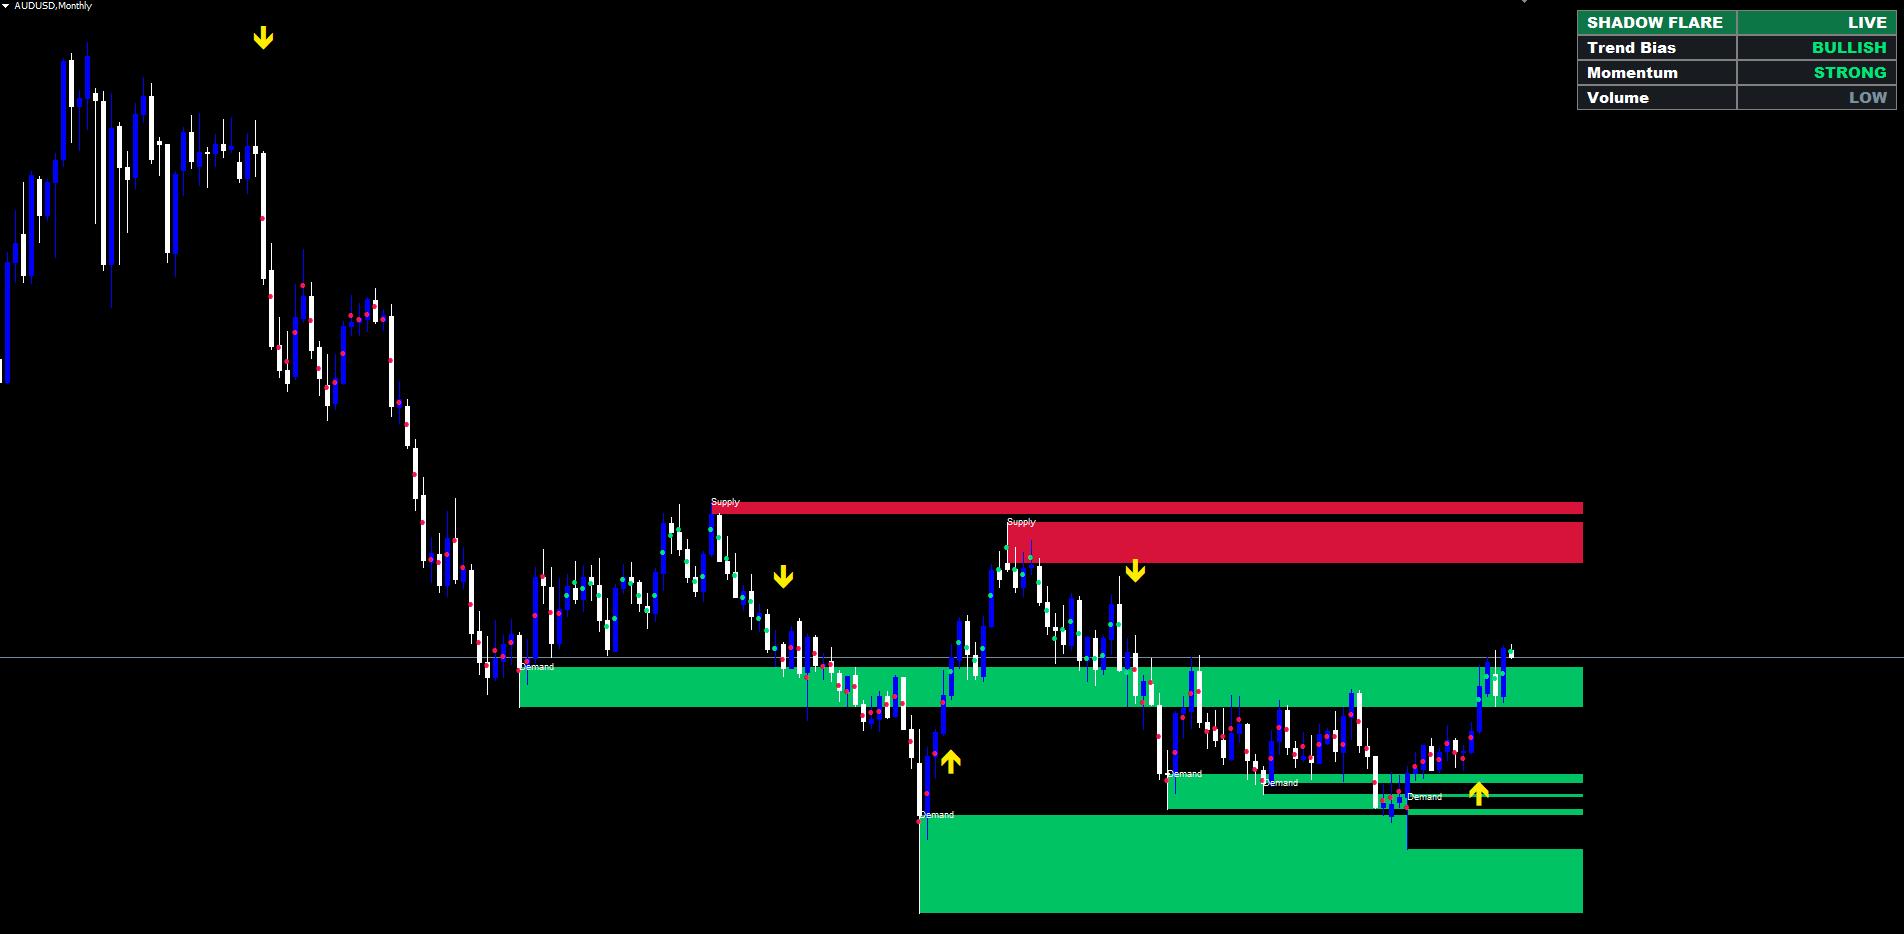
Smart Liquidity Zones: Why Pivot-Based Supply/Demand Beats Fixed Levels
The other half of the indicator is the liquidity-zone module, which works independently of the trend state. The reasoning is that even in a strong trend, price retraces to specific structural levels — prior swing highs and prior swing lows — and reacts at those zones. A trend-following trader who ignores these levels enters at random distances from key support, often catching a reversal at the worst possible moment.
A static horizontal line drawn at a previous high is one way to mark such a level, but it has known weaknesses. It loses meaning quickly as the market evolves. It carries no information about how recently the level was tested. And it ignores the fact that real "zones" of liquidity are price ranges, not single points — orders cluster around a pivot but extend a few pips above and below it. Shadow Flare addresses all three issues with pivot-based zones.
A pivot high is detected when the high of a candidate bar exceeds the highs of N bars on each side, where N is the configurable Pivot Lookback (default 10). The check uses both-sides confirmation, which means the pivot is only reported once N bars have closed to its right — there is no possibility of a pivot being identified prematurely and then "un-confirmed" later. The exact same logic in mirror identifies pivot lows.
When a pivot high is confirmed, the indicator draws a red supply zone with the box top at the pivot's high price and the box bottom at the maximum of the pivot bar's open and close. This range — high to body — is the zone where sellers stepped in to push price down. The zone extends to the right by N bars as the chart progresses, projecting forward into the prices the trader will encounter next. Demand zones use the mirror construction for pivot lows in green.
Auto-Mitigation: Zones Disappear When Broken
A zone that price has already broken through is not a zone any more — it is historical noise. Many supply/demand indicators leave broken zones on the chart indefinitely, making the screen progressively harder to read. Shadow Flare handles this with auto-mitigation: a zone is deleted the moment price closes beyond it.
For a supply zone, "beyond" means above the bottom of the zone — that is, a confirmed close above the entry price of the original sellers. Once that happens, the zone has been overcome and is removed from the chart. Demand zones use the mirror rule: a zone is removed when price closes below the top of the zone.
This single rule keeps the chart uncluttered. Only zones that have not yet been challenged by a confirmed close remain visible. The number of active zones per type is also capped (default 5), so even in a sideways market with many pivots, the chart stays readable — older zones are removed when newer ones form.
While a zone is alive, its right edge extends forward each tick by the Active Zone Extension setting (default 10 bars). This keeps the zone projected into upcoming price action so the trader can see the level as it approaches.
Filtering Signals with Volume and RSI
A trend flip on its own is sometimes a low-quality signal. The flip can happen during low-volume conditions when no real institutional flow is behind the move, or during overextended momentum readings where a reversal is statistically more likely than a continuation. Shadow Flare offers two optional filters that block weak setups before the arrow is drawn.
The volume filter (enabled by default) requires that the bar's tick volume exceed the simple moving average of tick volume over the configured length (default 20 bars). The reasoning is that genuine trend transitions tend to occur on bars with above-average participation. A trend flip on a thin bar is more likely to be a temporary excursion that gets reversed shortly afterwards. The filter is conservative — it requires only that volume be above the recent average, not a dramatic spike — so it lets through most legitimate setups while filtering the obvious false ones.
The RSI filter (disabled by default) blocks buys when RSI is at or above the overbought threshold (default 70) and blocks sells when RSI is at or below the oversold threshold (default 30). The intent here is different from a typical RSI overbought/oversold signal — Shadow Flare uses RSI as a guard, not a trigger. A buy signal at RSI 78 is suspicious because momentum is already extended; the filter prevents that signal from printing. A buy signal at RSI 55 passes through unaffected. Traders who prefer to enter on full continuation can leave the filter off; those who want a more conservative profile can enable it and tighten the bands further.
Both filters are evaluated only at the bar where a trend flip occurs, so they affect signal generation, not the trend state itself. The trend state and the dashboard always reflect the underlying market regime regardless of filter settings.
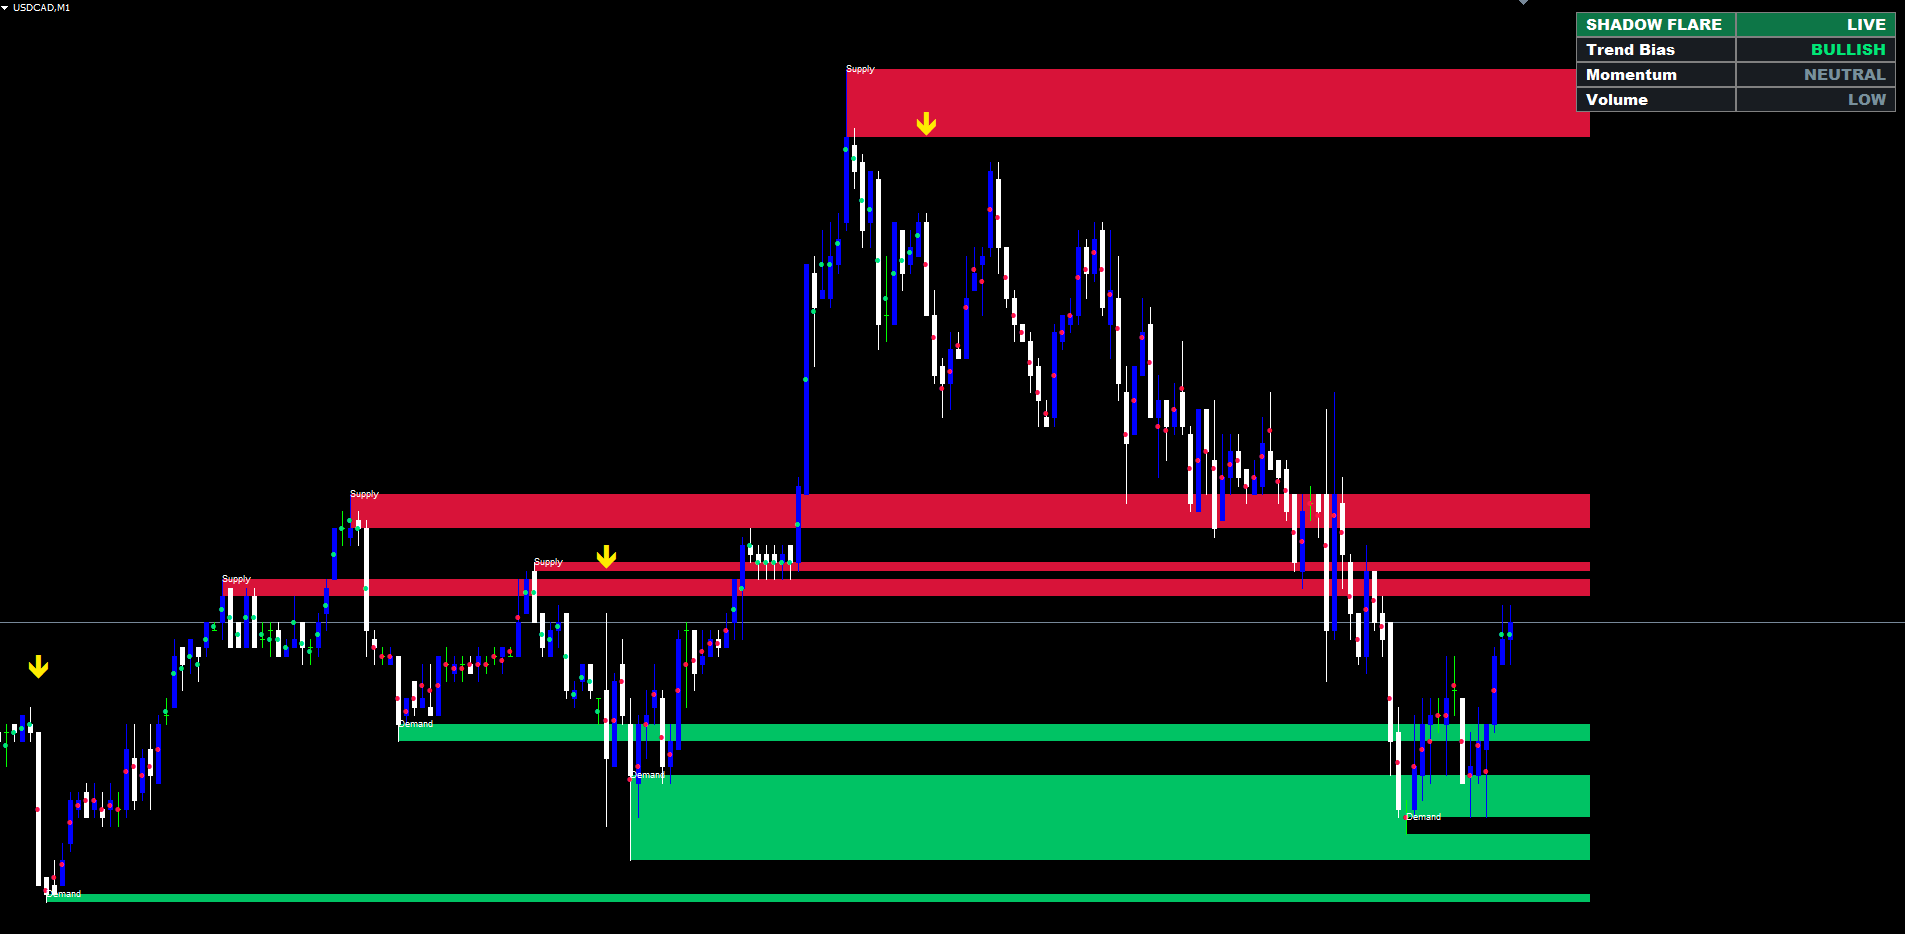
Per-Bar Trend Markers and the Dashboard
For traders who want a quick visual scan rather than a deep analysis, Shadow Flare prints a small coloured dot in the centre of each bar in the current trend's colour — green during a bullish state, red during a bearish state. The dots make it easy to see at a glance how long the current regime has lasted and where past transitions occurred without having to read the bands themselves.
The dashboard is a 2x4 grid in one of the four chart corners. The header row carries the product name and a "LIVE" indicator with the trend colour as the background tint, so a single glance at the corner tells the trader whether the market is bull or bear. The three data rows underneath display:
- Trend Bias — BULLISH, BEARISH, or NEUTRAL, in the trend colour
- Momentum — STRONG, NEUTRAL, or WEAK based on RSI position relative to the OB / OS levels (RSI within 10 of OB → STRONG bull-coloured; within 10 of OS → WEAK bear-coloured; otherwise NEUTRAL)
- Volume — HIGH (above the moving average) or LOW (below it), green or grey
The font is Arial Black so the panel renders crisply at any chart-DPI setting and on broker terminals that downscale chart elements aggressively. Three text-size presets (Tiny / Small / Normal) let traders match the panel size to the rest of their workspace.
Non-Repainting Architecture
Repainting is the most common failure mode of trend and breakout indicators, and it is also the most pernicious because it is invisible until live trading begins. An indicator that re-evaluates conditions on the still-forming bar can briefly show a signal that disappears when the bar closes at a different price. Backtests of such an indicator look spectacular because every "wrong" signal silently disappears. Live trading is where the discrepancy reveals itself, and by then real money has already been committed.
Shadow Flare avoids this by enforcing two strict rules:
- Trend state is updated only at bar close. The state for the current forming bar uses the close price of that bar, but the state for prior bars is frozen the moment that bar closes. Subsequent ticks cannot retroactively change a historical trend reading.
- Pivots are confirmed by both-sides lookback. A pivot at bar T is only reported once N bars to the right of T have closed. The pivot's existence cannot change retroactively because the surrounding bars have already closed and their highs and lows are immutable.
The visible consequence is that pivots, supply/demand zones, and signal arrows all appear with an inherent delay equal to the lookback period — the chart shows a zone for a pivot that occurred N bars ago, not a zone for the still-forming bar. This delay is the cost of integrity, and serious systematic traders universally prefer a slightly delayed but stable signal over a "fast" signal that shifts under their feet.
The buffer arrays follow the same discipline. On the first run, all bars are fully calculated; on subsequent ticks, only the most recent two bars are recomputed. Bars that have already been finalised are never overwritten, which means historical signals never move and the chart you see today on closed bars is identical to the chart you saw the moment those bars finalised.
The Alert Package
Four alert channels are wired into a single dispatcher, each independently toggleable, with a master switch that disables all of them — useful for quiet Strategy Tester runs and visual review sessions.
- Popup — the standard MetaTrader popup dialog, ideal for desktop sessions when the trader is at the screen
- Sound — plays the sound file specified by the input (default alert.wav , the standard MetaTrader sound that ships with every install)
- Push — sends a push notification to the trader's mobile MetaTrader app (requires the MetaQuotes ID to be entered in MetaTrader → Tools → Options → Notifications)
- Email — sends an email to the configured SMTP address (requires SMTP server, login, and password to be entered in MetaTrader → Tools → Options → Email)
The dispatcher fires once per signal at bar close. Re-running the indicator on a chart that already has historical signals does not re-fire alerts for those past events — the indicator seeds its alert tracker with the most recent historical signal time on the first OnCalculate, so only genuinely new signals (those that occur after the indicator was added to the chart) trigger live alerts.
MT4 and MT5 Parity
The MQL4 and MQL5 builds are written to produce visually identical output on the same symbol and timeframe. Both files use the same input names, same default values, same buffer count, same enum mappings, and the same internal trend / pivot / filter logic. The only differences are the unavoidable platform-specific adaptations:
- Indicator handles — MT5 requires indicator handles created in OnInit and read with CopyBuffer (ATR, RSI, the EMA / SMA / SMMA / LWMA-half / LWMA-full handles needed for HMA computation); MT4 uses direct iATR, iRSI, iMA calls per bar
- Object creation timing — MT5 creates supply/demand boxes and the dashboard inside an OnTimer(500ms) callback because objects created during MT5's OnCalculate are invisible (a known platform behaviour); MT4 creates them directly in OnCalculate
- Predefined arrays — MT5 reads tick_volume[] , time[] , high[] , low[] , close[] , open[] from OnCalculate parameters with ArraySetAsSeries flipped on; MT4 uses the corresponding predefined Volume[] , Time[] , etc. arrays directly
These adaptations are invisible to the user. Side-by-side, the two builds report the same trend bias, draw the same zones at the same prices, fire the same signal arrows on the same bars, and display the same dashboard.
A Practical Workflow
A typical workflow on EURUSD H1 looks like this:
- Add the indicator to the chart with default settings. The dashboard appears in the top-right corner immediately.
- Read the dashboard. A "BULLISH" trend bias with "HIGH" volume confirms the market is in a directional regime worth trading. A "NEUTRAL" or contradictory reading suggests the trader should wait for clearer alignment.
- Wait for a fresh signal arrow. The yellow arrow only prints once per directional flip, so seeing a new arrow on the chart is the unambiguous trigger.
- Check nearby liquidity zones. If the most recent demand zone is just below the buy entry, the zone provides a natural stop-loss reference. If the next supply zone is far above, the path of least resistance toward that level is the primary trade thesis.
- Manage the position by zone breach. As price advances, watch for the next opposite zone. A close beyond it triggers auto-mitigation (the zone disappears) and signals the trader that the structural barrier has been overcome — partial profit-taking or a trailing stop becomes appropriate.
- Exit on the opposite signal. A sell arrow during an open long position is the indicator's vote that the directional regime has flipped. Different traders combine that with their own exit rules, but the signal itself is a clear, unambiguous event.
This workflow does not replace position sizing, risk management, or capital preservation discipline. It does, however, replace the subjective parts — choosing pivots, drawing trendlines, classifying the current regime — with objective, repeatable readings.
Conclusion
Shadow Flare Indicator combines an adaptive trend engine with automatic liquidity zones, optional volume and RSI filters, a real-time dashboard, and a full alert package, all delivered in non-repainting form for both MetaTrader 4 and MetaTrader 5. The trend engine produces a stable directional bias that does not whipsaw; the liquidity-zone module marks the structural levels where price has historically reversed; the filters block the weakest setups; the dashboard and bar markers give the trader an at-a-glance read of current conditions.
The product is purchased and installed via the MQL5.com Market — the platform's automatic installation pipeline drops the compiled file into the correct MetaTrader folder, places it in the Navigator under Indicators → Market, and synchronises any future version updates without further trader action.
Download the indicator:
- MetaTrader 5: Shadow Flare MT5
- MetaTrader 4: Shadow Flare MT4
CONTACT & SUPPORT
- Email: info@forexobroker.com
- Questions: Use the Comments section on the product page or send a private message
- Bug Reports: Please include your broker name, account type, and a screenshot
-
✅ All MQL Tools: https://www.mql5.com/en/users/forexobroker/ ✅
--------------------------------------------------------------------------------------------------------------
🏦 **Broker I use**: https://icmarkets.com/?camp=55869
🏦 **Broker For EU Traders I use 1**: https://www.ictrading.com?camp=91414
🏦 **Broker I use 2**: https://one.exnessonelink.com/boarding/sign-up/a/c_thuv62ocfq
💻 **VPS**: https://chocoping.com/processing/aff.php?aff=738
💼 **Companies I use for getting funded**:
Fundednext: https://fundednext.com/?fpr=kestutis39
The5ers: https://www.the5ers.com/?afmc=16kl
FTMO: https://trader.ftmo.com/?affiliates=nRAyOhmFRnEnFdOpdLeh
Risk Disclaimer
Trading foreign exchange and CFDs on margin carries a high level of risk and may not be suitable for all investors. You may sustain a loss exceeding your initial investment. Trend Quorum is a technical analysis tool and does not guarantee profitable trades. Past performance is not indicative of future results. The authors accept no liability for any loss arising from use of the indicator. By using Trend Quorum you acknowledge sole responsibility for your trading decisions.


")
![[XAUUSD]: Weekly Liquidity Activation Points (timings), June 22-26, 2026](https://c.mql5.com/6/1013/splash-preview-771790.png "[XAUUSD]: Weekly Liquidity Activation Points (timings), June 22-26, 2026")
")