Master Tape Reading with the Ultimate Market Structure Indicator for MT4 and MT5
Welcome to a new era of chart clarity. If you are struggling to identify the true market direction or find yourself constantly falling into breakout traps, your chart analysis needs a structural upgrade. We are proud to announce the release of the Market Structure Indicator, a professional-grade charting tool now officially available on the MQL5 Marketplace.
While this indicator utilizes terminology popularized by Smart Money Concepts (SMC) and the Inner Circle Trader (ICT) methodologies, it is absolutely not restricted to those trading styles. Market structure is the universal language of financial markets. Whether you are a classic price action trader, a swing trader, or a scalper, mastering tape reading requires a flawless understanding of structural highs, lows, and liquidity pools. This indicator serves as your automated tape reading assistant, stripping away the noise to reveal the true institutional footprint.
How to Trade Using the Indicator (ICT and SMC Approach)
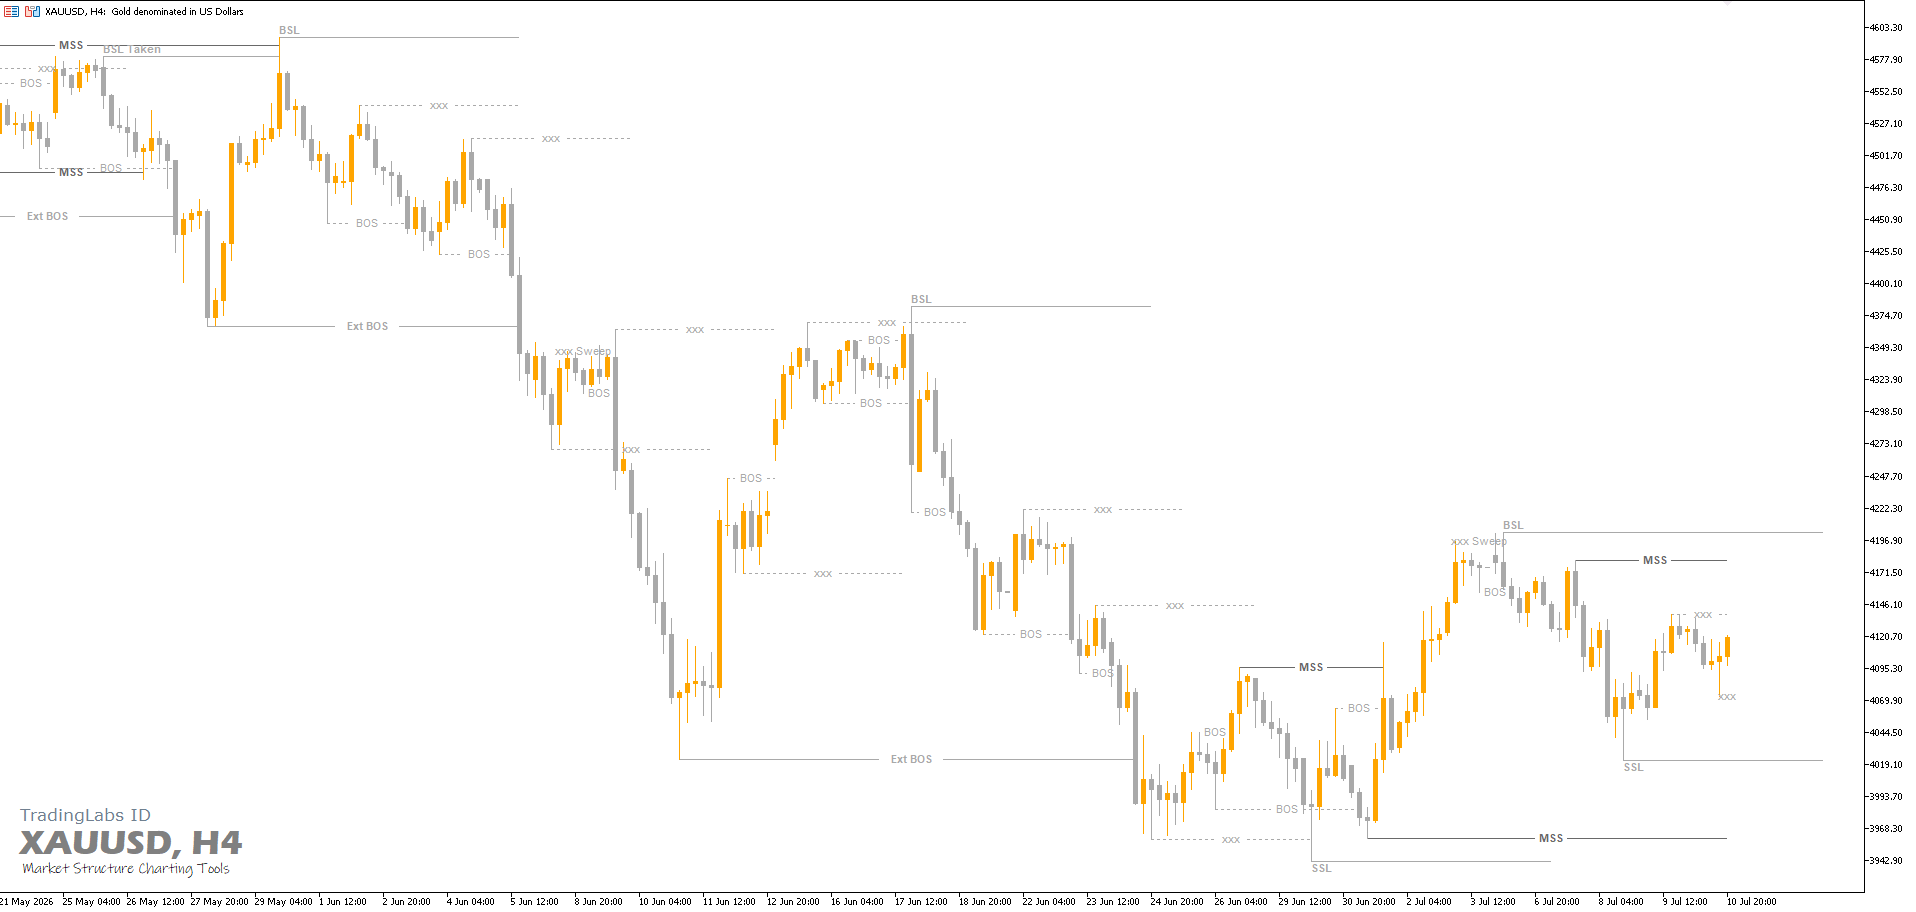
To maximize the potential of this tool, you can apply standard institutional order flow concepts directly to the signals it provides. Here is a step-by-step guide on how to read the tape using our indicator:
1. Establish the Higher Timeframe Narrative Start by looking at the External Structure. The indicator will plot major trend continuations as Ext BOS (Break of Structure). This tells you the macro direction of the market. The algorithm also automatically projects BSL (Buy Side Liquidity) and SSL (Sell Side Liquidity) lines into the future. These are your ultimate targets or areas where you should anticipate a market reaction.
2. Identify the Liquidity Purge Retail traders often buy breakouts, while institutions fade them. The indicator is engineered to detect the exact moment a breakout fails. If the price pierces a key external or internal level with a wick but fails to close beyond it, the algorithm immediately prints a Sweep or Taken label upon candle close. This is your primary warning that a liquidity run has occurred and a trap has been set.
3. Confirm the Shift in Order Flow A liquidity sweep alone is not enough to enter a trade; you must wait for the market to confirm its new direction. Our tool features a dedicated reversal engine. After a sweep, look for the indicator to print an MSS (Market Structure Shift) or CHoCH (Change of Character). This specific split-line prints when the opposing structure is broken, confirming that institutional order flow has officially reversed.
4. Execute on Internal Structure Once the MSS or CHoCH is confirmed, you do not need to chase the price. Wait for the market to retrace into a premium or discount array. During this retracement, the indicator continues to map the Internal Structure. You will see minor liquidity points labeled as xxx and internal continuations labeled as BOS. Use these internal shifts to pinpoint precise, low-risk entries that align perfectly with the newly established institutional trend.
Key Technical Advantages
-
Strictly Non-Repainting: The algorithm is hard-coded to ignore running candles. All structural breaks, sweeps, and text labels are only validated upon candle close. What prints on your historical chart is exactly what happened in real-time.
-
Ultra-Clean Split-Line UI: To prevent chart clutter, we designed a modern interface where structure labels are seamlessly embedded directly into the center of the lines, giving your eyes room to focus on price action.
Upgrade Your Trading Arsenal Today
Stop guessing where the liquidity is resting and start trading with algorithmic precision. Get your copy from the MQL5 Marketplace using the links below:
Download for MetaTrader 5: https://www.mql5.com/en/market/product/184939
Download for MetaTrader 4: https://www.mql5.com/en/market/product/184940


![[EURUSD]: Weekly Liquidity Activation Points (LAP), October 12-16, 2026](https://c.mql5.com/6/1035/splash-preview-777305.png "[EURUSD]: Weekly Liquidity Activation Points (LAP), October 12-16, 2026")