
TLV Language (Time Language VISTmany)
Foundation
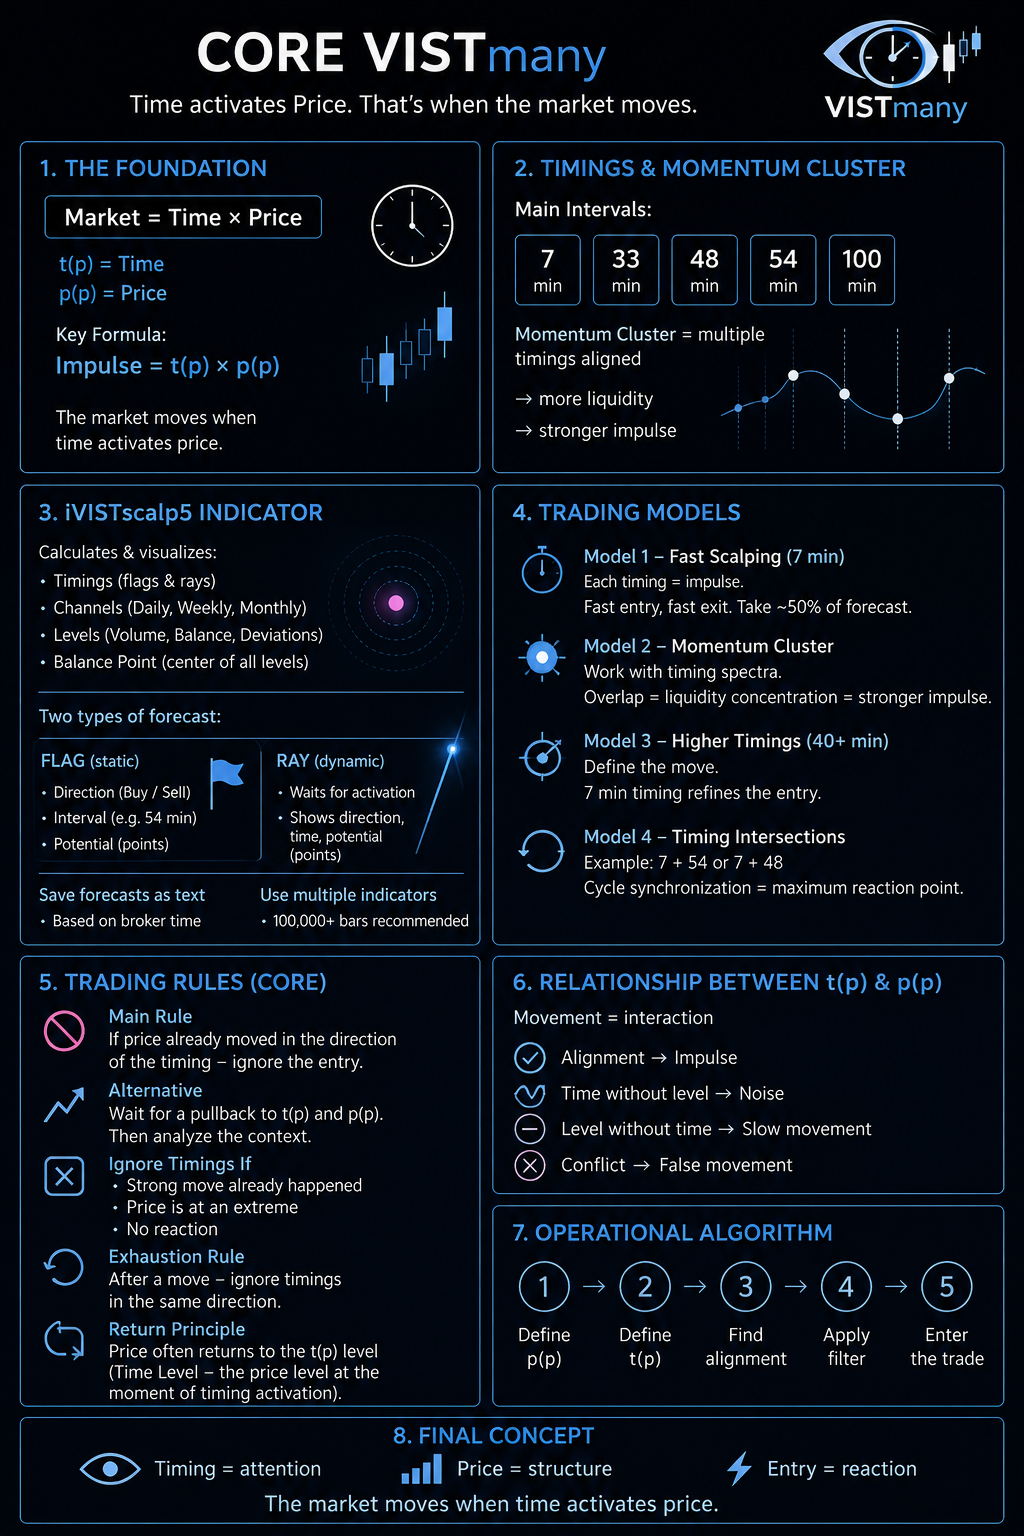
Market = Time × Price
t(p) — Time
p(p) — Price
Standard Terminology
Liquidity Activation Point (LAP) = liquidity activation moment
(acceptable alternative: timing)
Momentum Cluster = timing spectrum = a group of timings creating an impulse
t(p) — Time Level = the price level at the moment of timing activation
p(p) — Price Level = price levels (structure: Channels, Levels, Balance )
Time–Price Alignment (TPA) = synchronization between time and price
Impulse = activation result
Exhaustion = movement exhaustion
Key Formula:
Impulse = t(p) × p(p)
Core Idea
The market does not move because of price.
The market does not move because of time.
The market moves when time activates price.
Timing Concepts and Momentum Cluster
Liquidity Activation Points (Timings)
These are pre-calculated moments in time generated by the iVISTscalp5 indicator.
Liquidity activation points (timings).
7 minutes
33 minutes
48 minutes
54 minutes
100 minutes
Role of the Intervals
7 min → execution entry
33 min → local impulse
48 / 54 min → main intraday impulse
60 / 100 min → structural impulse
Higher timings define the primary impulse of the day.
Lower timings refine the entry point.
However, you may choose any time intervals.
Momentum Cluster is not a single timing.
It is the synchronization of multiple timings.
Logic
More timing coincidences → more liquidity
Result
Strong impulse
Acceleration
Stable movement
iVISTscalp5 Indicator
⸻
Purpose
Calculation and visualization of time and price.
What the iVISTscalp5 indicator calculates and builds:
Timings
flags
rays
p(p) — Price Level: Channels, Levels, Balance

A monthly channel with all major levels and deviations has been added to the iVISTscalp5 indicator.
Channels
daily
weekly
monthly
Levels
volume
balance
deviations
Balance Point
center of all levels
(pink circle)
Timing Visualization
(The iVISTscalp5 indicator simultaneously calculates two forecast types.)
Flag — fixed element on the chart
Shows:
direction (buy / sell)
time interval (for example: 54 minutes)
potential (points)
Ray — dynamic element on the chart
Logic:
“waits” for activation.
At the activation moment → attaches to price.
Shows:
direction
time
length = movement potential (points)
Additional Features
It is possible to assign the same value to both the flag and the ray.
Timings can be saved in text format
(indicator setting: saveForecast = true)
→ folder: MQL5 / Files

Calculations use broker time
(the iVISTscalp5 indicator automatically detects broker time).
Inside the indicator, you can:
disable price levels and keep only timings
use multiple indicators simultaneously
MT5 history bars setting:
minimum 100000 bars
*****************************************************************************
iVISTscalp5 indicator - Welcome to the world of time!
The system projects time, direction, and expected movement
through Liquidity Activation Points (timings). Timing-Based Market Forecasting System