
Time-Based Financial Market Research Major Directions of Time Analysis and the Difference of the TLV System

Introduction
Most modern approaches to financial market analysis are built around:
price,
volume,
liquidity,
market structure.
However, throughout history, a separate direction of research has existed where time played the central role.
Different researchers and trading schools attempted to answer one fundamental question:
Can time shape market movement?
This question became the foundation of multiple time-based methodologies.
Today, several major directions of market time analysis exist:
cycle analysis,
Gann theory,
session timing,
liquidity timing,
market profile,
quantitative timing models,
volatility timing,
HFT execution timing,
astro cycles,
delivery algorithms.
However, most existing systems study:
cycles,
liquidity behavior,
intraday timing,
statistical timing patterns.
TLV (Time Language VISTmany) approaches the market differently: as a nonlinear interaction system between time and price.
⸻
Major Directions of Time-Based Analysis
⸻
1. W.D. Gann Theory
One of the earliest known researchers of market timing was W.D. Gann.
Core ideas:
cycles,
market geometry,
time-price symmetry,
angles,
dates,
timing reversals.
Gann viewed the market as a structure governed by mathematical and timing laws.
Limitations
Despite its revolutionary nature:
Gann theory did not analyze liquidity activation,
did not use timing spectra,
did not study nonlinear impulse structures,
did not create dynamic weekly timing forecasting systems.
⸻
2. Session Timing / ICT Concepts
Modern approaches, including ICT (Inner Circle Trader), actively use timing concepts.
Core elements:
kill zones,
session liquidity,
London open,
New York open,
liquidity sweeps,
delivery algorithms.
The core idea: the market activates liquidity during specific session periods.
Limitations
These models:
are mostly session-dependent,
do not create weekly timing forecasting systems,
do not use timing spectra,
do not study Time–Price Alignment (TPA).
⸻
3. Market Profile and Time Auction Theory
Market Profile studies:
time distribution,
price acceptance,
auction market behavior.
Time is used as a factor of:
acceptance,
rejection,
rotation.
Limitations
This approach:
does not forecast timing activation points,
does not study timing intersections,
does not build nonlinear timing structures.
⸻
4. Quantitative Timing Models
Large quantitative systems use:
volatility timing,
execution timing,
statistical timing behavior,
intraday timing patterns.
This is especially common in:
HFT,
algorithmic execution,
volatility forecasting.
Limitations
Most of these systems:
are closed infrastructures,
have no visual framework,
do not create public timing methodologies,
are not focused on market behavior research through timing structures.
⸻
5. Astro Cycles and Cycle Research
A separate direction of cycle research studies:
planetary cycles,
moon cycles,
seasonal timing,
macro cycles.
Limitations
These approaches often:
lack market structure integration,
do not use liquidity analysis,
do not build adaptive timing systems.
⸻
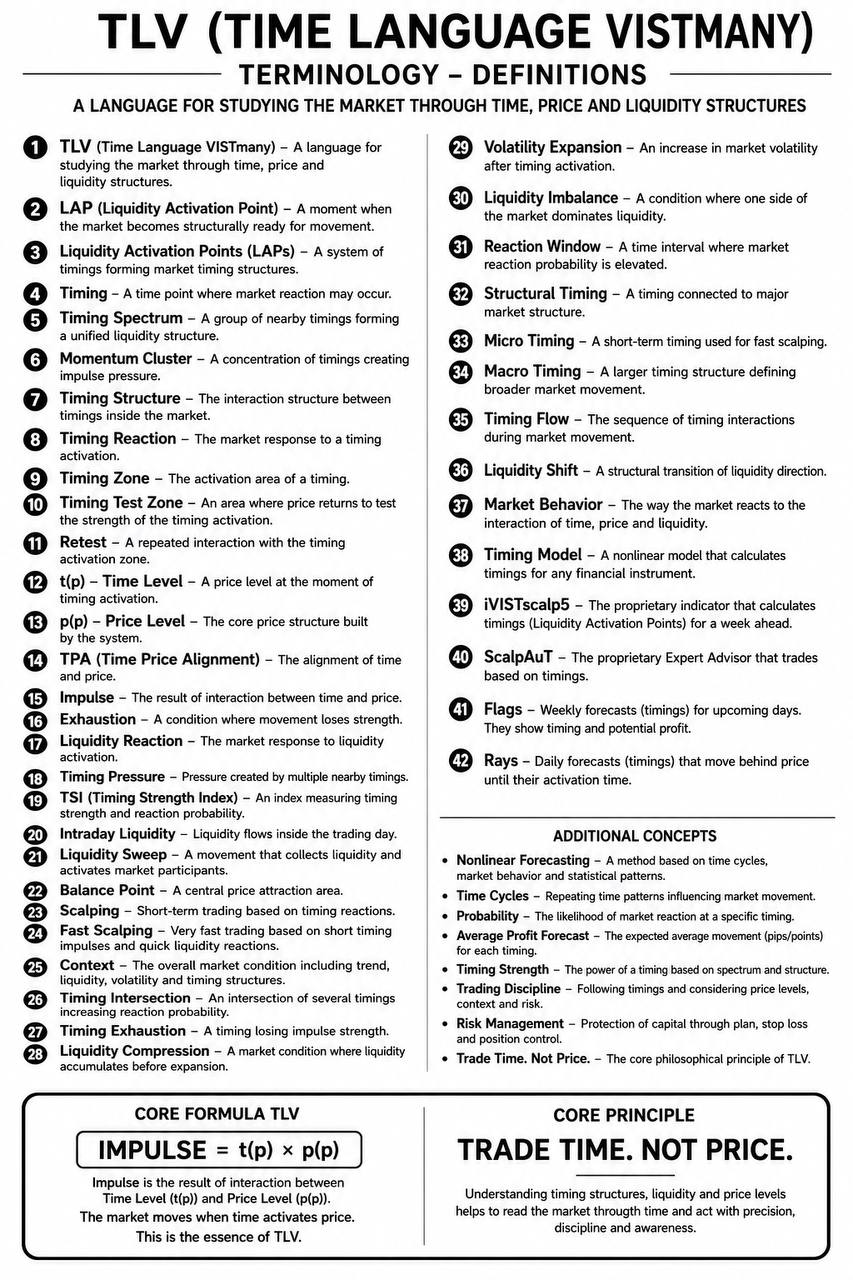
What TLV Researches
TLV (Time Language VISTmany) studies the market as a nonlinear interaction system between:
time, price, liquidity, timing activation.
⸻
Core TLV Formula
Impulse = t(p) × p(p)
where:
t(p) — Time Level
p(p) — Price Level
⸻
Core TLV Idea
The market does not move because of price. The market does not move because of time.
The market moves when time activates price.
⸻
What TLV Studies
The TLV system researches:
Liquidity Activation Points (LAP)
timing structures
timing spectra
Momentum Clusters
Time–Price Alignment (TPA)
timing intersections
timing exhaustion
timing test zones
nonlinear impulse behavior
liquidity reactions
retest structures
⸻
Timing Spectrum
One of the key differences of TLV is: the study of timing spectra.
Timing Spectrum — a group of timings creating combined liquidity pressure.
This differs from classical time-based analysis where only isolated timing events are analyzed.
⸻
Timing Test Zone
Another major component of the system is: the Timing Test Zone.
After impulse activation, the market often:
returns to the activation zone,
tests the timing zone,
checks liquidity balance.
This behavior model is used:
to analyze impulse strength,
to identify exhaustion,
to estimate continuation probability.
⸻
Weekly Timing Forecasting
One of the most unique parts of the system is: weekly timing forecasting.
Currently:
the system calculates timing structures one week ahead,
for any financial instrument available in MT5.
The system works with:
multiple timing intervals,
different market structures,
various liquidity conditions.
⸻
System Scalability
The current version focuses on: weekly forecasting.
However, the system architecture allows:
larger forecasting horizons,
larger timing cycle research,
longer-term market structure analysis.
This represents the next stage of research.
⸻
Technology Architecture
The TLV system was developed:
in C++,
integrated into MQL5,
for the MetaTrader 5 platform.
The current implementation exists as: the iVISTscalp5 indicator.
⸻
Web Version
In addition to the MT5 version, a web architecture has also been developed:
Python + C++
nonlinear timing calculations
web timing infrastructure
This allows:
system scalability,
platform-independent calculations,
development of an independent timing ecosystem.
⸻
Platform Flexibility
The architecture allows:
adaptation to any trading platform,
standalone timing systems,
cloud timing analysis.
Meaning: the TLV methodology itself is not dependent on a specific platform.
⸻
The Main Difference of TLV
Most existing time-based systems study:
cycles,
statistics,
sessions,
delivery timing.
TLV studies: the nonlinear interaction between time and price through liquidity activation.
⸻
TLV Is Not Just an Indicator
It is:
a research framework,
a timing language,
a nonlinear market model,
a visual timing laboratory,
an educational timing ecosystem.
⸻
Conclusion
Financial markets remain one of the most complex nonlinear systems.
Most research focuses on:
price,
volume,
liquidity,
statistics.
TLV studies: how time interacts with price and activates market movement.
The project remains in a stage of continuous research and development.
The primary goal of the system is not to create “magic signals,” but to study market behavior through time.
**********************************************************************************
The market moves when time activates price.
iVISTscalp5 indicator - Welcome to the world of time!
The system projects time, direction, and expected movement
through Liquidity Activation Points (timings). Timing-Based Market Forecasting System



![[iVISTscalp5]: XAUUSD. Forecast First. Market Reaction Afterwards](https://c.mql5.com/6/1035/splash-preview-777232.png "[iVISTscalp5]: XAUUSD. Forecast First. Market Reaction Afterwards")