")
Pivot Point Shift Supertrend Indicator -- Complete User Manual (MT4 & MT5)

Introduction
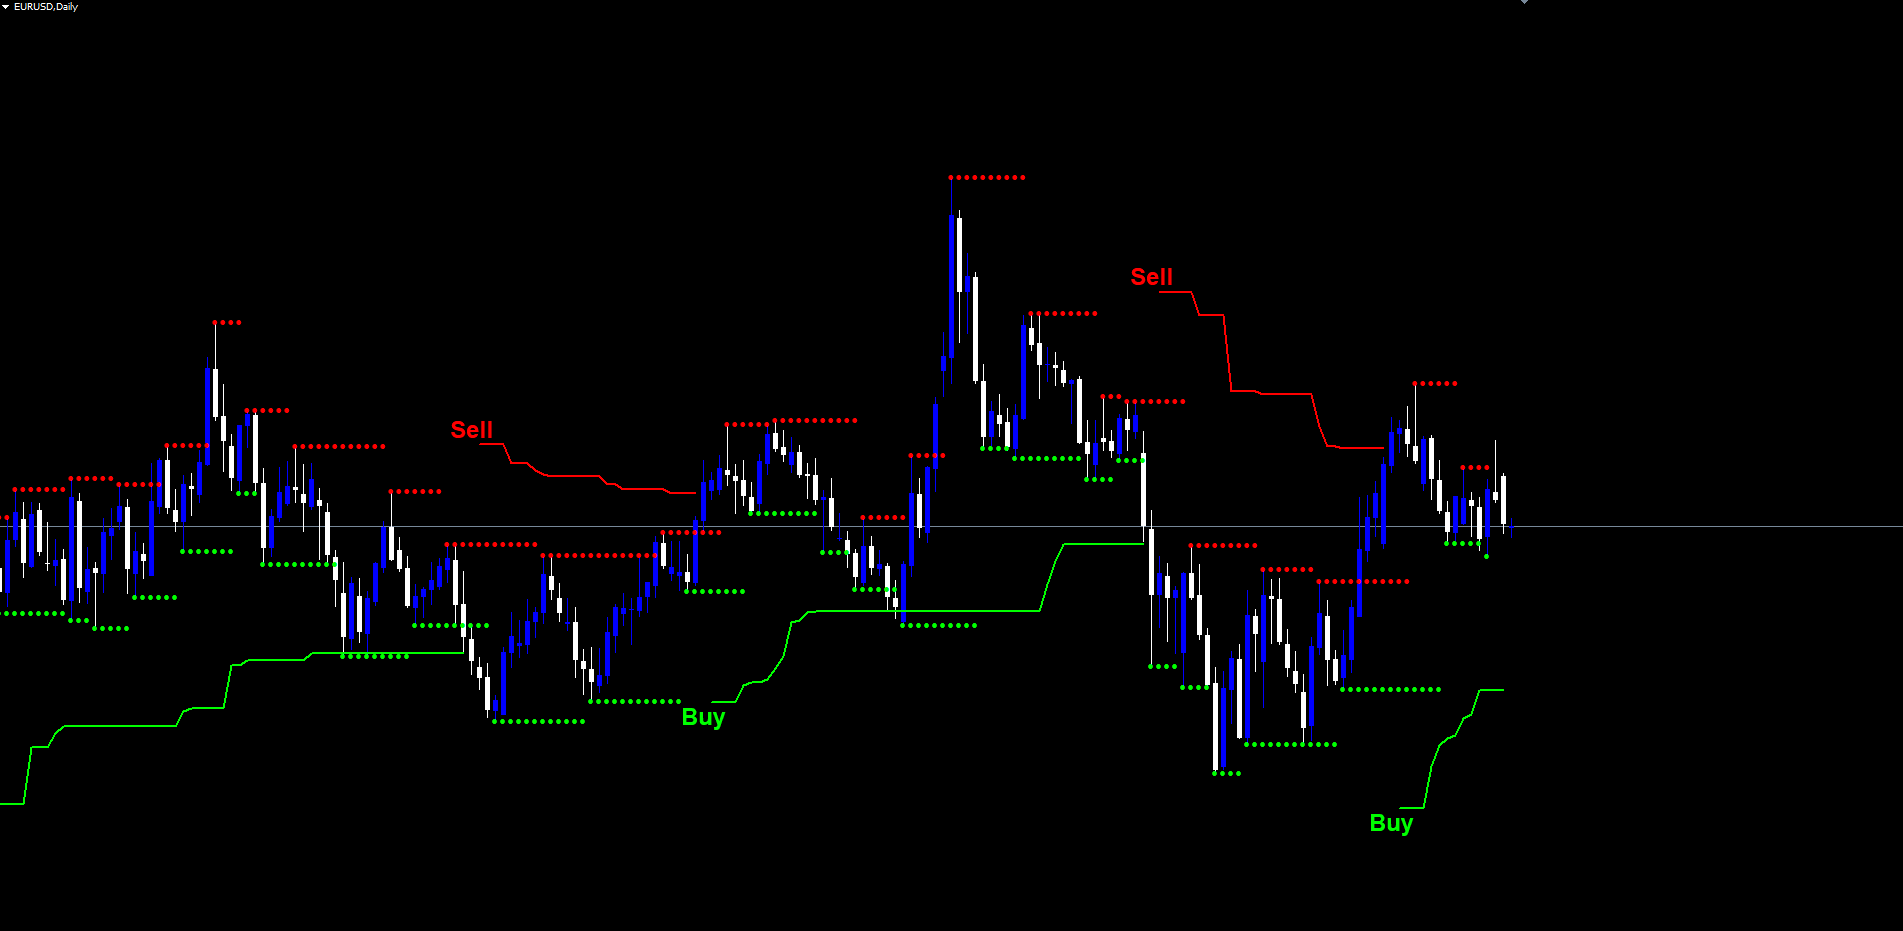
The Pivot Point Shift Supertrend Indicator is a non-repainting trailing supertrend system for MetaTrader 4 and MetaTrader 5. Unlike classic SuperTrend, which anchors its bands to the moving hl2 midpoint, this indicator anchors them to a weighted average of confirmed pivot points. The result is a trend-following line that holds steady through normal volatility and only flips when market structure genuinely shifts.
Key Features:
- Pivot-Anchored Bands: ATR bands centered on a weighted moving pivot value, not on the moving hl2 midpoint
- Weighted Center Line Update: new pivots blend with existing structure using a 2:1 weighted formula
- Trailing Supertrend Logic: bands tighten with the trend and never give back ground, mirroring classic SuperTrend behavior
- Non-Repainting Signals: all logic runs on closed bars; signals never move or disappear once printed
- Buy / Sell Trend Flip Labels: large, configurable labels at the exact bar of each trend transition
- Optional Pivot H/L Labels: see every detected pivot directly on the chart
- Optional Support / Resistance Markers: running pivot levels drawn as discrete dot markers
- Optional Center Line: weighted center line with directional color (blue below hl2 , red above)
- Three Alert Events: Buy, Sell, and Trend Changed
- Four Delivery Channels: popup, sound, push notification, email
- MT4 + MT5 Parity: 100% identical signal and visual logic between platforms
Download the indicator:
- MetaTrader 5: Pivot Point Shift Supertrend MT5
- MetaTrader 4: Pivot Point Shift Supertrend MT4
TIP: This indicator is designed for trend-following traders who want a structural anchor for their supertrend bands rather than a moving average that reacts to every wick. It works on any symbol and any timeframe available in MetaTrader.
Understanding Pivot-Anchored SuperTrend
The indicator combines three classic technical analysis concepts in a specific sequence: pivot point detection, ATR-based banding, and trailing-stop logic.
1. Pivot Detection. A pivot high at bar N is confirmed when the bar's high is greater than the highs of Pivot Point Period bars on each side. A pivot low is the mirror -- a bar with a low less than the lows of surrounding bars. The default Pivot Point Period = 2 requires two bars of confirmation on the right, which means a pivot at bar N cannot be detected until bar N+2 . This is the price of non-repainting integrity.
2. Weighted Center Update. When a new pivot is confirmed, the indicator updates an internal center value using new_center = (old_center * 2 + new_pivot) / 3 . This blends one third of the new pivot with two thirds of the existing center, producing a smoothly drifting structural midpoint that does not jerk on every new pivot.
3. ATR Bands. The upper and lower bands are placed at Up = center - ATR_Factor * ATR and Dn = center + ATR_Factor * ATR . With defaults ATR_Factor = 3.0 and ATR_Period = 10 , the bands are wide enough to ride out normal pullbacks.
4. Trailing Rule. On every closed bar, the lower band can only rise (when the previous close was above it) and the upper band can only fall (when the previous close was below it). This is the standard SuperTrend trailing-stop logic.
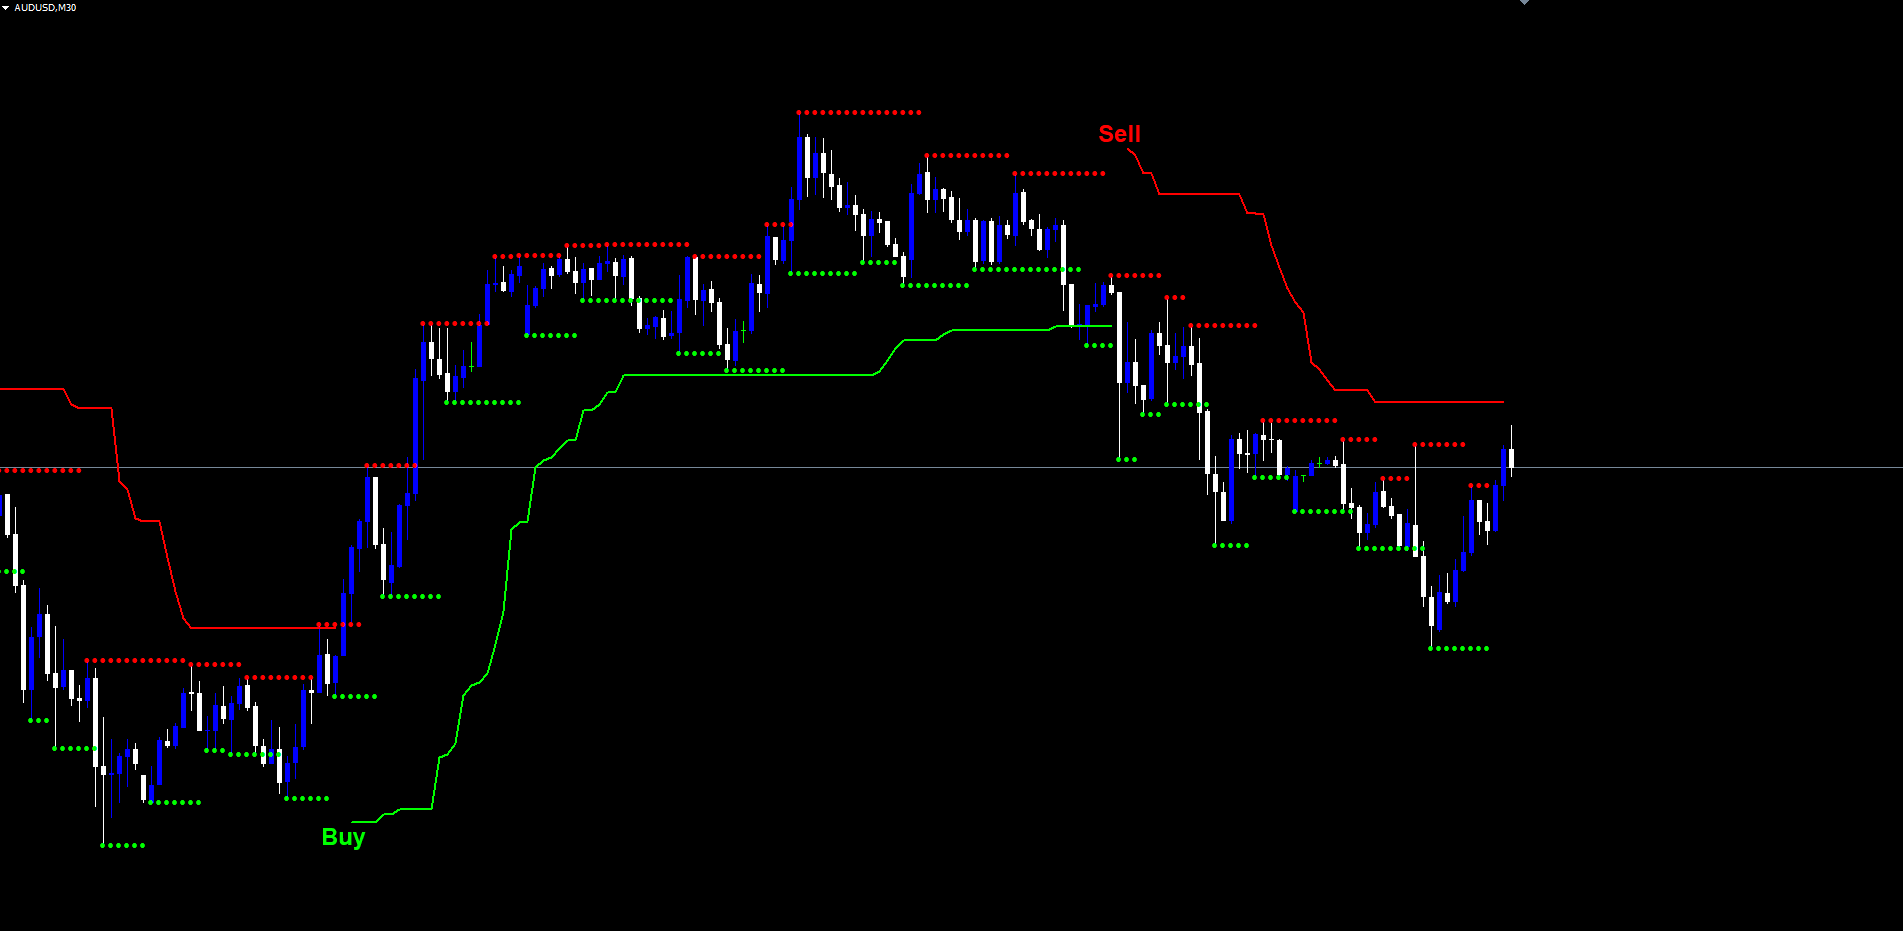
5. Trend Flip. When the close crosses the trailing lower band downward, the trend is set to -1 ; when it crosses the trailing upper band upward, the trend is set to +1 . The chart line displays whichever band is currently active, colored lime in an up trend and red in a down trend.
6. Signal. A change in trend value from one bar to the next is the signal. +1 -> -1 prints a Sell; -1 -> +1 prints a Buy.
NOTE: Because the indicator requires Pivot Point Period bars of confirmed data on the right side of every pivot before detecting it, there is a small built-in confirmation lag (default: 2 bars). This is what makes the signals non-repainting -- the pivot must be fully confirmed before any band update or signal can occur.
Installation Guide
The Pivot Point Shift Supertrend Indicator is distributed through the MQL5.com Market. Installation is automatic.
Steps:
- Purchase the indicator from the MQL5 Market product page
- The indicator installs automatically into your MetaTrader terminal
- Open MetaTrader and press Ctrl+N to open the Navigator panel
- Expand Indicators > Market
- Locate Pivot Point Shift Supertrend Indicator in the list
- Drag the indicator onto any chart, or double-click its name
- The settings dialog appears -- adjust parameters as needed (see sections below)
- Click OK to apply
After loading, you will see:
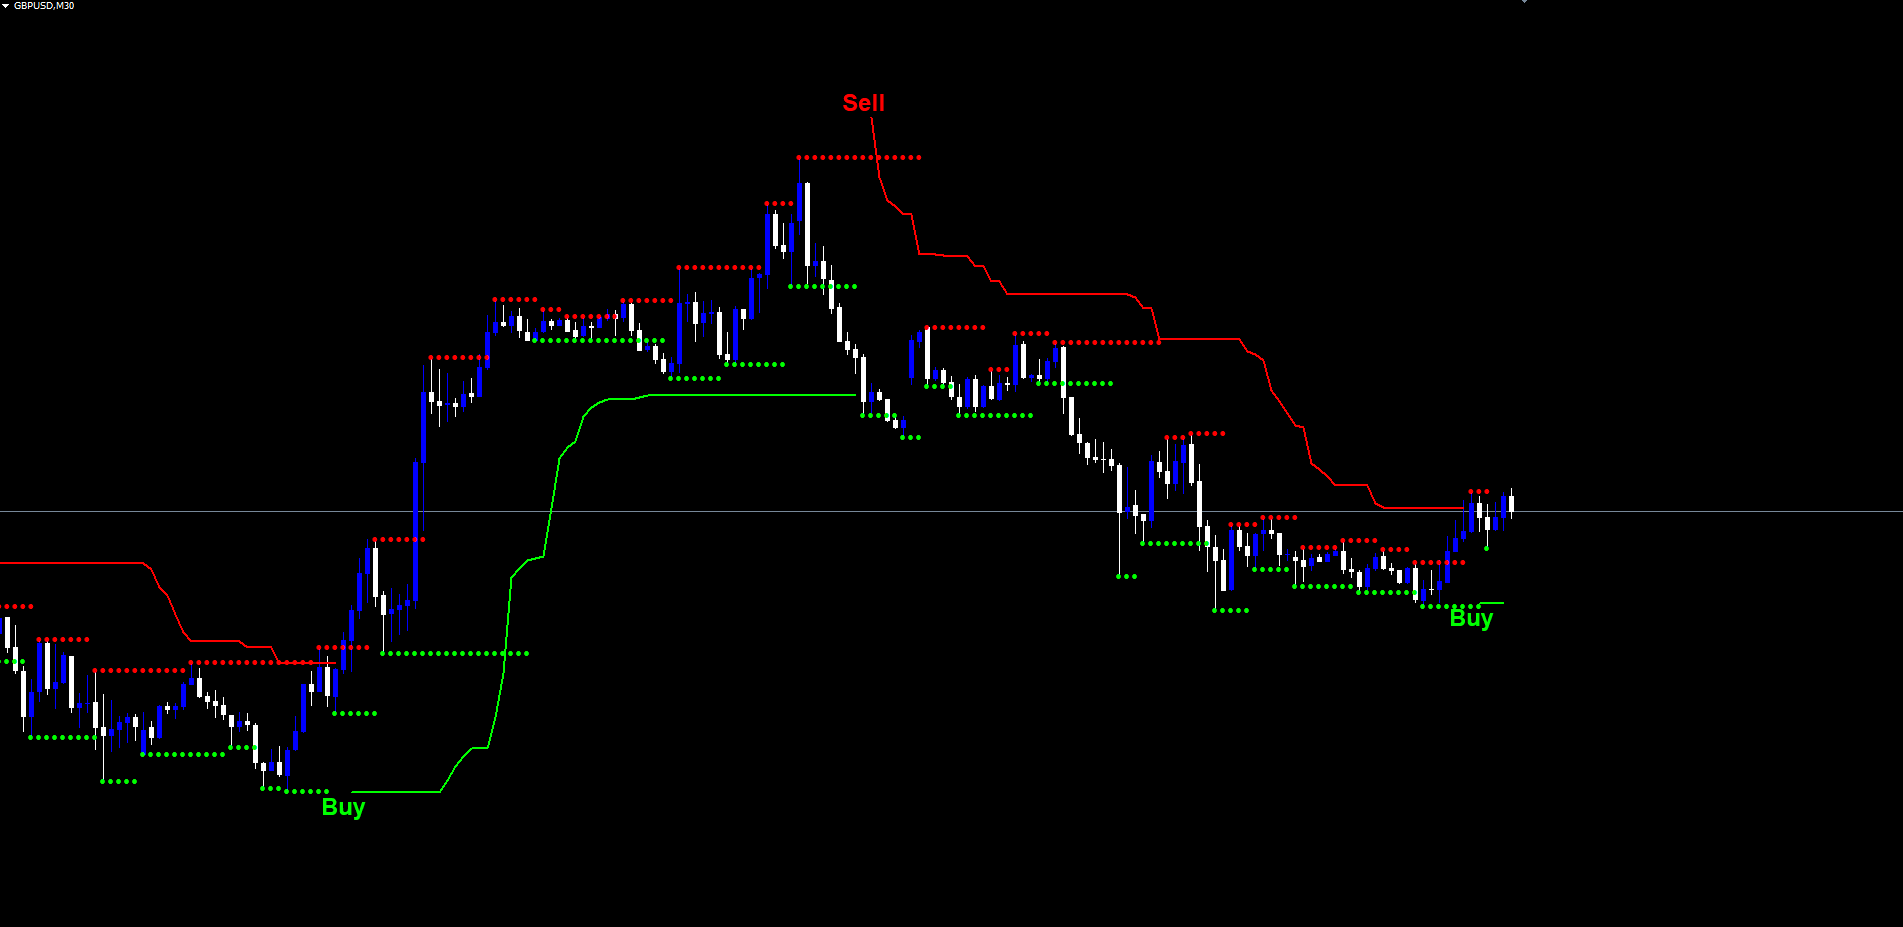
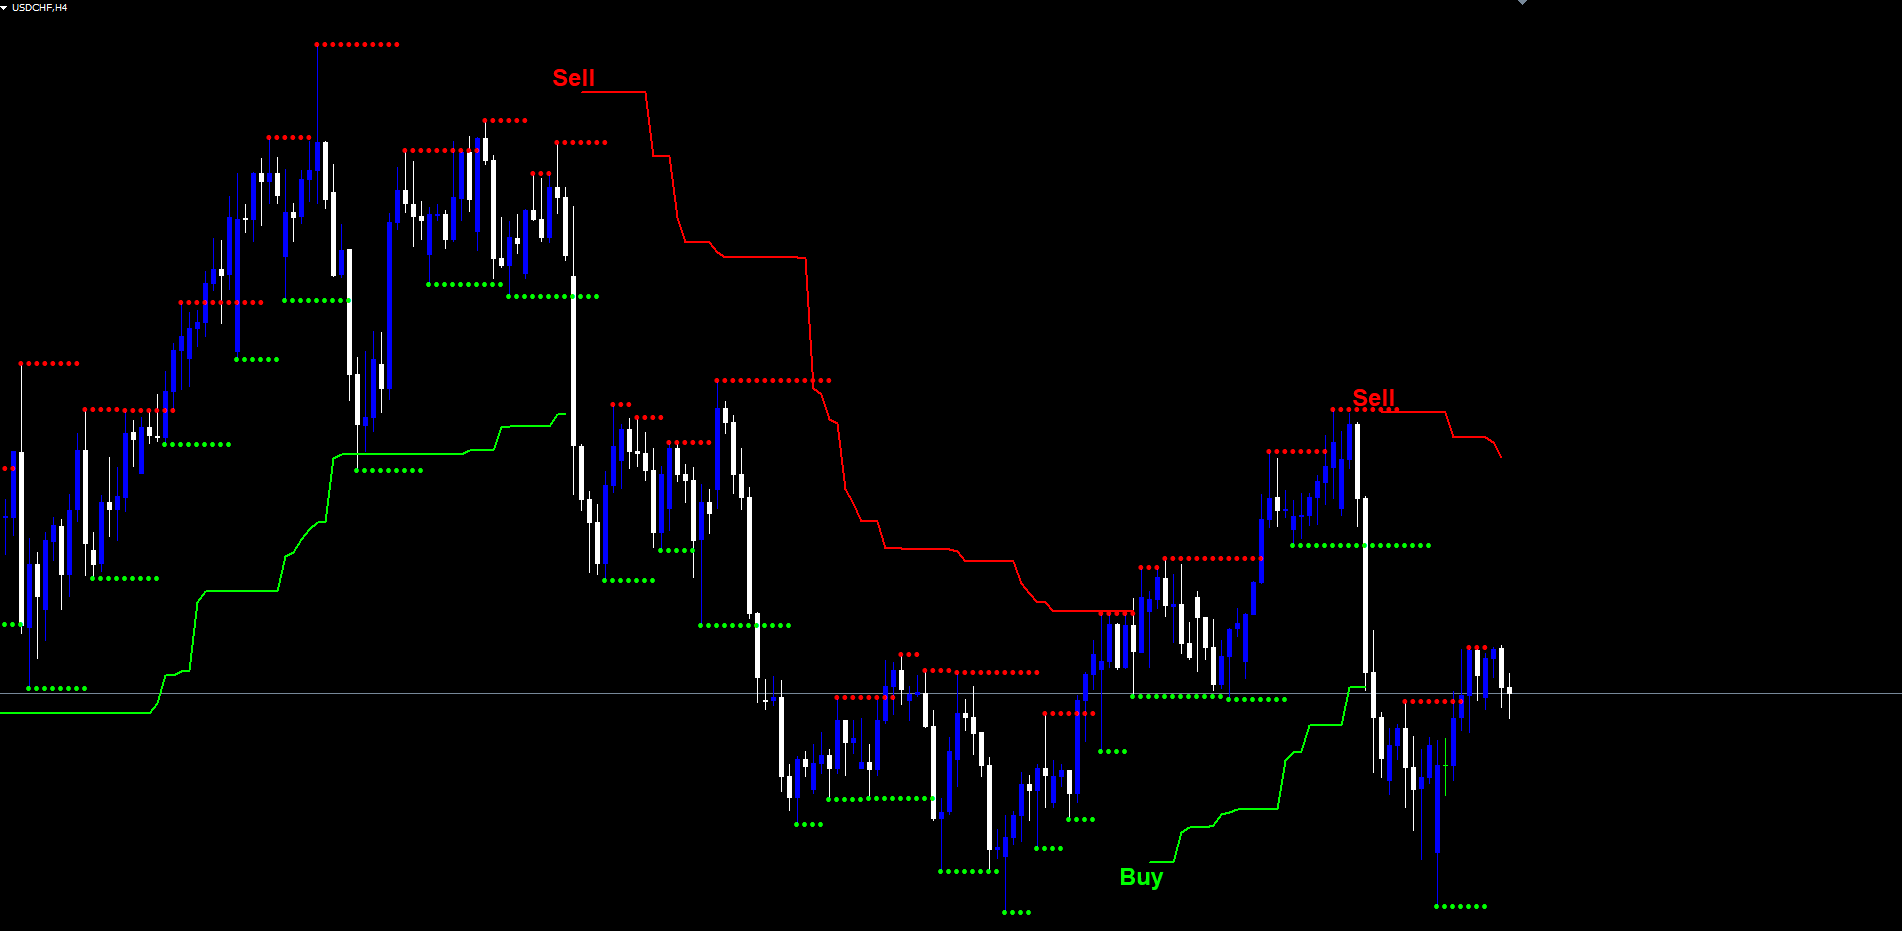
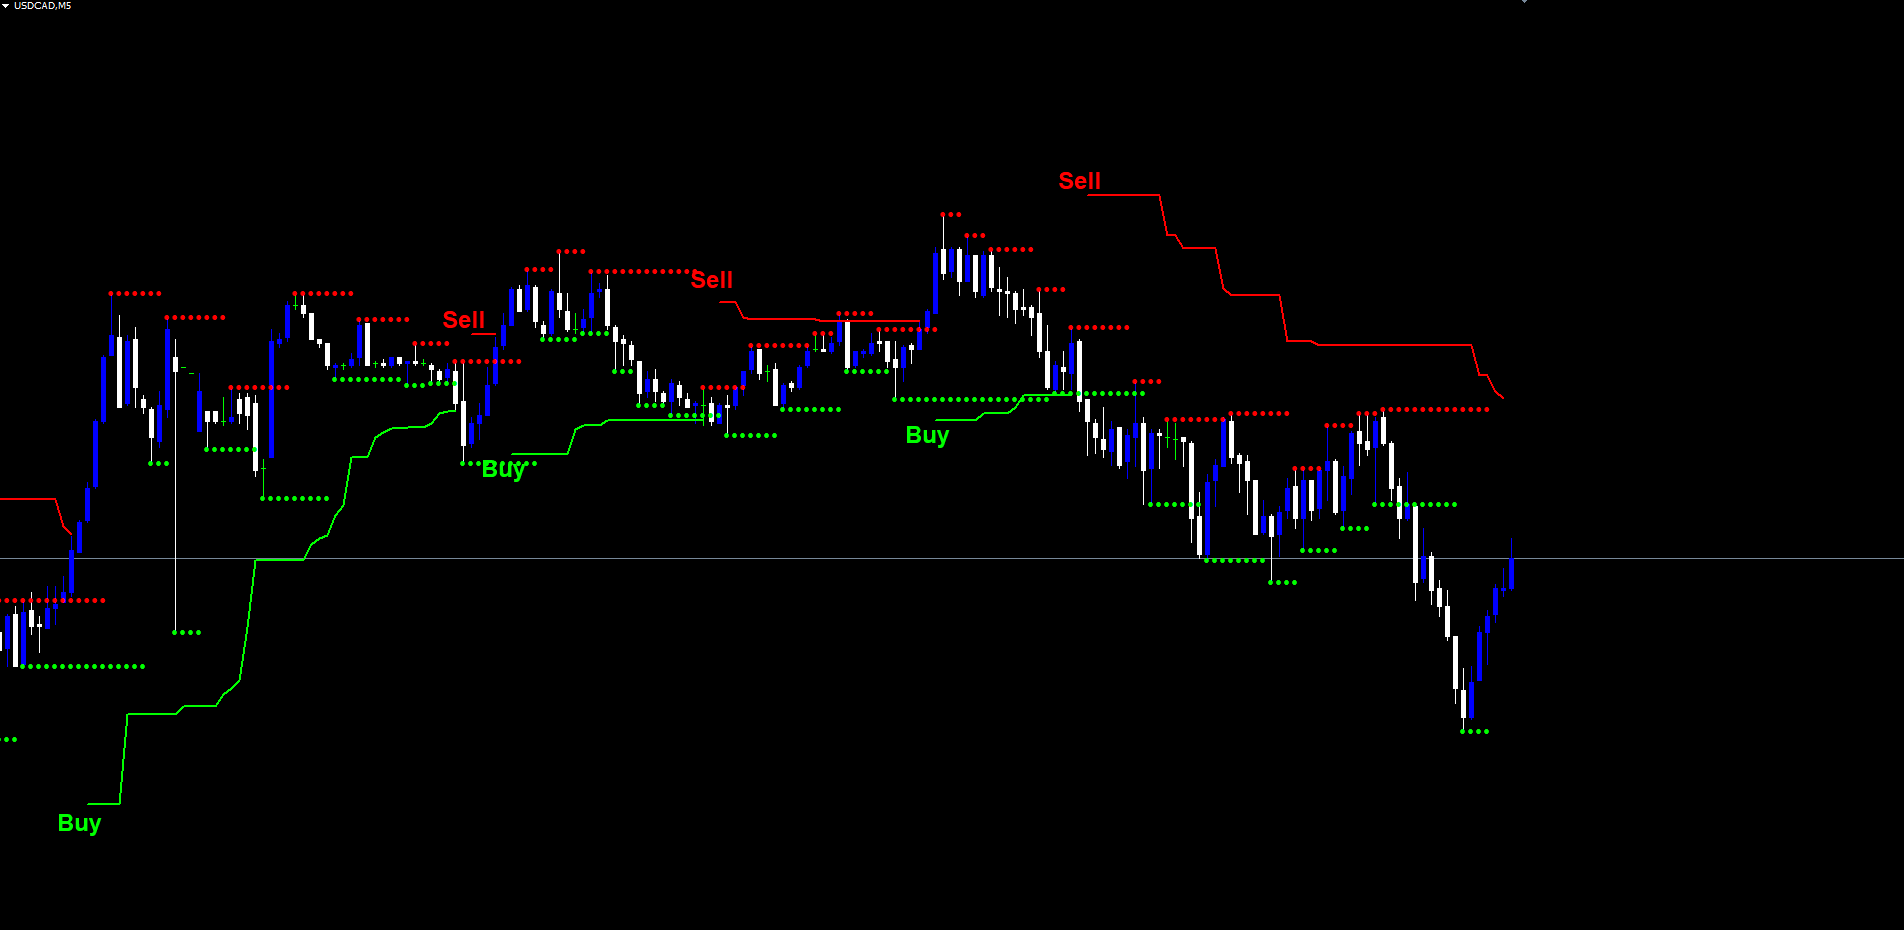
- A trailing supertrend line (lime in up trends, red in down trends)
- Buy / Sell labels at trend flip bars (if Show Buy/Sell Labels = true )
- Pivot H / L labels at every confirmed pivot (if Show Pivot Points = true )
- A dotted center line (blue or red, if Show PP Center Line = true )
- Support / resistance dot markers (if Show Support/Resistance = true )
IMPORTANT: Do not manually copy files to the data folder. The MQL5 Market handles all file placement and updates automatically.
Signal System Overview
Each trend flip generates two visual events on the chart:
1. Trend Line Color Change. At the bar of the flip, the line transitions from one color to the other (lime <-> red). The flip bar itself is drawn as a one-bar gap to make the transition visually obvious -- you will not see a smooth color blend, you will see a clean handoff.
2. Buy / Sell Label. A text label is placed at the trailing supertrend value on the flip bar. Buy labels are drawn in Buy Label Color (default lime) and Sell labels in Sell Label Color (default red). Buy/Sell label font size is automatically doubled relative to the base Label Font Size to keep them visible on busy charts.
Non-Repainting Confirmation:
- All trend logic runs on closed bars only ( shift >= 1 ); the forming bar is explicitly cleared
- Once a Buy or Sell label appears, it is permanent -- it never moves, re-colors, or disappears
- What you see in historical data is exactly what would have appeared in real time
Indicator Logic Settings
These three parameters control the core supertrend calculation. Most users adjust only these and leave the visibility toggles at their defaults.
| Parameter | Default | Description |
|---|---|---|
| Pivot Point Period | 2 | Bars on each side required to confirm a pivot. Range 1-50. Higher values produce fewer but more significant pivots. |
| ATR Factor | 3.0 | Distance from the center to each band, as a multiple of ATR. Range >= 0.1 with step 0.1. Higher values produce wider bands and fewer flips. |
| ATR Period | 10 | Lookback for the Average True Range calculation. Range >= 1. Default 10 matches the original Pine Script. |
Tuning rules of thumb:
- For more flips on the same chart, decrease ATR Factor from 3.0 to 2.0
- For fewer flips and a more stable trend, increase ATR Factor to 4.0 or 5.0
- For higher-resolution pivots (more pivots detected), keep Pivot Point Period = 2 (default)
- For more selective pivots (only major swings), increase Pivot Point Period to 5 or 10
TIP: Start with the defaults on H1 charts. They are the original Pine Script defaults and have been validated by thousands of TradingView users. Modify one parameter at a time and observe the effect on flip frequency and signal quality before committing to a custom configuration.
Visibility Toggles
The indicator's visual layers can be turned on or off independently. By default only the trailing supertrend line and Buy/Sell labels are shown -- the rest are off to keep the chart clean. Enable additional layers when you want to see the underlying calculation directly.
| Parameter | Default | Description |
|---|---|---|
| Show Pivot Points | false | Print H / L text labels at every confirmed pivot |
| Show Buy/Sell Labels | true | Print Buy / Sell text labels at trend flips |
| Show PP Center Line | false | Draw the weighted center line in dotted blue/red |
| Show Support/Resistance | false | Draw running pivot lows/highs as dot markers |
When to enable each:
- Show Pivot Points: Useful when tuning Pivot Point Period . You can see exactly which bars are being detected as pivots and how the spacing changes with different period values.
- Show PP Center Line: Useful for understanding why the bands move when they do. The center line is the anchor; the bands are always ATR_Factor * ATR above and below it. The blue/red color indicates whether the center is below or above the bar's hl2 .
- Show Support/Resistance: Useful for traders who want pivot levels as horizontal context for their trading decisions. The most recent pivot low becomes the running support; the most recent pivot high becomes the running resistance.
Alert Configuration
The indicator supports three alert events and four delivery channels.
Alert Channels
| Parameter | Default | Description |
|---|---|---|
| Popup Alert | true | Show on-screen popup dialog |
| Email Alert | false | Send email via the configured MT SMTP |
| Push Alert | false | Send push notification to the MetaTrader mobile app |
| Play sound | true | Play the configured sound file |
| Sound file | alert.wav | Filename in the MetaTrader Sounds folder |
Alert Events
| Parameter | Default | Description |
|---|---|---|
| Alert on Buy Signal | true | Trend flip from -1 to +1 |
| Alert on Sell Signal | true | Trend flip from +1 to -1 |
| Alert on any Trend Change | false | Catch-all -- fires for any flip |
The Trend Changed alert is independent of the Buy and Sell alerts. A trader who only wants notification on direction changes can enable just this one alert. A trader who wants distinct messaging for Buy vs Sell can enable both Buy and Sell separately while leaving Trend Changed disabled.
Alert messages include the symbol and timeframe in a fixed format:
EURUSD H1: PPSST Buy Signal
Each alert fires at most once per bar per signal type. If many ticks arrive on a flip bar after the close, the alert is not duplicated.
Enabling Push Notifications
- Install the MetaTrader mobile app on your phone (iOS or Android)
- Open the app and go to Settings > Messages
- Copy your MetaQuotes ID
- In desktop MetaTrader, go to Tools > Options > Notifications
- Enter your MetaQuotes ID and enable notifications
- Set Alert Push = true in the indicator settings
Enabling Email Notifications
- In MetaTrader, go to Tools > Options > Email
- Check Enable
- Enter your SMTP server, port, login, password, and destination email
- Click Test to verify the configuration
- Set Alert Email = true in the indicator settings
Visual Customization
Colors, font, and label sizes are all configurable. The defaults match the original Pine Script color scheme.
| Parameter | Default | Description |
|---|---|---|
| Buy label color | clrLime | Color for Buy text labels |
| Sell label color | clrRed | Color for Sell text labels |
| Pivot High color | clrRed | Color for H labels at pivot highs |
| Pivot Low color | clrLime | Color for L labels at pivot lows |
| Label font size | 9 | Base font size. Buy/Sell labels are auto-doubled (default 18) |
| Label font | Arial Bold | Font face for all text labels |
| Chart object prefix | PPSST_ | Prefix for all indicator-created chart objects |
Label sizing. The Buy and Sell trend-flip labels are intentionally larger than the pivot H/L labels (they use Label Font Size * 2 ). This keeps them visible on busy charts without making the smaller pivot annotations overwhelming.
Object prefix. Every chart object created by the indicator starts with PPSST_ (or your custom prefix). When the indicator is removed from the chart, all objects with this prefix are automatically deleted. If you accidentally leave the indicator's objects on a chart and need to clean them up manually, you can search by prefix in the Objects List (Ctrl+B).
TIP: If multiple instances of the indicator are loaded on the same chart with different settings (for example, comparing aggressive vs conservative configurations), give each instance a unique Chart object prefix like PPSST_AGGR_ and PPSST_CONS_ so they do not interfere with each other.
Complete Parameter Reference
The following table lists every input parameter in the order it appears in the indicator settings dialog.
| # | Parameter | Type | Default | Category |
|---|---|---|---|---|
| 1 | Pivot Point Period | int | 2 | Indicator Logic |
| 2 | ATR Factor | double | 3.0 | Indicator Logic |
| 3 | ATR Period | int | 10 | Indicator Logic |
| 4 | Show Pivot Points | bool | false | Visibility |
| 5 | Show Buy/Sell Labels | bool | true | Visibility |
| 6 | Show PP Center Line | bool | false | Visibility |
| 7 | Show Support/Resistance | bool | false | Visibility |
| 8 | Alert on Buy Signal | bool | true | Alerts |
| 9 | Alert on Sell Signal | bool | true | Alerts |
| 10 | Alert on any Trend Change | bool | false | Alerts |
| 11 | Popup Alert | bool | true | Alerts |
| 12 | Email Alert | bool | false | Alerts |
| 13 | Push Alert | bool | false | Alerts |
| 14 | Play sound | bool | true | Alerts |
| 15 | Sound file | string | alert.wav | Alerts |
| 16 | Buy label color | color | clrLime | Visuals |
| 17 | Sell label color | color | clrRed | Visuals |
| 18 | Pivot High color | color | clrRed | Visuals |
| 19 | Pivot Low color | color | clrLime | Visuals |
| 20 | Label font size | int | 9 | Visuals |
| 21 | Label font | string | Arial Bold | Visuals |
| 22 | Chart object prefix | string | PPSST_ | Visuals |
Trading Strategies
The following three approaches demonstrate different ways to use the Pivot Point Shift Supertrend Indicator. All strategies assume default settings unless stated otherwise.
WARNING: Trading involves significant risk of loss. These strategies are provided for educational purposes only. Always test on a demo account first and never trade with money you cannot afford to lose.
Strategy A: Pure Trend Following (H1 -- H4)
Goal: Enter on every trend flip and ride to the next flip. Simplest possible use of the indicator.
Setup:
- Use defaults: Pivot Period = 2 , ATR Factor = 3.0 , ATR Period = 10
- Enable Show Buy/Sell Labels (default)
- Configure alerts for Buy and Sell signals
Trade management:
- When a Buy label appears, open a long position at the open of the next bar
- Place stop loss at the trailing supertrend line
- Hold until a Sell signal appears (the line flips to red)
- Close the long and optionally open a short on the same Sell signal
- Repeat in the opposite direction
This is a "stop-and-reverse" approach. You are always in the market, alternating between long and short positions on each flip. It captures the entire trend phase between flips at the cost of taking signals that immediately reverse in choppy markets.
Strategy B: Trend + Pullback (M30 -- H1)
Goal: Use the trend signal as a directional bias and enter on pullbacks toward the trailing supertrend line.
Setup:
- Use defaults
- Enable Show Support/Resistance to see pivot levels
Trade management:
- Wait for a Buy or Sell signal to establish the trend direction
- Do NOT enter immediately on the signal
- Wait for price to retrace toward the trailing supertrend line (the new dynamic support/resistance)
- Enter on the first bar that confirms the trend is holding (e.g., a bullish bar that closes above the line in an up trend)
- Place stop loss just beyond the line on the wrong side
- Take profit at a fixed risk-reward ratio (e.g., 2:1) or hold until the next trend flip
This approach trades inside the trend rather than at the moment of the flip. It accepts a smaller portion of each trend leg in exchange for tighter stops and a higher win rate.
Strategy C: Multi-Timeframe Confirmation (H1 + H4)
Goal: Take only signals where both timeframes agree on direction.
Setup:
- Apply the indicator to both H1 and H4 charts
- Enable push notifications on both
- Use defaults
Trade management:
- When you receive a Buy alert on H1, check the H4 chart
- If H4 is also in an up trend (lime line), take the H1 Buy signal
- If H4 is in a down trend, ignore the H1 Buy signal
- Apply the same logic in reverse for Sell signals
- Use the H1 trailing line as a stop loss; use the H4 trailing line as a final exit if you want to ride the trend longer
Multi-timeframe confluence reduces the signal count but improves the quality of the signals taken. It is particularly effective at filtering out the false flips that can occur on H1 during sideways H4 markets.
TIP: For Strategy C, consider only taking signals where the H4 supertrend has been in its current direction for at least 3 bars. This avoids taking H1 signals immediately after an H4 flip, when the H4 trend is least confirmed.
Parameter Tuning Presets
The following preset tables provide starting points for different trading styles. Adjust based on your symbol, broker conditions, and personal preference.
Scalping Preset (M5 -- M15)
| Parameter | Scalping Value |
|---|---|
| Pivot Point Period | 2 |
| ATR Factor | 2.0 |
| ATR Period | 7 |
| Alert on any Trend Change | true |
Tighter bands on a shorter ATR period produce frequent flips suitable for scalping. Enable the catch-all Trend Changed alert to catch every flip in real time.
Swing Trading Preset (H1 -- H4)
| Parameter | Swing Value |
|---|---|
| Pivot Point Period | 2 |
| ATR Factor | 3.0 |
| ATR Period | 10 |
| Alert on Buy Signal | true |
| Alert on Sell Signal | true |
Default values across the board. The original Pine Script settings, validated for swing-style trading on the most popular timeframes.
Position / Conservative Preset (H4 -- D1)
| Parameter | Conservative Value |
|---|---|
| Pivot Point Period | 5 |
| ATR Factor | 4.5 |
| ATR Period | 14 |
Wider bands and more selective pivots produce far fewer flips, each carrying more weight. Suitable for position traders who hold for days or weeks per trade.
TIP: Start with the Swing Trading preset and modify one parameter at a time to observe its effect on flip frequency. Avoid making multiple changes at once -- you will not know which change caused the difference.
Troubleshooting
No Trailing Line Appearing
Possible causes and fixes:
- Warmup period not reached. The indicator needs at least 2 * Pivot Period + ATR Period + 5 bars of history before any output. With defaults, that is 2*2 + 10 + 5 = 19 bars. Scroll back in history or wait for more bars to form.
- Chart history is too short. Right-click the chart, select Properties, and check that Max bars in chart is set to a reasonable value (e.g., 5000+).
- Chart timeframe too low. On extremely low timeframes (M1, S5) with insufficient history, pivots may not have formed yet.
No Buy/Sell Labels
- Verify Show Buy/Sell Labels = true
- Check that the Label Font Size is not set to a value that makes labels invisible
- Verify the Buy Label Color and Sell Label Color are not the same as the chart background
- The first signal can only appear after the first trend flip, which requires the trend to first be established (typically a few pivots into the chart history)
Trend Line Repaints
The indicator does NOT repaint by design. If you observe what appears to be repainting:
- Confirm that you are looking at the trailing line on a CLOSED bar (shift >= 1), not the forming bar (shift 0). The forming bar is intentionally cleared.
- Note that the line's COLOR can change from lime to red (or vice versa) ONLY at the moment of a trend flip, on the flip bar itself. This is not repainting -- it is the documented signal mechanism.
- The pivot detection lag of Pivot Period bars is intentional. New pivots appear Pivot Period bars after their actual location, but they never disappear once detected.
Alerts Not Firing
- Check that at least one of Alert on Buy Signal , Alert on Sell Signal , or Alert on any Trend Change is enabled
- For push notifications: verify your MetaQuotes ID is configured in Tools > Options > Notifications and that Push Alert = true
- For email alerts: verify SMTP settings in Tools > Options > Email and that Email Alert = true
- Alerts fire only on the most recent newly-closed bar (one alert per signal per bar). If you missed it, you will not receive a duplicate.
Different Results Between MT4 and MT5
The MT4 and MT5 versions use identical signal logic. Minor differences may appear due to:
- Different ATR warm-up behavior between platforms (typically resolves after the first 50 bars)
- Different historical price data feeds between brokers
- Different first-tick timing on chart load
These differences diminish as more historical bars are processed and have no effect on signals generated in real-time after the indicator has fully warmed up.
Center Line or S/R Markers Not Showing
- Verify the corresponding toggle is enabled ( Show PP Center Line or Show Support/Resistance )
- The first center line value appears only after the first pivot is detected (typically a few bars into the chart)
- S/R markers appear at the actual pivot bar (offset back by Pivot Period from the confirmation bar) -- they may visually be a few bars to the left of where you expect
Download the indicator:
- MetaTrader 5: Pivot Point Shift Supertrend MT5
- MetaTrader 4: Pivot Point Shift Supertrend MT4
CONTACT & SUPPORT
- Email: info@forexobroker.com
- Questions: Use the Comments section on the product page or send a private message
- Bug Reports: Please include your broker name, account type, and a screenshot
-
✅ All MQL Tools: https://www.mql5.com/en/users/forexobroker/ ✅
--------------------------------------------------------------------------------------------------------------
🏦 **Broker I use**: https://icmarkets.com/?camp=55869
🏦 **Broker For EU Traders I use 1**: https://www.ictrading.com?camp=91414
🏦 **Broker I use 2**: https://one.exnessonelink.com/boarding/sign-up/a/c_thuv62ocfq
💻 **VPS**: https://chocoping.com/processing/aff.php?aff=738
💼 **Companies I use for getting funded**:
Fundednext: https://fundednext.com/?fpr=kestutis39
The5ers: https://www.the5ers.com/?afmc=16kl
FTMO: https://trader.ftmo.com/?affiliates=nRAyOhmFRnEnFdOpdLeh
Risk Disclaimer
Trading foreign exchange and CFDs on margin carries a high level of risk and may not be suitable for all investors. You may sustain a loss exceeding your initial investment. Trend Quorum is a technical analysis tool and does not guarantee profitable trades. Past performance is not indicative of future results. The authors accept no liability for any loss arising from use of the indicator. By using Trend Quorum you acknowledge sole responsibility for your trading decisions.


")
![[XAUUSD]: Weekly Liquidity Activation Points (timings), June 22-26, 2026](https://c.mql5.com/6/1013/splash-preview-771790.png "[XAUUSD]: Weekly Liquidity Activation Points (timings), June 22-26, 2026")
")