
Pivot Point Shift Supertrend Indicator: Pivot-Anchored Trailing Supertrend with ATR Bands and Non-Repainting Trend Flip

Introduction
Classic SuperTrend indicators anchor their bands to the midpoint between the current high and low ( hl2 ). This produces a continuously moving reference that hugs price closely but reacts to every wick. Wicks in choppy markets cause the bands to flip back and forth, generating noise that traders learn to ignore -- but ignoring noise is the same as ignoring signal, and over time it erodes the discipline that makes trend-following work.
The Pivot Point Shift Supertrend Indicator replaces the moving hl2 anchor with a structural anchor: the most recent confirmed pivot high or pivot low, smoothed over time with a weighted update rule. The resulting reference line moves only when market structure actually shifts. Bands placed around this anchor at a multiple of the Average True Range produce a trailing stop that holds its position through normal volatility and only flips when price decisively breaks out of the structural envelope.
This article explains the technical concepts behind pivot-anchored supertrend logic, walks through every component of the indicator, and provides a complete parameter reference so traders can configure it for their own markets and timeframes. The indicator is available for both MetaTrader 4 and MetaTrader 5 with 100% identical visual and signal logic between the two builds.
Download the indicator:
- MetaTrader 5: Pivot Point Shift Supertrend MT5
- MetaTrader 4: Pivot Point Shift Supertrend MT4
Why Anchor a SuperTrend to Pivot Points
Standard SuperTrend takes the average of high and low, then offsets above and below by Factor x ATR . The center moves on every bar because hl2 moves on every bar. This is mechanically convenient but structurally meaningless -- the center is not tied to where buyers and sellers fought, only to where price happens to be sitting at this instant.
Pivot points are different. A pivot high is a bar whose high is greater than the highs of prd bars on each side. A pivot low is its mirror. Pivots mark moments where price tested a level, failed to push through, and reversed. They are the structural skeleton of a chart, and every meaningful support or resistance level a chartist draws by hand passes through one or more of them.
By anchoring a supertrend to the most recent pivot, the bands stop reacting to every candle and start reacting only when the market produces a new structural data point. This single change has three consequences that propagate through the entire signal chain:
- Fewer flips. The center moves only when a new pivot is confirmed, so the bands shift in discrete steps rather than continuously. Trend direction holds longer.
- More meaningful flips. When the trend does flip, it flips because price broke through a band that was anchored to a known structural level, not to an arbitrary moving average of the last bar.
- Slower bands at the start of a new pivot, faster bands later. The weighted update rule -- explained in the next section -- gives newer pivots progressively more weight, which means the anchor adapts to changing market structure without abandoning history entirely.
The trade-off is a small amount of confirmation lag. A pivot at bar N cannot be confirmed until bar N + prd , because the indicator must wait for prd bars on the right side to verify that the candidate is actually the highest (or lowest) point. With the default prd = 2 , this lag is two bars -- short enough to be irrelevant on most timeframes, and short enough that the trailing supertrend remains responsive to new structure as it forms.
The Weighted Center Line
When a new pivot is confirmed, the indicator updates its center line using a weighted formula:
new_center = (old_center * 2 + new_pivot) / 3
The first time a pivot ever appears, the center is initialized to the pivot's value directly. From that point on, every new pivot contributes one-third of its weight to the new center, while the existing center contributes two-thirds. This means the center never jumps abruptly to the latest pivot -- it leans toward the existing structural picture and only gradually incorporates the new evidence.
This weighted update is the second meaningful difference from classic SuperTrend. A pure pivot anchor would jerk the bands sideways every time a new pivot appears, defeating the whole purpose of using structure as a stable reference. The 2:1 weighting smooths the transition and produces a center that traces the long-run structural midpoint of the chart.
When Show PP Center Line is enabled, this center line is drawn directly on the chart with a directional color: blue when the center is below the bar's hl2 (price is above the structural midpoint), red when the center is above hl2 (price is below the midpoint). Watching the color flip is itself a useful piece of information -- it tells you which side of structure you are on without needing to consult the trend line.
ATR Bands and the Trailing Rule
With the center line in place, the indicator constructs upper and lower bands using the Average True Range:
Up = center - (ATR_Factor x ATR)
Dn = center + (ATR_Factor x ATR)
The default ATR_Factor is 3.0 with an ATR_Period of 10 bars. These defaults match the original Pine Script and produce bands that are wide enough to ride out normal pullbacks but tight enough to flip when price commits to a new direction. Higher ATR_Factor values produce wider bands and fewer flips; lower values produce tighter bands and more flips.
The trailing rule is what turns these bands into a directional supertrend. On every closed bar, the indicator evaluates two states:
- Trailing Up: if the previous bar's close was above the previous Trailing Up, the new Trailing Up is the maximum of the current Up and the previous Trailing Up. Otherwise the new Trailing Up is simply the current Up .
- Trailing Down: if the previous bar's close was below the previous Trailing Down, the new Trailing Down is the minimum of the current Dn and the previous Trailing Down. Otherwise the new Trailing Down is simply the current Dn .
In plain language: when price is above the lower band, the band can only rise; when price falls below it, the band resets to the current Up value. The mirror logic applies to Trailing Down. This is the essence of a trailing stop -- it tightens with the trend but never gives back ground.
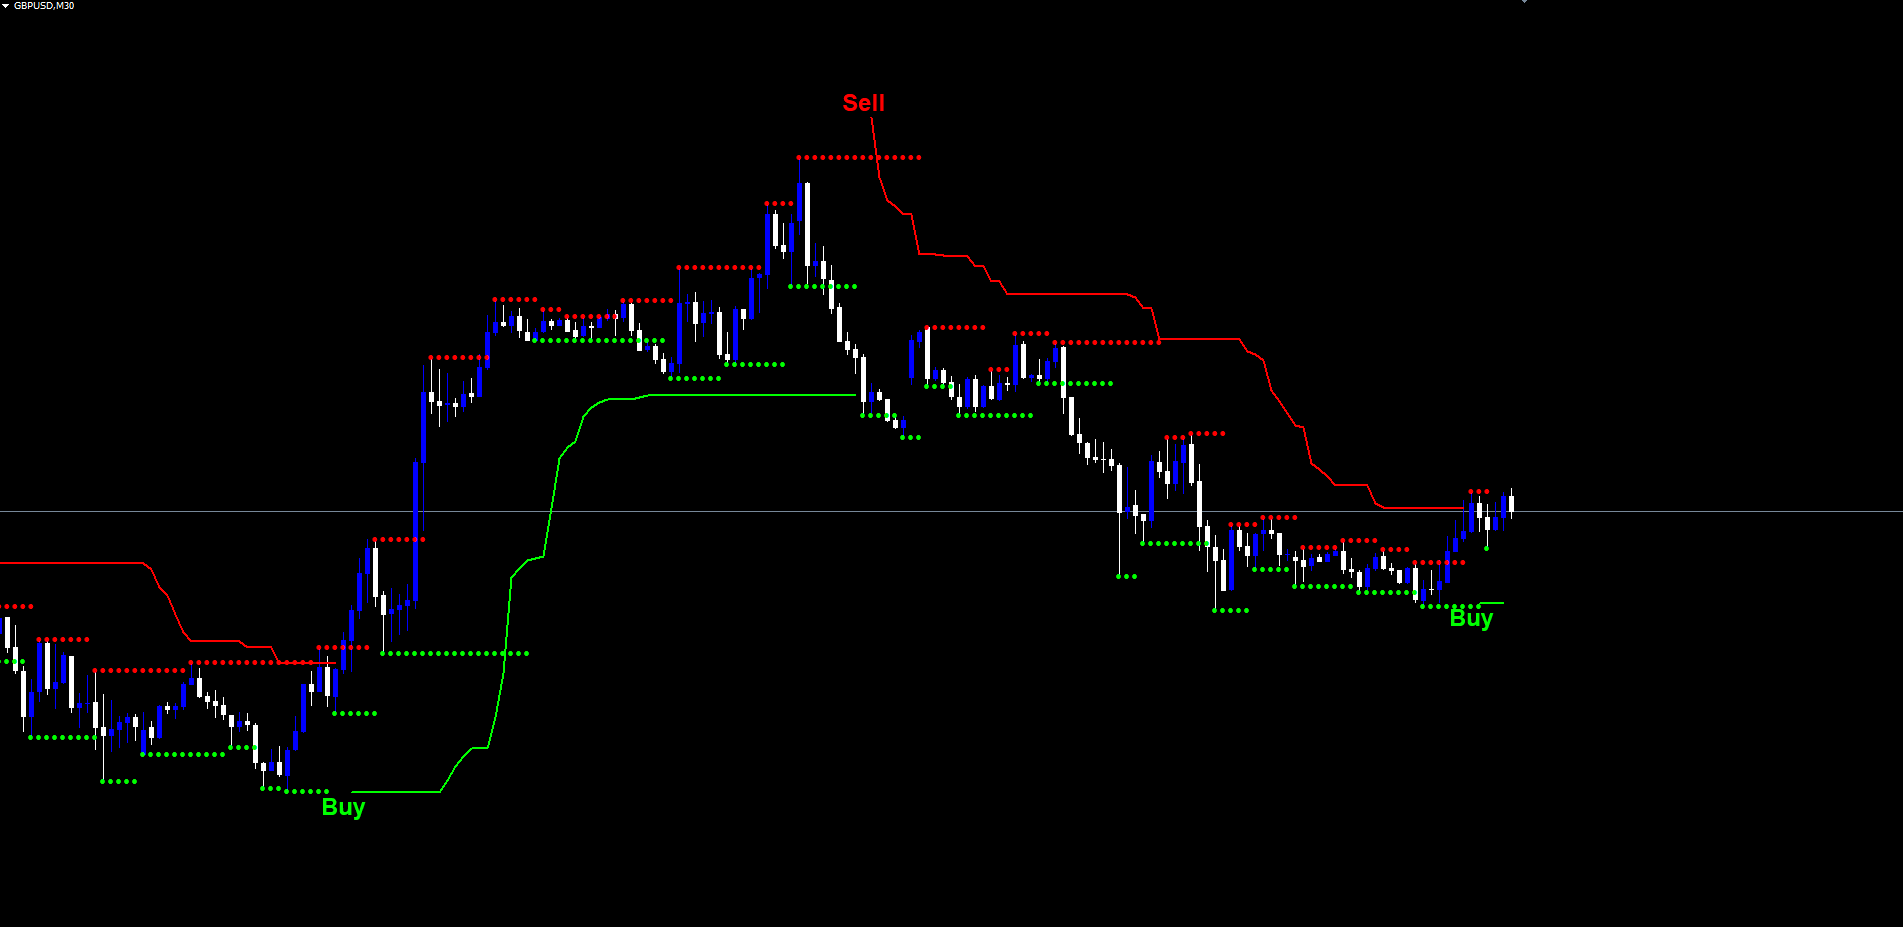
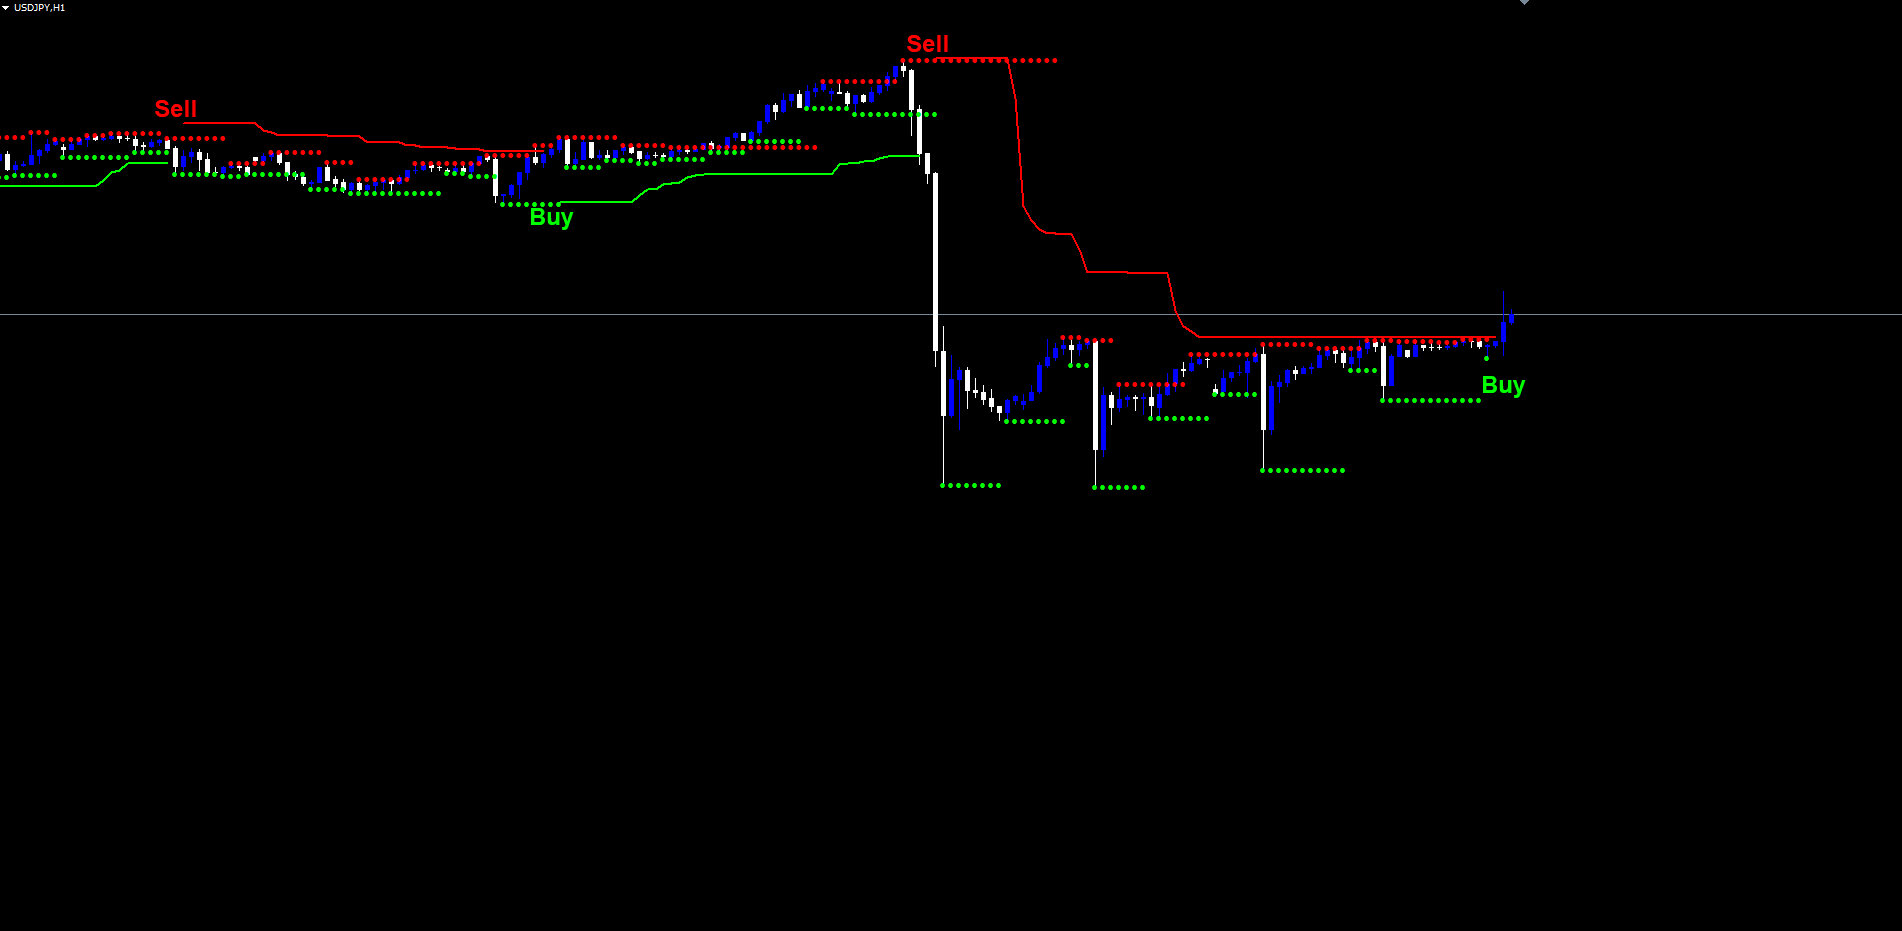
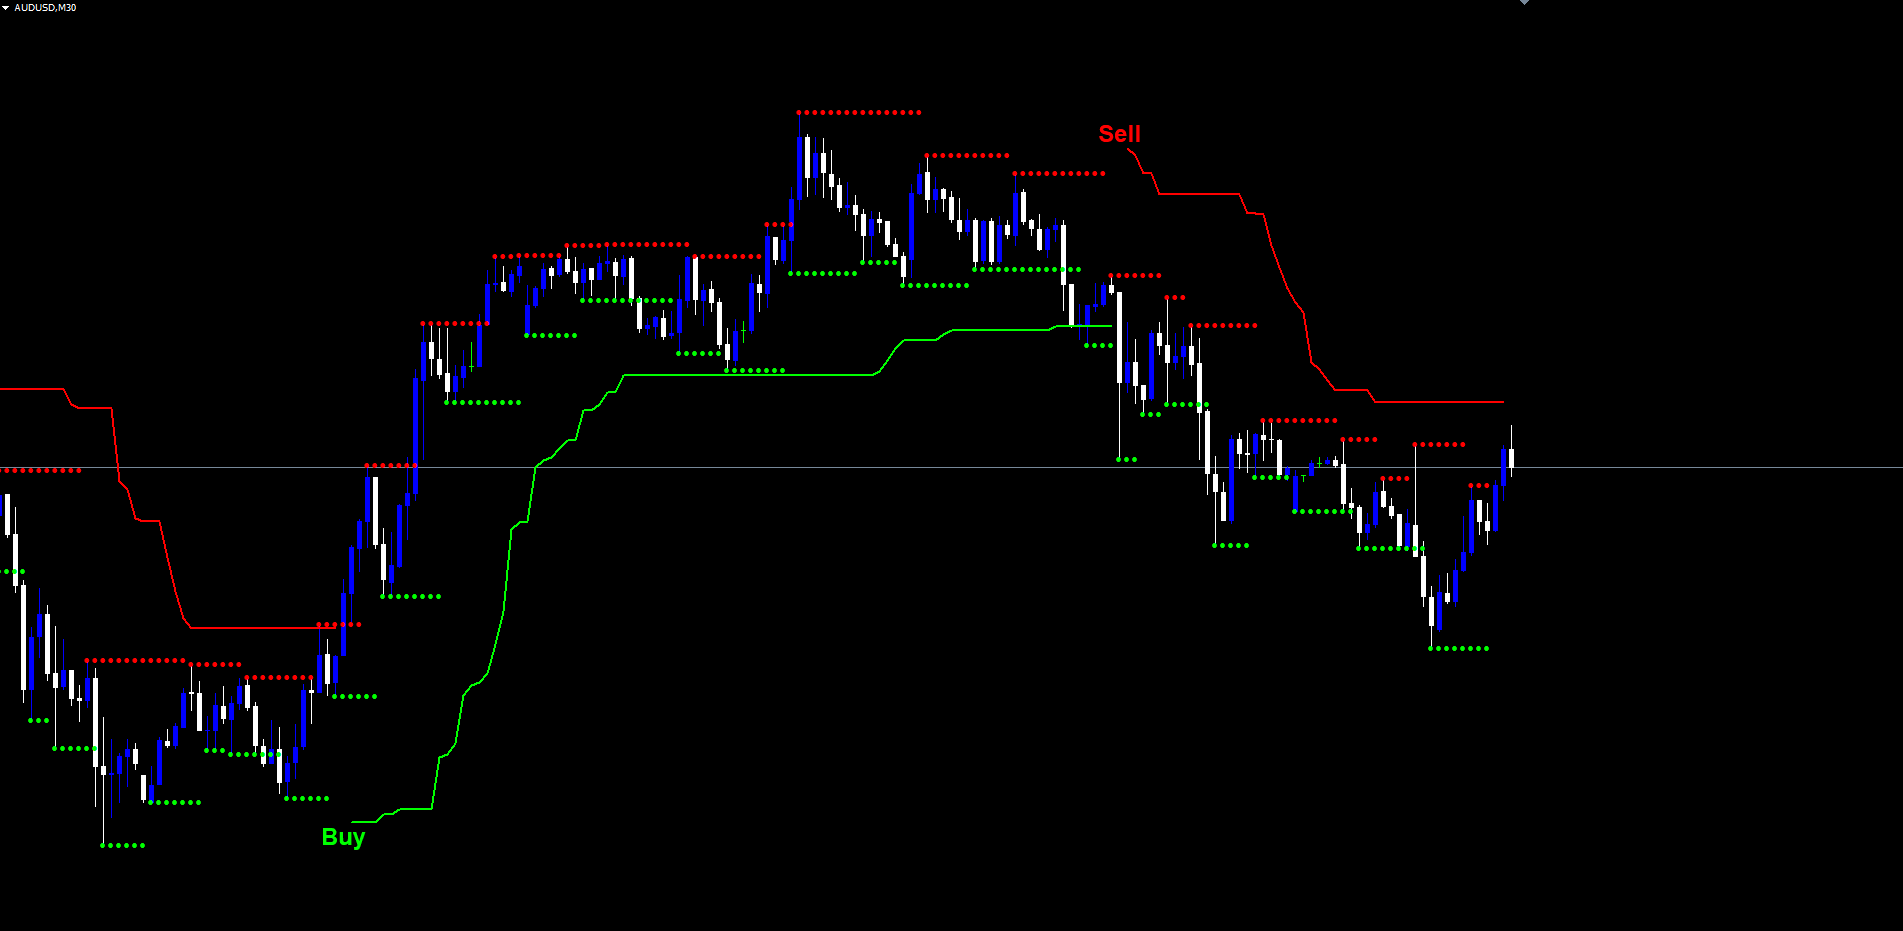
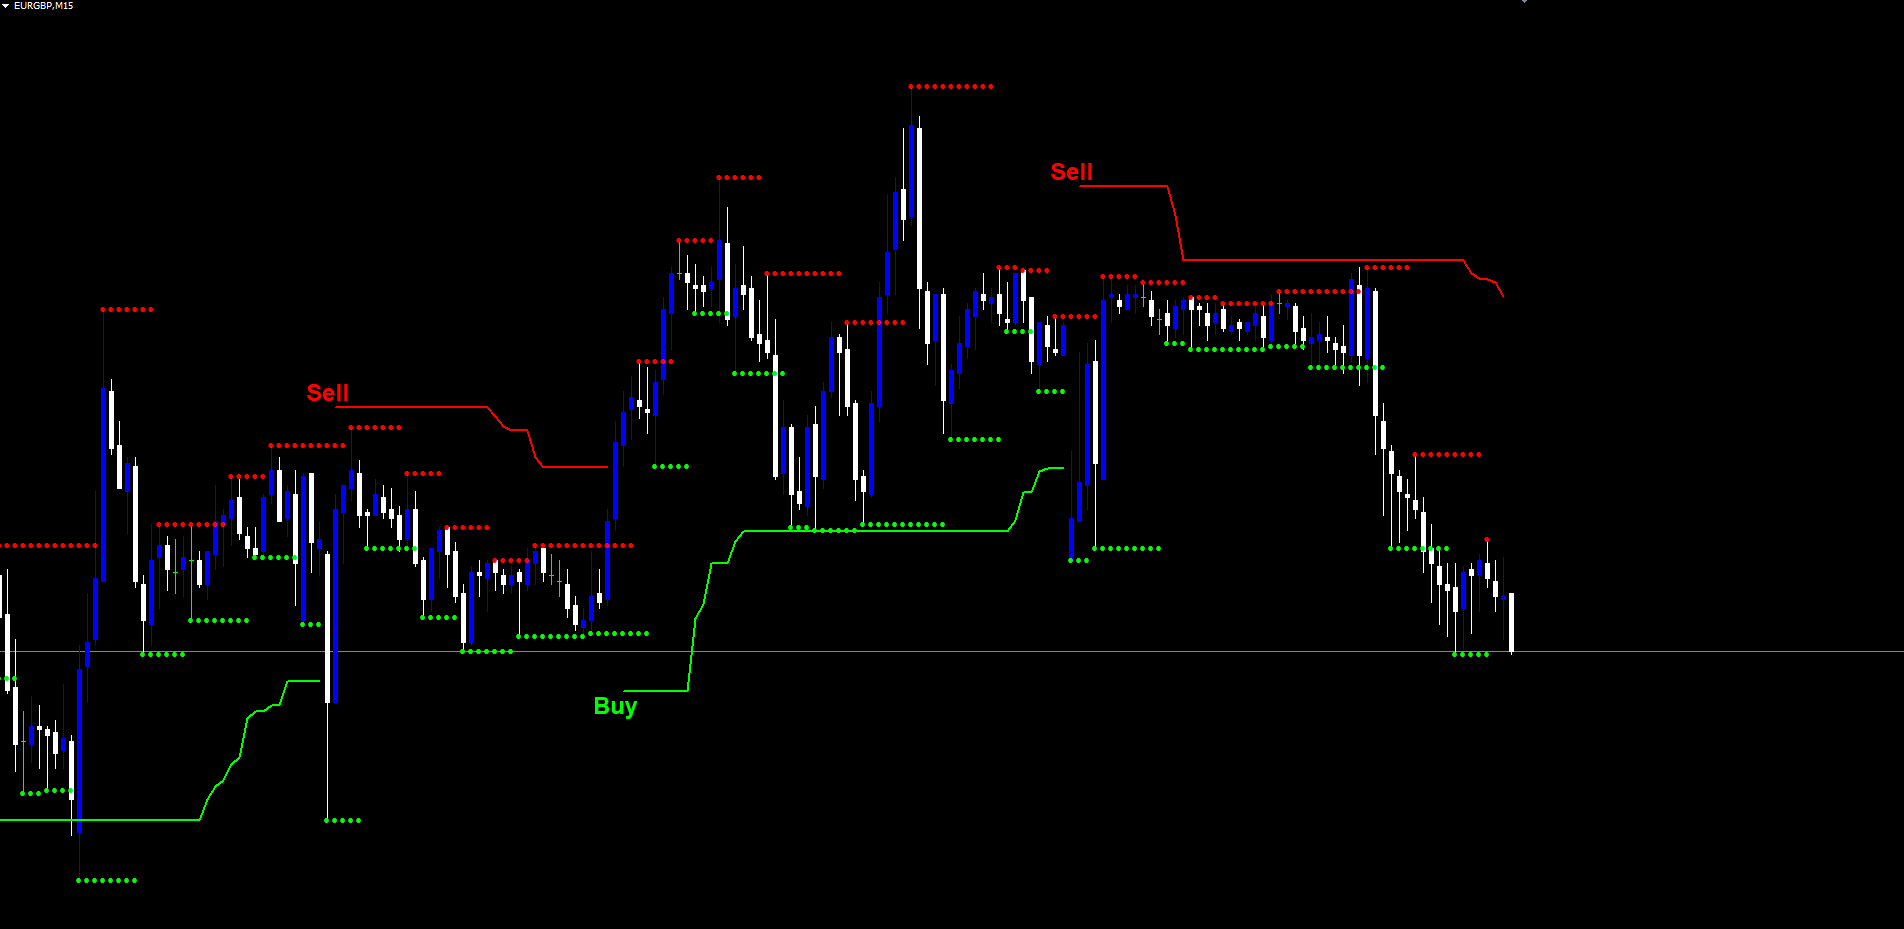
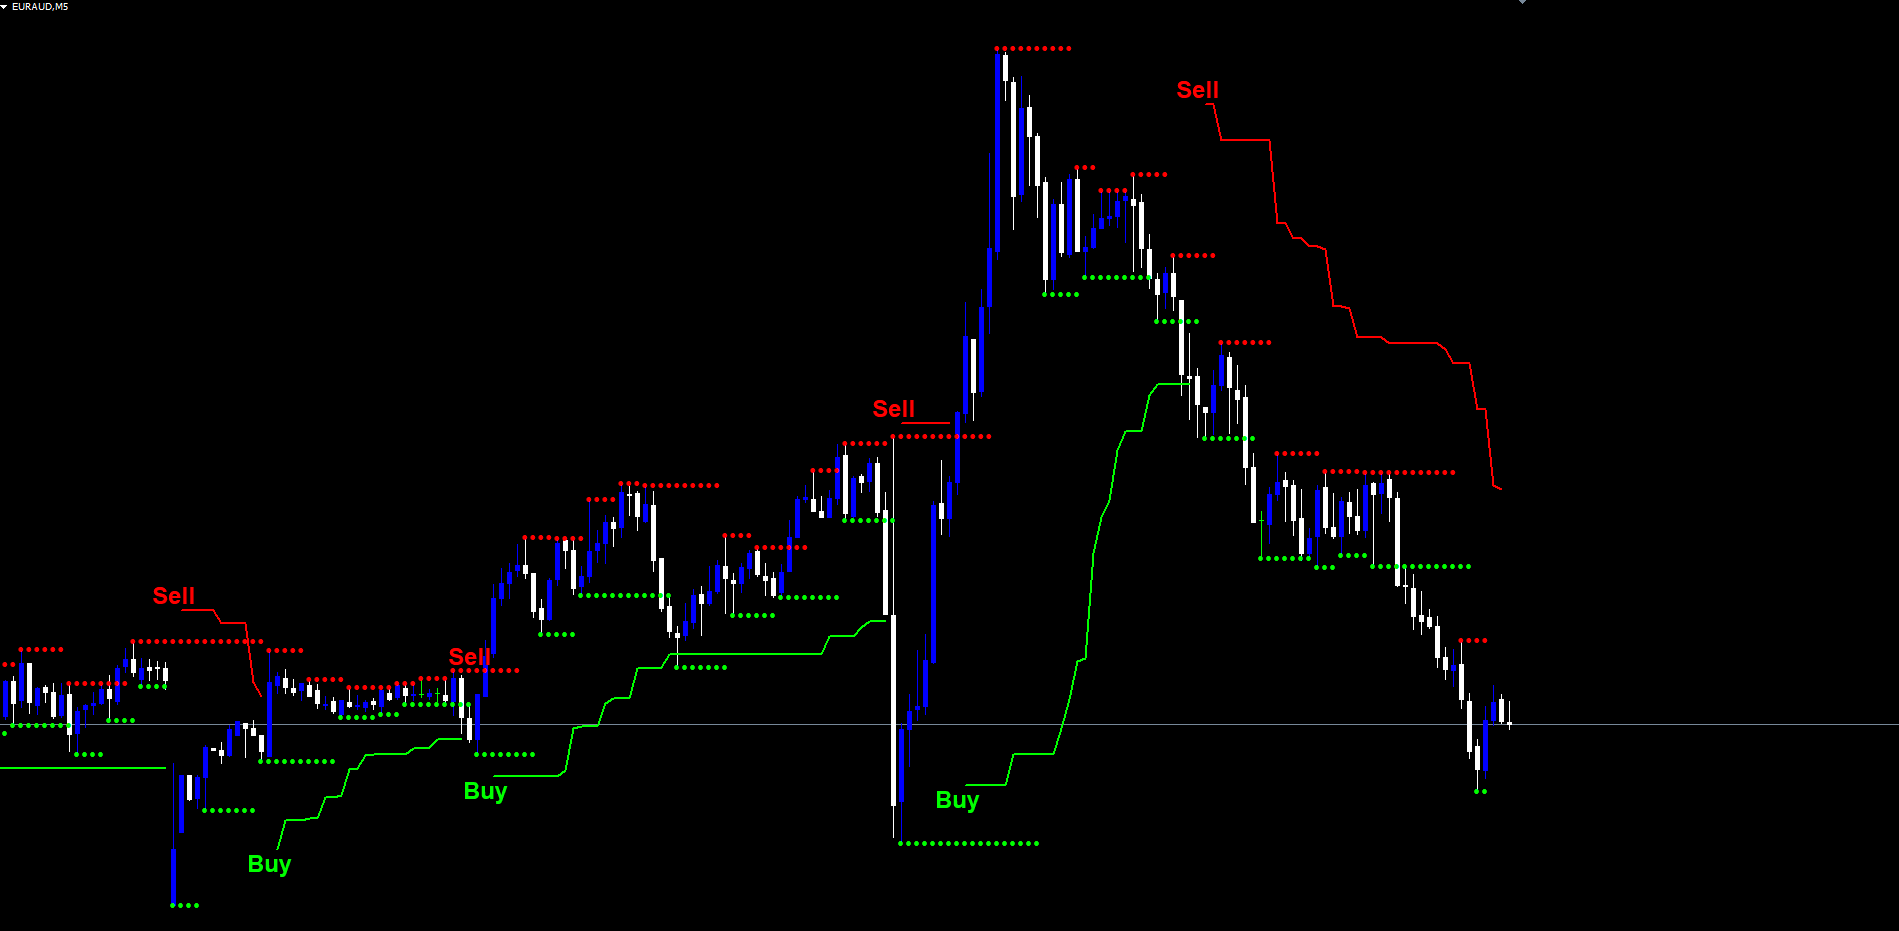
The current trend is determined by which band price has most recently broken:
- If the current close is above the previous Trailing Down, trend is +1 (up trend, line is the lower band, drawn in lime).
- If the current close is below the previous Trailing Up, trend is -1 (down trend, line is the upper band, drawn in red).
- Otherwise, the trend remains as it was on the previous bar.
The line displayed on the chart is Trailing Up when trend is +1 and Trailing Down when trend is -1 . Color changes only at the moment of a flip, and the bar of the flip itself is drawn as a one-bar gap to make the transition visually obvious.
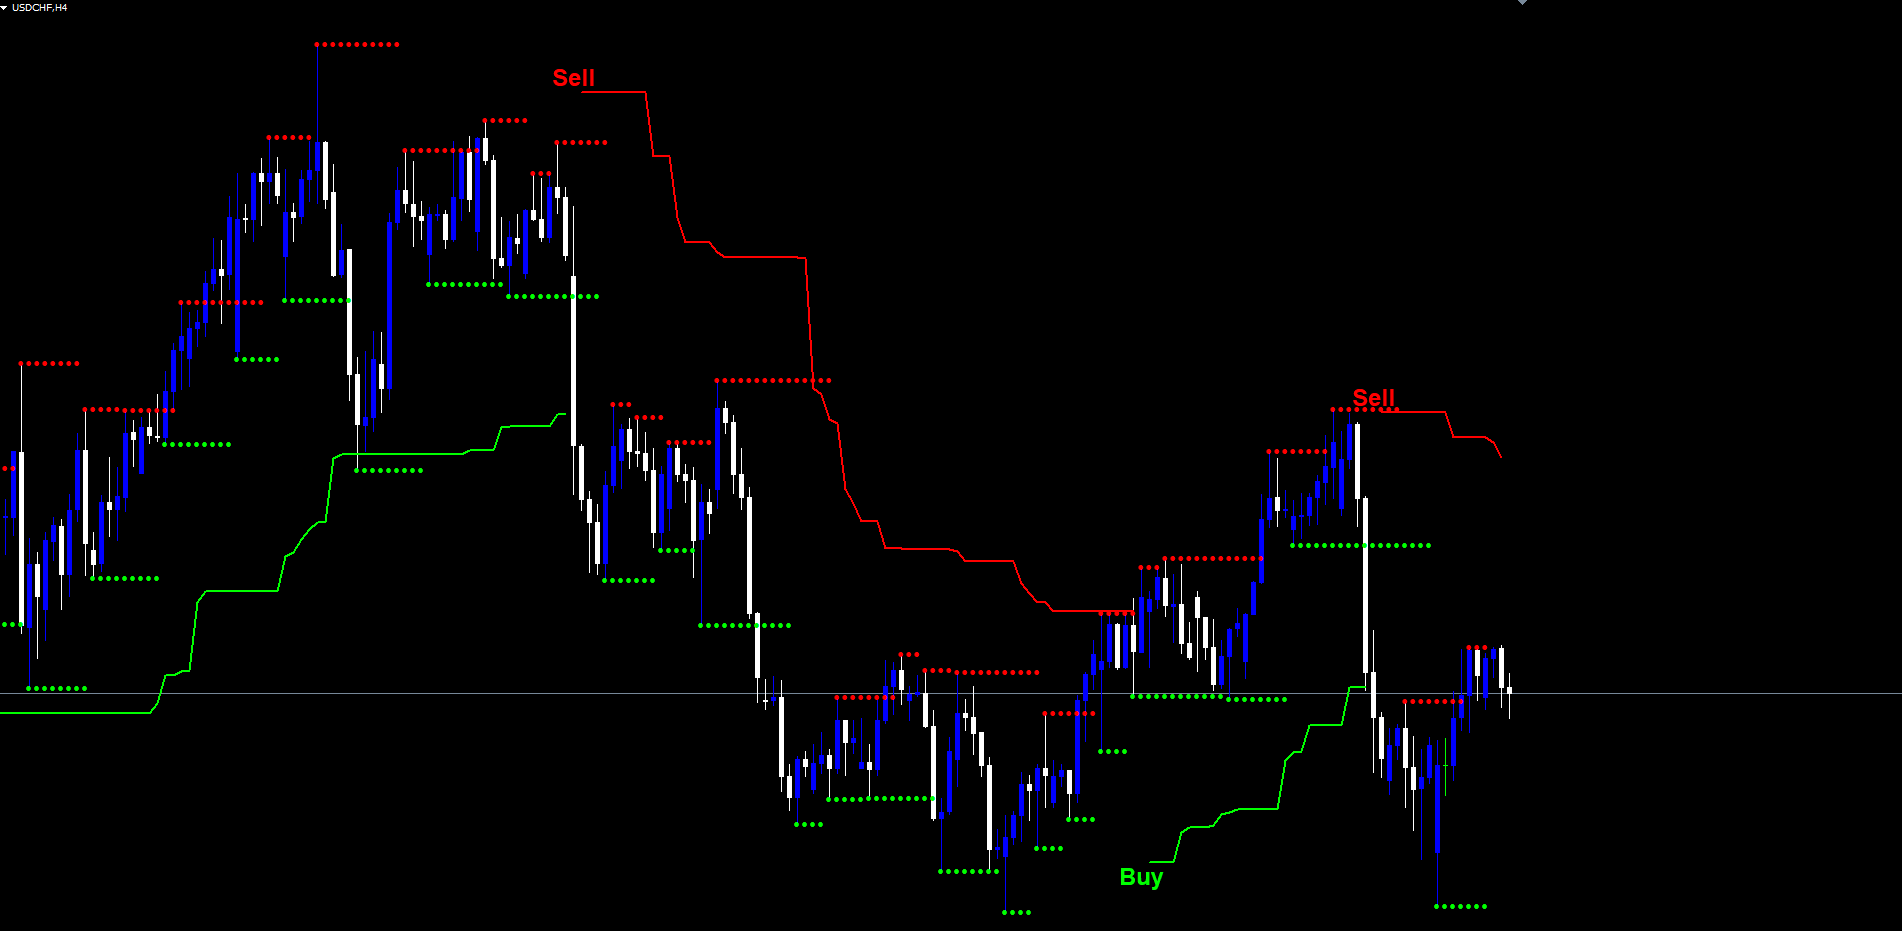
Buy and Sell Signals
The trend flip is the signal. When the trend value changes from -1 to +1 , a Buy label is printed at the trailing supertrend line. When it changes from +1 to -1 , a Sell label is printed. These are the only two signal events the indicator generates, and they are deliberately simple: they correspond to the moment the trailing stop was crossed, with no additional filters layered on top.
This minimalism is intentional. The ATR-multiplied band already incorporates volatility, the pivot anchor already incorporates structure, and the weighted center already incorporates time decay of older pivots. Adding RSI gates, EMA filters, or volume confirmations would create a more complex indicator but not necessarily a better one -- the structural and volatility filtering is already happening inside the supertrend calculation.
The Buy and Sell labels are sized larger than other on-chart text by default (font size doubled relative to the pivot H/L labels) so they are immediately visible on a busy chart. The label colors are configurable via Buy Label Color and Sell Label Color inputs. The default lime and red follow the convention established by the original Pine Script.
Signal labels are anchored to the time of the bar on which they fired. They never move, never re-color, and never disappear -- once a label is on the chart, it stays there. This is a direct consequence of the non-repainting design described in the next section.
Non-Repainting Design
Repainting is when an indicator displays a value or signal that later changes or disappears as new data arrives. It is the most insidious source of false confidence in technical analysis: backtests look great because every "wrong" signal has been silently erased, and live trading looks confusing because the same signals do not appear in real time.
The Pivot Point Shift Supertrend Indicator is non-repainting by construction. Three rules enforce this:
Rule 1: Pivots are confirmed only after prd bars on the right side. A pivot high candidate at bar N cannot be confirmed until bar N + prd , because the algorithm must verify that no later bar within the lookback window produced a higher high. By the time the pivot is acted on, it is mathematically impossible for it to be revoked by future data.
Rule 2: All trend logic runs on closed bars only. The forming bar (shift 0 in MetaTrader's series indexing) is explicitly cleared on every tick. The supertrend value, trend state, and signal evaluation use only the values from bar 1 (the most recently closed bar) and earlier. The forming bar contributes nothing until it closes.
Rule 3: Signal events fire at most once per bar. The Buy and Sell labels are tied to the bar's time stamp, and the alert system uses a "last fired bar time + signal type" deduplication key. If a flip is detected on a closed bar, the label and alert fire exactly once, regardless of how many ticks arrive afterward.
The practical effect is that historical signals on the chart are exactly what would have been seen in real time. A Buy label printed on the H1 chart at 12:00 was placed there at 12:00, when the 12:00 bar closed -- not retroactively from data that arrived hours later. Backtests that scroll through historical bars produce signal counts and entry prices that match the live indicator bar-for-bar.
The cost of this guarantee is the prd -bar confirmation lag on pivots and the one-bar lag on signals (signals fire at the close of the flip bar, not during its formation). Both are small relative to typical holding periods on swing or position trades, and both are non-negotiable for any trader who values backtest integrity.
Support and Resistance Levels from Pivots
When Show Support/Resistance is enabled, the indicator draws two additional series on the chart: support (green circles) and resistance (red circles). Support is the running value of the most recent confirmed pivot low; resistance is the running value of the most recent confirmed pivot high. Each new pivot updates the corresponding running value, and the markers shift to the new level.
These are anchored to the actual pivot bar (not the confirmation bar), so the markers visually align with the price candle that produced the pivot. This matches the Pine Script's offset = -prd plot directive and gives an immediate visual reference for where the most recent pivot occurred.
Support and resistance markers serve two roles. First, they make pivot detection visible in real time -- when a new green circle appears, you know a new pivot low was just confirmed and the center line has updated. Second, the running levels give you horizontal reference points that can be used as additional context for the trailing supertrend's trend signal. A Buy that fires near a fresh support level is a different prospect from a Buy that fires in mid-air, far from any structural level.
The markers are drawn using DRAW_ARROW with arrowcode 159 (small filled circle) at width 1, so they appear as discrete dots rather than a continuous line. This avoids visual clutter on lower timeframes where pivots form frequently.
Pivot Markers and the Center Line on the Chart
Two further visual options are available for traders who want to see the underlying structural data directly:
Pivot H/L labels ( Show Pivot Points ). When enabled, every confirmed pivot is annotated with an H (above the bar) or L (below the bar) text label at the actual pivot bar position. The H labels use the configured Pivot High Color (default red) and the L labels use the Pivot Low Color (default lime). These labels are useful when first learning the indicator -- you can watch where pivots form and how they propagate into the center line update -- and can be turned off once you trust the underlying calculation.
Center line ( Show PP Center Line ). When enabled, the weighted center line is drawn as a dotted line, blue when below hl2 and red when above. The directional color makes the line easy to read against the price chart even when the supertrend bands are also visible. The center is what the bands are built around, so seeing it directly demystifies the indicator's behavior -- when the center is rising, the bands rise with it; when the center is flat, the bands hold steady.
Both options are off by default to keep the chart clean, with just the trailing supertrend line and signal labels visible. They are recommended for traders who are tuning the Pivot Point Period parameter and want to see exactly which pivots are being detected at different settings.
The Alert Package
The indicator ships with a complete alert package covering every meaningful event:
| Alert | Trigger |
|---|---|
| Buy Signal | Trend flips from -1 to +1 on a confirmed bar close |
| Sell Signal | Trend flips from +1 to -1 on a confirmed bar close |
| Trend Changed | Either a Buy or Sell flip (catch-all for any trend transition) |
Each alert can be delivered through up to four channels independently:
| Channel | Default | Notes |
|---|---|---|
| Popup (on-screen dialog) | Enabled | Standard MetaTrader popup |
| Sound (alert.wav) | Enabled | Configurable file via Alert Sound File input |
| Push notification (mobile) | Disabled | Requires MetaQuotes ID configuration |
| Disabled | Requires MT SMTP configuration |
Each alert message includes the symbol and timeframe, formatted as EURUSD H1: PPSST Buy Signal . The alert fires at most once per bar per signal type, so even if the bar receives many ticks after the flip, the trader is not flooded with duplicate notifications.
The Trend Changed alert is independent of the Buy and Sell alerts. A trader who only wants notification on direction changes (and does not need to distinguish between Buy and Sell at the alert level) can enable just this one alert. A trader who wants to act differently on Buy vs. Sell signals can enable both Buy and Sell separately while keeping Trend Changed disabled.
For traders monitoring multiple charts or running the indicator on a watchlist, push notifications are the recommended primary channel. Configure your MetaQuotes ID in Tools > Options > Notifications , set Alert Push = true , and you will receive a mobile alert every time a flip occurs on any chart running the indicator.
Practical Trading Workflow
Understanding each component individually is one thing; using them together in daily trading is another. The following five-step workflow describes how to apply the Pivot Point Shift Supertrend Indicator for swing or trend-following trades.
Step 1: Add the indicator to a chart. Drag the indicator onto any chart from Navigator > Indicators > Market . The default settings (Pivot Period = 2, ATR Factor = 3.0, ATR Period = 10) work well across most instruments and timeframes. Start with a 1-hour or 4-hour chart to see clearly defined trend segments.
Step 2: Observe the trailing supertrend line. When the line is lime, the trend is up; when it is red, the trend is down. The line itself is the trailing stop -- it represents the level below (in an up trend) or above (in a down trend) which a trade in the trend's direction would be invalidated. Trades opened in alignment with the trend can use the line as a dynamic stop loss.
Step 3: Wait for a flip. A new Buy or Sell label appears at the bar of the trend flip. This is the signal that the supertrend has acknowledged a structural change. Do not anticipate the flip before the bar closes -- the indicator deliberately waits for confirmation, and the entry logic is built around the close price of the flip bar.
Step 4: Set alerts for trade management. If you cannot watch the chart continuously, enable push notifications or email alerts. The alert message includes the symbol and timeframe, so you can identify the chart from the notification alone. For multi-chart setups, enable push and disable popup so that desktop alerts do not interrupt other work.
Step 5: Use the line as a trailing stop. Once in a trade, the trailing supertrend line itself is your stop loss. If price closes back through the line, the trade is invalidated and the indicator will print a new signal in the opposite direction. This produces a position management framework with no manual intervention required between flip signals.
Some traders prefer to combine the supertrend signal with their own discretionary analysis -- for example, only taking Buys near a fresh support level (visible when Show Support/Resistance is enabled) or only taking Sells when a higher-timeframe chart is already in a down trend. The indicator's outputs are flexible enough to support either purely systematic use or as one input among several in a discretionary framework.
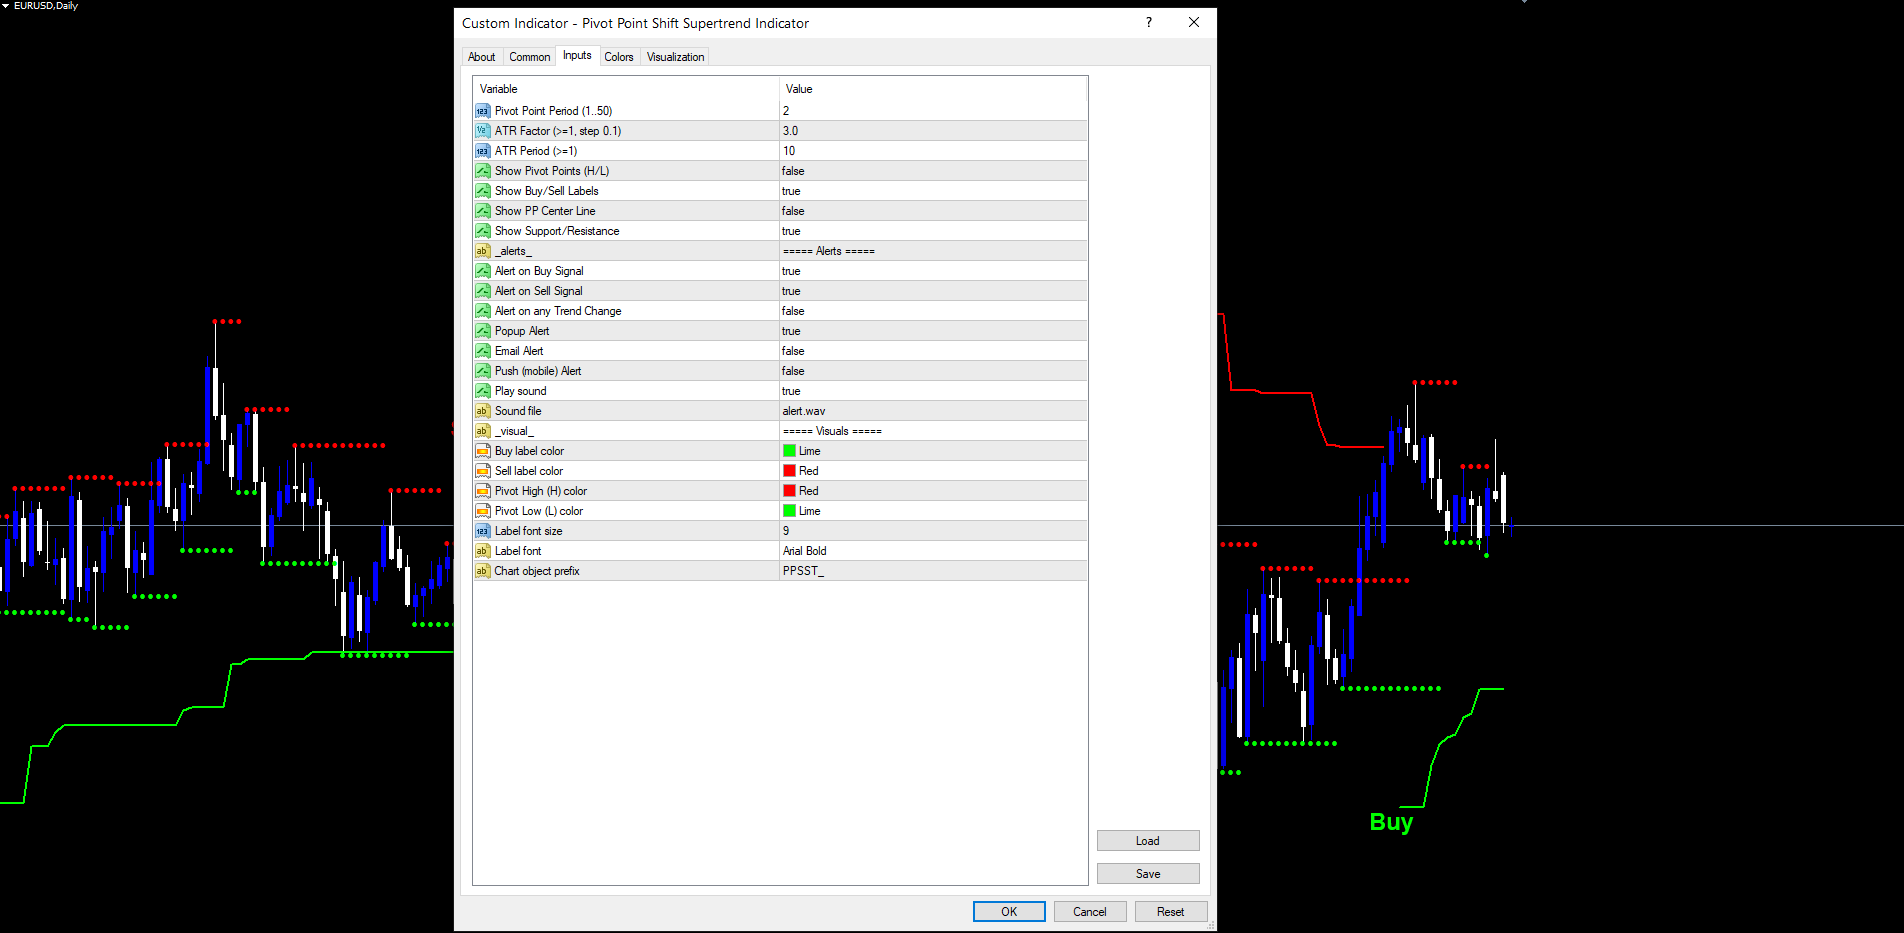
Parameter Reference
All inputs are listed below grouped by function. Default values match the Pine Script source exactly.
Indicator Logic
| Parameter | Default | Description |
|---|---|---|
| Pivot Point Period | 2 | Bars on each side required to confirm a pivot (1-50) |
| ATR Factor | 3.0 | Band distance as a multiple of ATR (>= 0.1) |
| ATR Period | 10 | Lookback for the Average True Range (>= 1) |
Visibility Toggles
| Parameter | Default | Description |
|---|---|---|
| Show Pivot Points | false | Print H/L labels at confirmed pivots |
| Show Buy/Sell Labels | true | Print text labels at trend flips |
| Show PP Center Line | false | Draw the weighted center line |
| Show Support/Resistance | false | Draw running pivot S/R as dot markers |
Alerts
| Parameter | Default | Description |
|---|---|---|
| Alert on Buy Signal | true | Fire alert on trend flip up |
| Alert on Sell Signal | true | Fire alert on trend flip down |
| Alert on any Trend Change | false | Catch-all for any flip event |
| Popup Alert | true | On-screen popup dialog |
| Email Alert | false | Send email via MT SMTP |
| Push Alert | false | Mobile push via MetaQuotes ID |
| Play sound | true | Play alert sound file |
| Sound file | alert.wav | Filename in Sounds folder |
Visuals
| Parameter | Default | Description |
|---|---|---|
| Buy label color | clrLime | Buy label text color |
| Sell label color | clrRed | Sell label text color |
| Pivot High color | clrRed | H label text color |
| Pivot Low color | clrLime | L label text color |
| Label font size | 9 | Base font size (Buy/Sell auto-doubled) |
| Label font | Arial Bold | Font face for all labels |
| Chart object prefix | PPSST_ | Prefix for indicator-created objects |
Recommended Configuration Profiles
Conservative (fewer signals, slower flips). Increase Pivot Point Period to 5 and ATR Factor to 4.0. This produces a wider, more stable supertrend that holds direction through deeper pullbacks. Best for daily and weekly charts where each flip should mark a meaningful structural shift.
Default (balanced). Use all default values: Pivot Period = 2, ATR Factor = 3.0, ATR Period = 10. Suitable for most Forex pairs on M30, H1, and H4. The original Pine Script defaults.
Aggressive (more signals, faster reaction). Reduce ATR Factor to 2.0 and keep Pivot Period at 2. This narrows the bands and produces more flips, useful for scalping or for traders who want to capture short-term swings. Best on M5 and M15 with active markets.
Installation
The Pivot Point Shift Supertrend Indicator is distributed through the MQL5.com Market and installs automatically after purchase.
- Purchase the indicator from the MQL5.com Market product page.
- The indicator downloads and installs automatically into MetaTrader.
- Open the Navigator panel (Ctrl+N) and expand the Indicators section.
- Find the indicator under Indicators > Market .
- Drag it onto any chart.
- Adjust input parameters if needed, then click OK.
The indicator works on all timeframes and all instruments supported by your broker. No manual file copying is required. Allow a brief moment on first attachment for the indicator to compute its historical pivot points and trend trail; subsequent ticks process incrementally with no noticeable delay.
The indicator uses 6 visible buffers (trailing line up segment, trailing line down segment, center line blue, center line red, support markers, resistance markers) plus 8 hidden state buffers. All chart objects use the configurable PPSST_ prefix and are automatically cleaned up when the indicator is removed from the chart.
Multi-Timeframe Considerations
The trailing supertrend behaves differently on different timeframes, and traders should understand the interaction between Pivot Period , ATR Period , and chart resolution before settling on a configuration.
Lower timeframes (M5, M15). Pivots form frequently, so the center line updates often and the bands shift more dynamically. Flips can occur multiple times per day, which suits scalping or short intraday trades. Reduce ATR Factor to 2.0 if you want even more flips, or increase to 4.0 to filter out the smallest moves.
Medium timeframes (M30, H1, H4). This is the indicator's sweet spot. Pivots are spaced enough that the center line is stable but updates regularly. Default settings produce well-spaced flips that align with multi-day swings. The 200-bar warmup is reached quickly and the bands have time to develop meaningful trailing distance before the next flip.
Higher timeframes (D1, W1). Pivots become rare and significant. Each flip carries weight and tends to mark the start of a multi-week trend phase. Consider increasing Pivot Period to 3 or 5 to require more confirmation on each side, and ATR Factor to 4.0 or 5.0 to widen the bands and reduce premature flips during deep retracements.
A multi-timeframe approach -- running the indicator on H1 and H4 simultaneously and only taking signals when both timeframes agree on the trend direction -- adds a layer of confluence beyond what any single chart can provide. The signals are independent on each chart, so when the higher timeframe is in an up trend and the lower timeframe flips to up, the alignment is meaningful.
MT4 vs MT5 Parity
The indicator is available in both MT4 ( Pivot Point Shift Supertrend Indicator.mq4 ) and MT5 ( Pivot Point Shift Supertrend Indicator.mq5 ) versions, with 100% identical signal and visual logic between the two. The same pivot detection algorithm, the same weighted center update, the same ATR band formula, and the same trailing rule run on both platforms.
The differences are platform-specific implementation details that have no effect on the indicator's outputs:
- MT4 uses iATR() directly with a shift parameter; MT5 uses a handle-based ATR with bulk CopyBuffer into a global array.
- MT4 creates chart objects in OnCalculate ; MT5 creates them in OnTimer (every 500 ms) per the platform's indicator object visibility rules.
- MT4 uses IndicatorBuffers(14) to expose hidden calculation buffers; MT5 uses INDICATOR_CALCULATIONS flag on the same buffer indices.
For traders running the indicator on both platforms, signals appear at the same bars with the same trailing line values. A backtest of the MT4 version will produce the same flip count and approximate entry prices as a backtest of the MT5 version on the same symbol and timeframe.
Conclusion
The Pivot Point Shift Supertrend Indicator replaces the moving hl2 anchor of classic SuperTrend with a structural anchor: confirmed pivot points, smoothed by a weighted update rule, surrounded by ATR-multiplied bands, and trailed using the standard SuperTrend rule. The result is a trend-following tool that responds to genuine structural shifts rather than to every wick.
The non-repainting design ensures that historical signals on the chart match what would have been seen in real time, making backtests honest and live trading predictable. The full alert package -- Buy, Sell, and Trend Changed -- delivered via popup, sound, push, or email keeps traders informed without requiring constant chart monitoring. Optional visualization layers (pivot labels, center line, support/resistance markers) make the indicator's internals transparent and tunable.
The indicator is designed for traders who want a structured, repeatable approach to trend-following on Forex, Crypto, Stocks, Commodities, and Indices. It performs well on the 30-minute, 1-hour, and 4-hour timeframes for swing entries, and adapts to higher or lower timeframes through Pivot Period and ATR Factor adjustments. The MT4 and MT5 versions ship with 100% logic and visual parity, so signals are reproducible across platforms.
Whether used as a standalone trend signal or as one input within a broader discretionary framework, the systematic approach to pivot anchoring and ATR trailing provides a clean foundation for disciplined, rule-based trading.
Download the indicator:
- MetaTrader 5: Pivot Point Shift Supertrend MT5
- MetaTrader 4: Pivot Point Shift Supertrend MT4
CONTACT & SUPPORT
- Email: info@forexobroker.com
- Questions: Use the Comments section on the product page or send a private message
- Bug Reports: Please include your broker name, account type, and a screenshot
-
✅ All MQL Tools: https://www.mql5.com/en/users/forexobroker/ ✅
--------------------------------------------------------------------------------------------------------------
🏦 **Broker I use**: https://icmarkets.com/?camp=55869
🏦 **Broker For EU Traders I use 1**: https://www.ictrading.com?camp=91414
🏦 **Broker I use 2**: https://one.exnessonelink.com/boarding/sign-up/a/c_thuv62ocfq
💻 **VPS**: https://chocoping.com/processing/aff.php?aff=738
💼 **Companies I use for getting funded**:
Fundednext: https://fundednext.com/?fpr=kestutis39
The5ers: https://www.the5ers.com/?afmc=16kl
FTMO: https://trader.ftmo.com/?affiliates=nRAyOhmFRnEnFdOpdLeh
Risk Disclaimer
Trading foreign exchange and CFDs on margin carries a high level of risk and may not be suitable for all investors. You may sustain a loss exceeding your initial investment. Trend Quorum is a technical analysis tool and does not guarantee profitable trades. Past performance is not indicative of future results. The authors accept no liability for any loss arising from use of the indicator. By using Trend Quorum you acknowledge sole responsibility for your trading decisions.


")
![[XAUUSD]: Weekly Liquidity Activation Points (timings), June 22-26, 2026](https://c.mql5.com/6/1013/splash-preview-771790.png "[XAUUSD]: Weekly Liquidity Activation Points (timings), June 22-26, 2026")
")