
Stealth Vein Indicator: Adaptive Dynamic-Length Moving Average with Nine Reset Modes for MT4 and MT5

Introduction
Moving averages are the most widely used tool in technical analysis, yet a fixed-length moving average rarely fits every market regime. A 50-period SMA may be perfectly tuned to a quiet ranging market, only to lag badly when the same instrument enters a strong trend. A 200-period SMA may track major institutional flows but miss multi-week swings on faster timeframes. Traders typically respond by switching between several MAs of different lengths, or by stacking several on the same chart. Both approaches add complexity without addressing the core problem: the appropriate length of a moving average is not constant.
The Stealth Vein Indicator solves this directly. Instead of asking the trader to choose between competing fixed-length MAs, it expands the length dynamically based on a nine-mode reset engine. When the underlying market state stays stable, the moving-average length grows bar by bar, producing a smoother and more deliberate line. When the state changes, the length resets to the base value and begins growing again. The result is a single moving average whose responsiveness adapts to current conditions automatically.
Download the indicator:
- MetaTrader 5: Stealth Vein MT5
- MetaTrader 4: Stealth Vein MT4
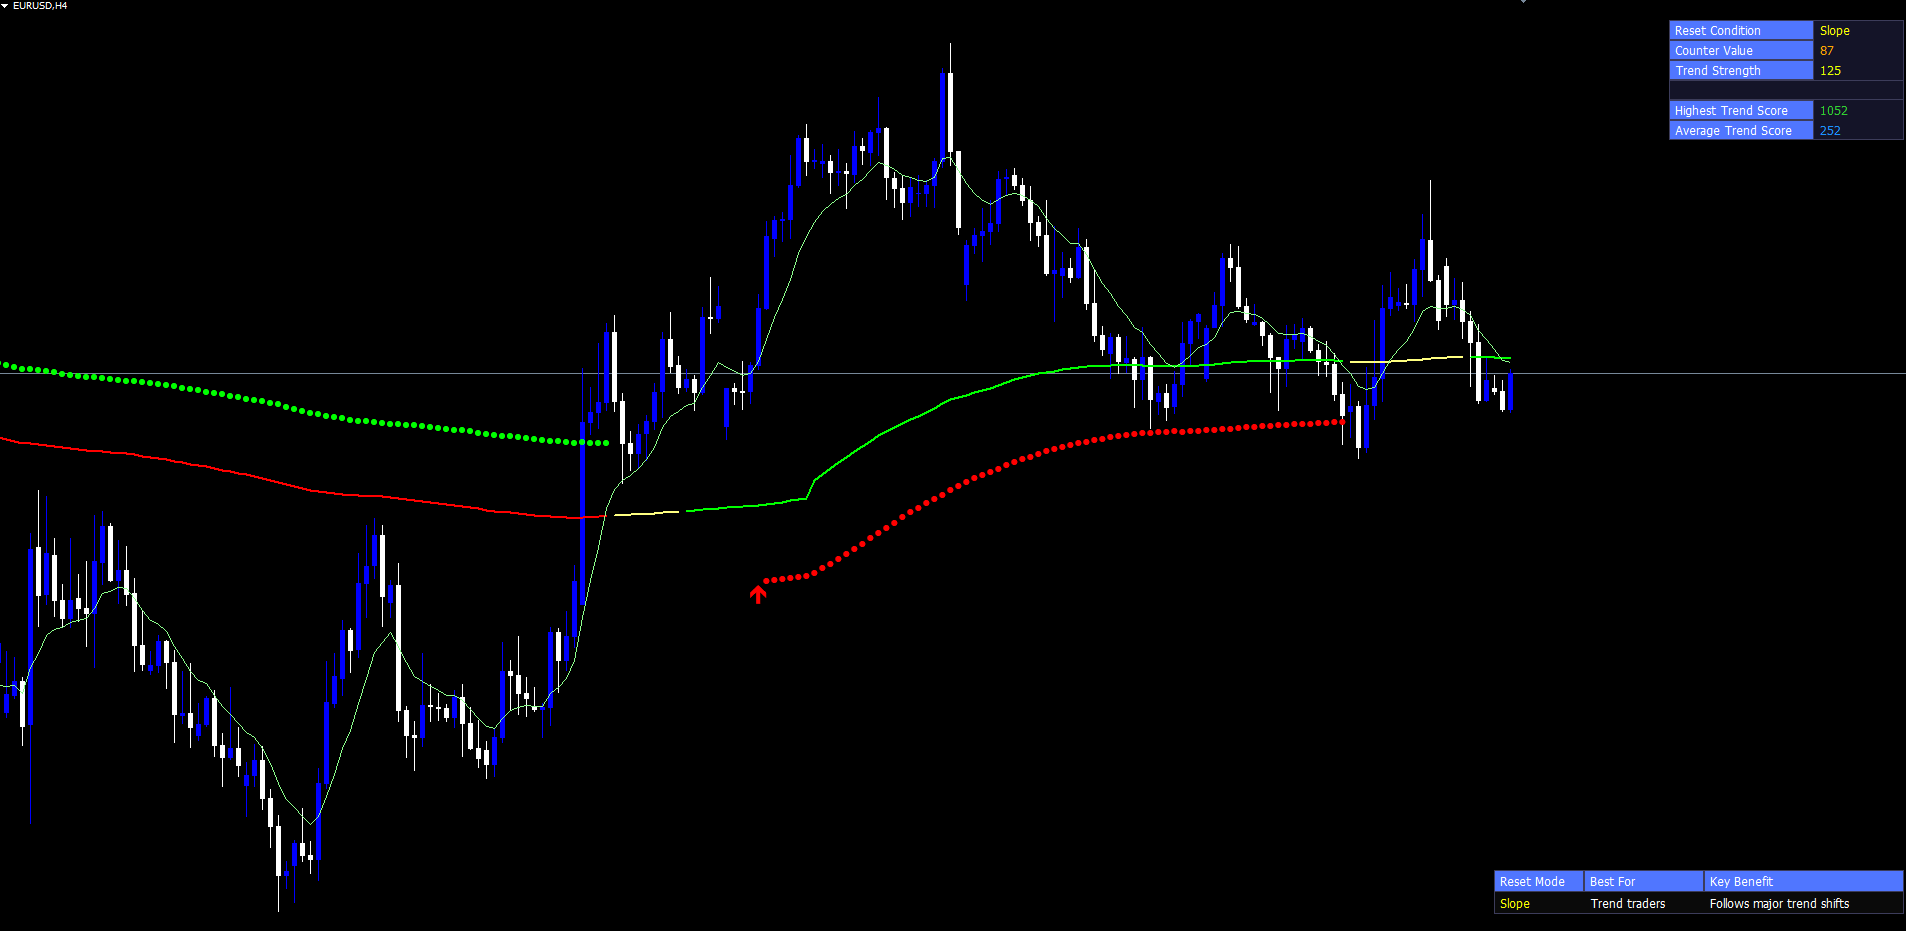
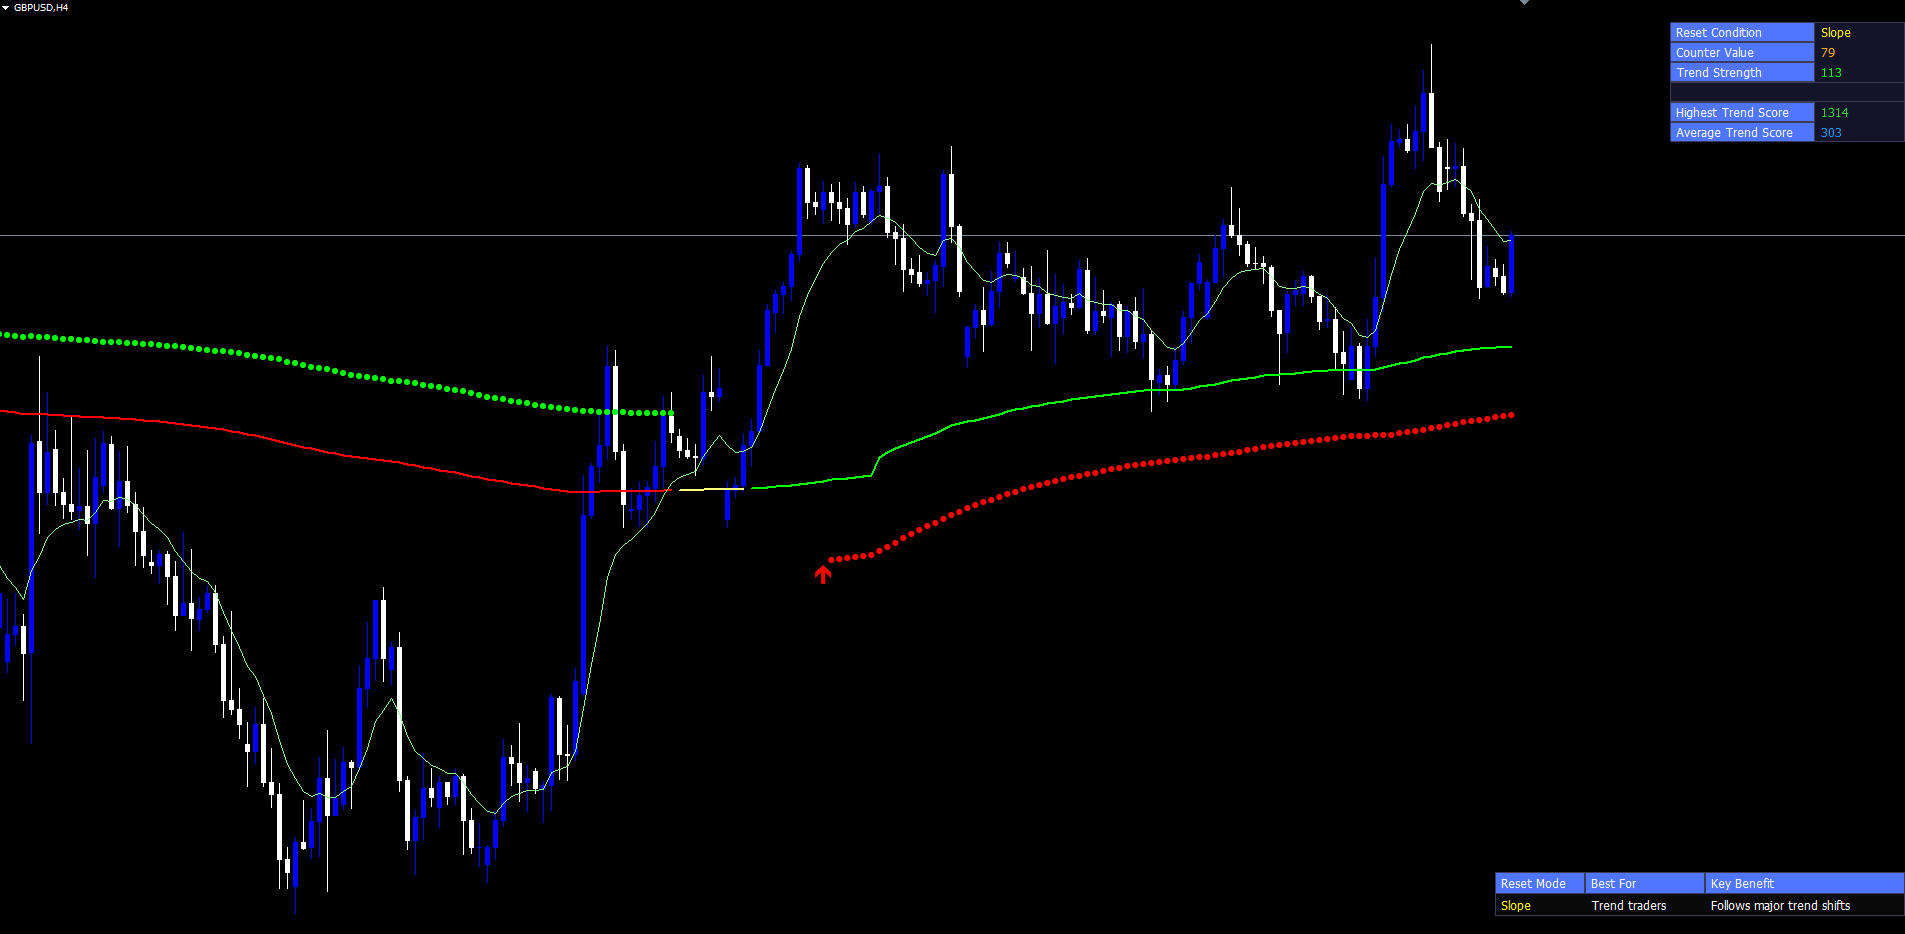
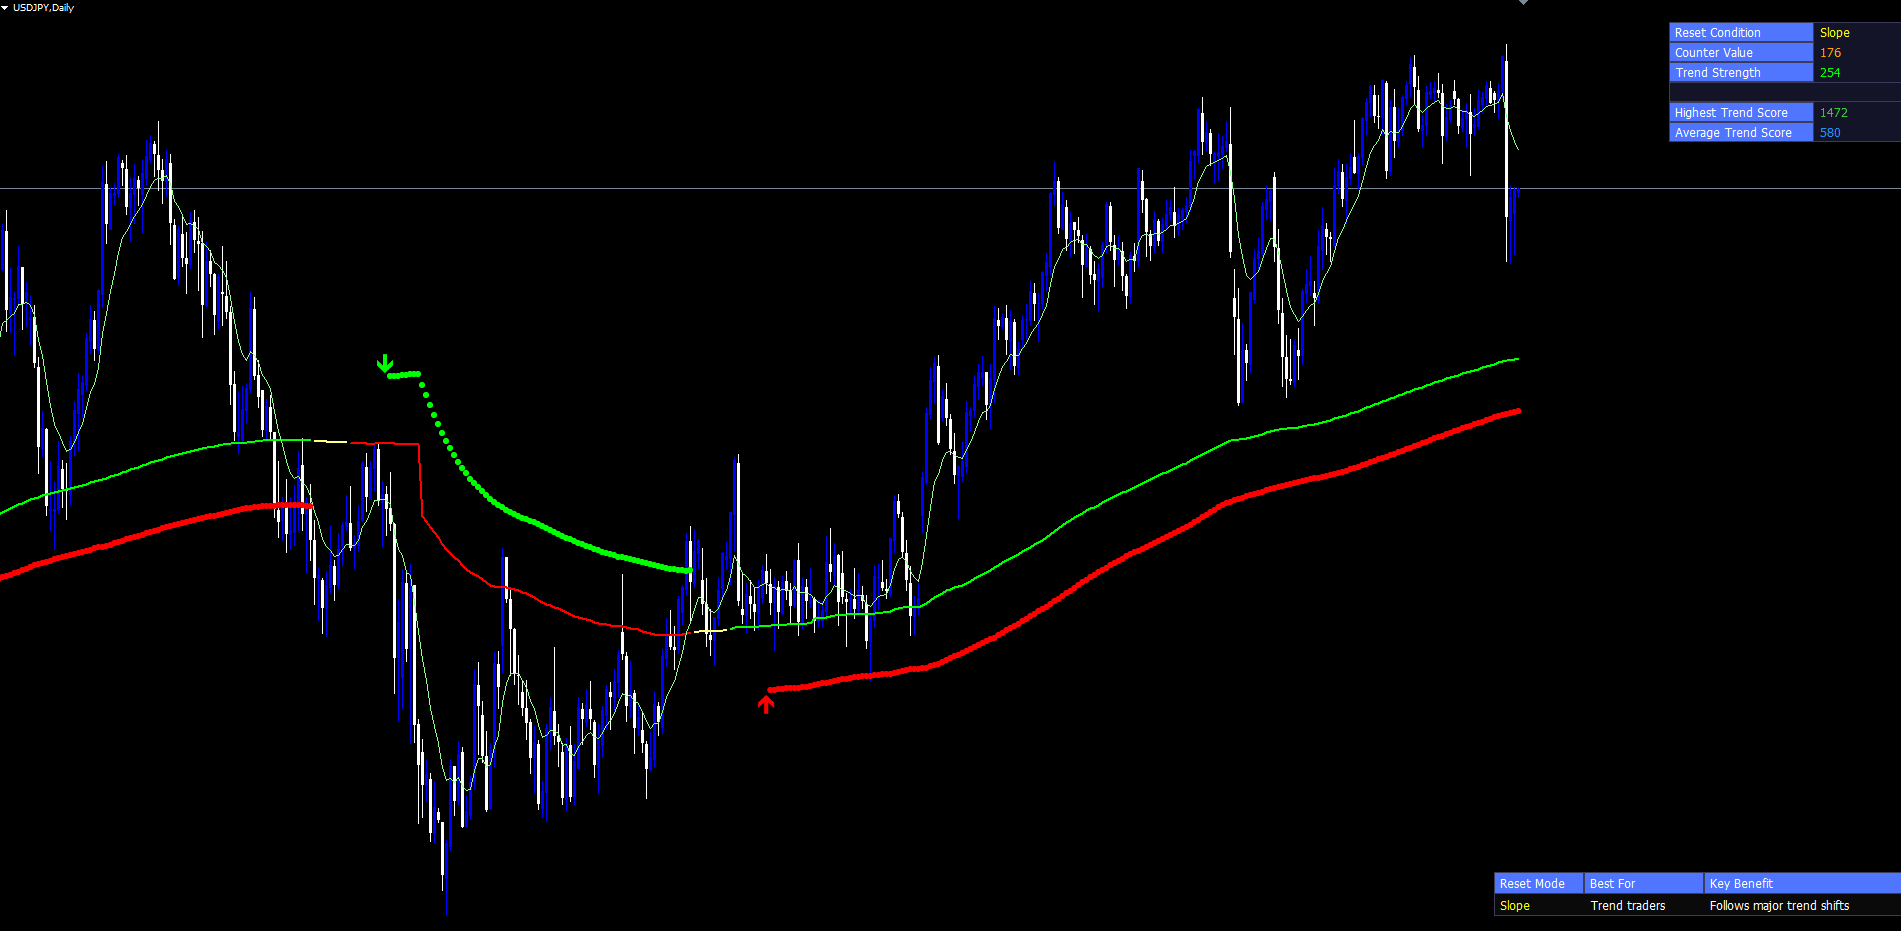
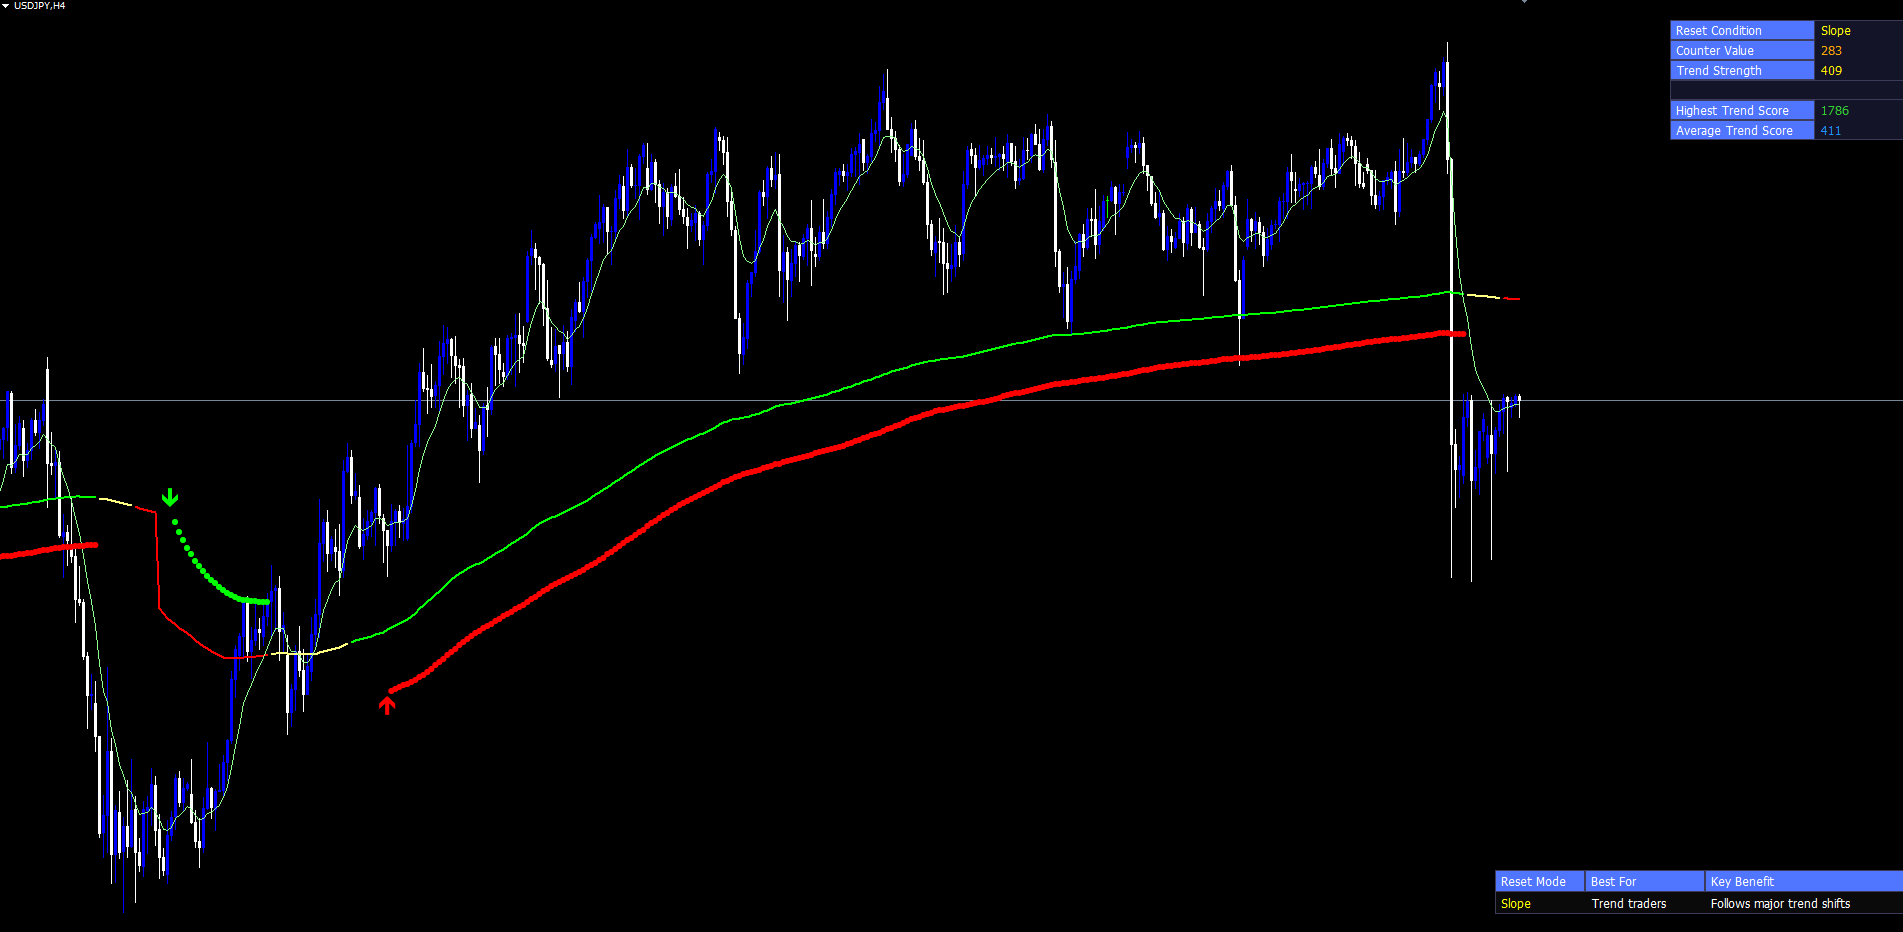
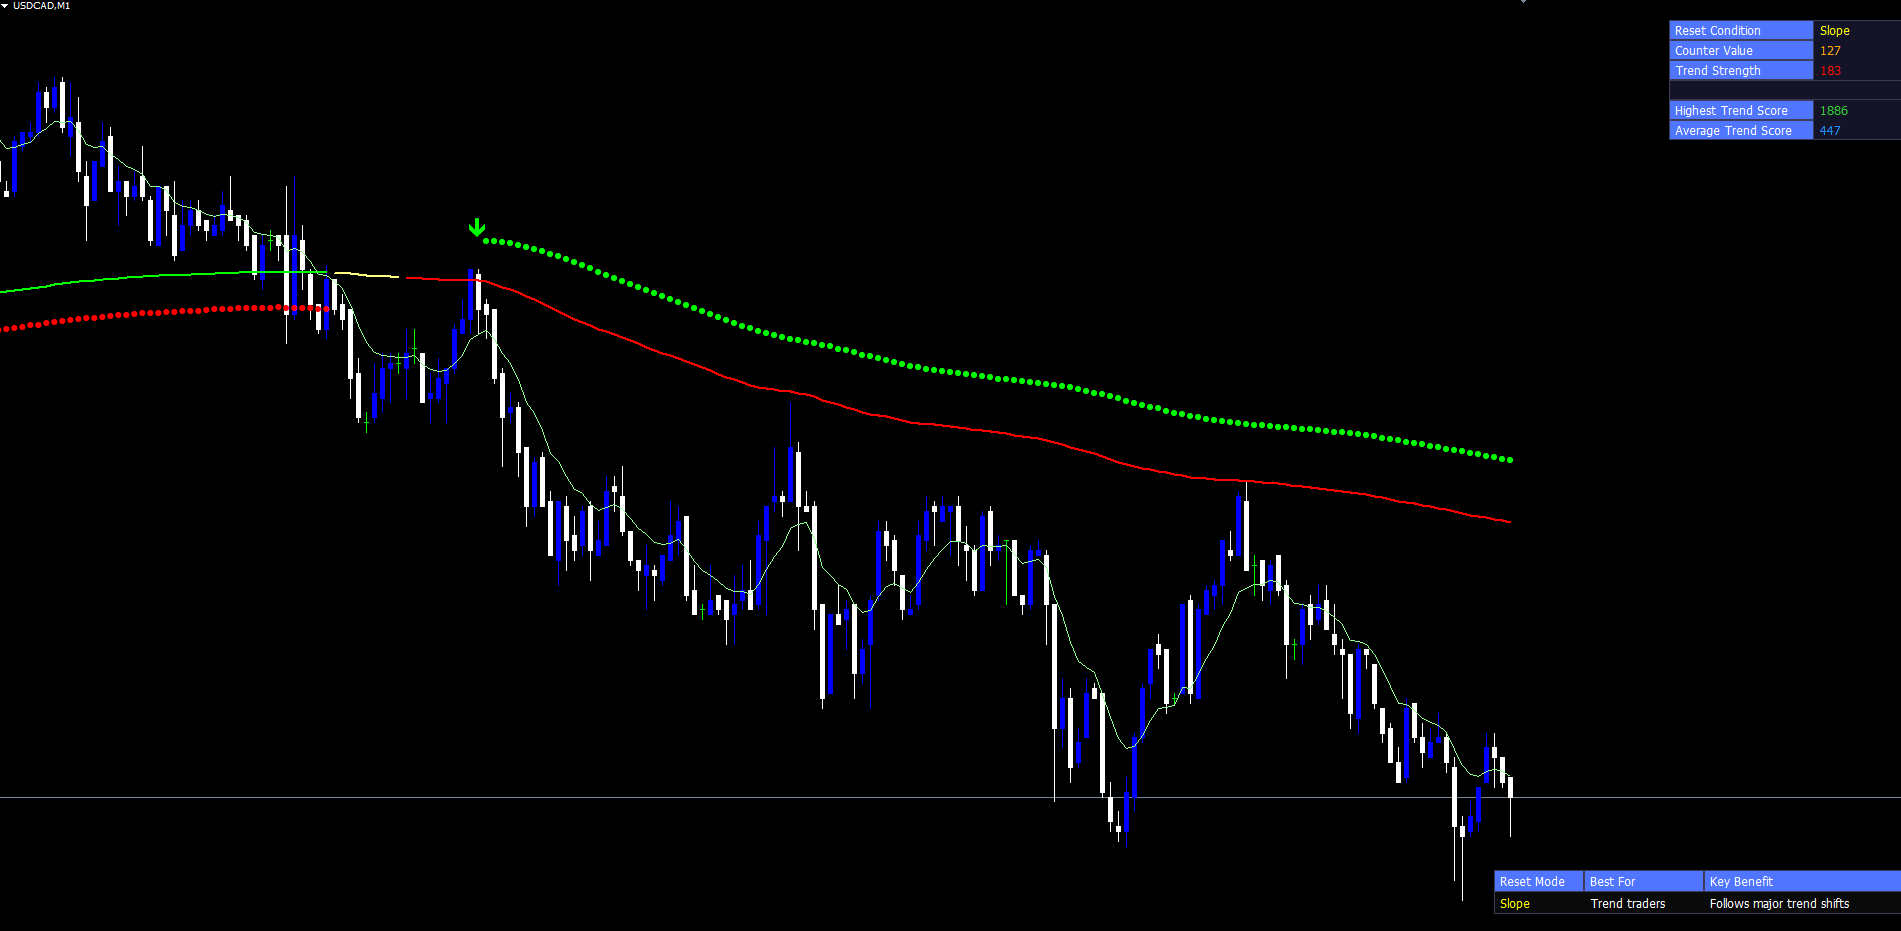
Layered on top of the dynamic moving average is a two-pole adaptive filter, ATR-banded confirmation circles, transition triangles, a three-color MA line, a trend cloud fill against EMA(close, 10), and two on-chart info tables. A complete alert package covers trend flips, confirmed-trend starts, counter-break events, and reset-state changes through popup, push, email, and sound channels. Every value is computed from closed bars only, so the indicator never repaints.
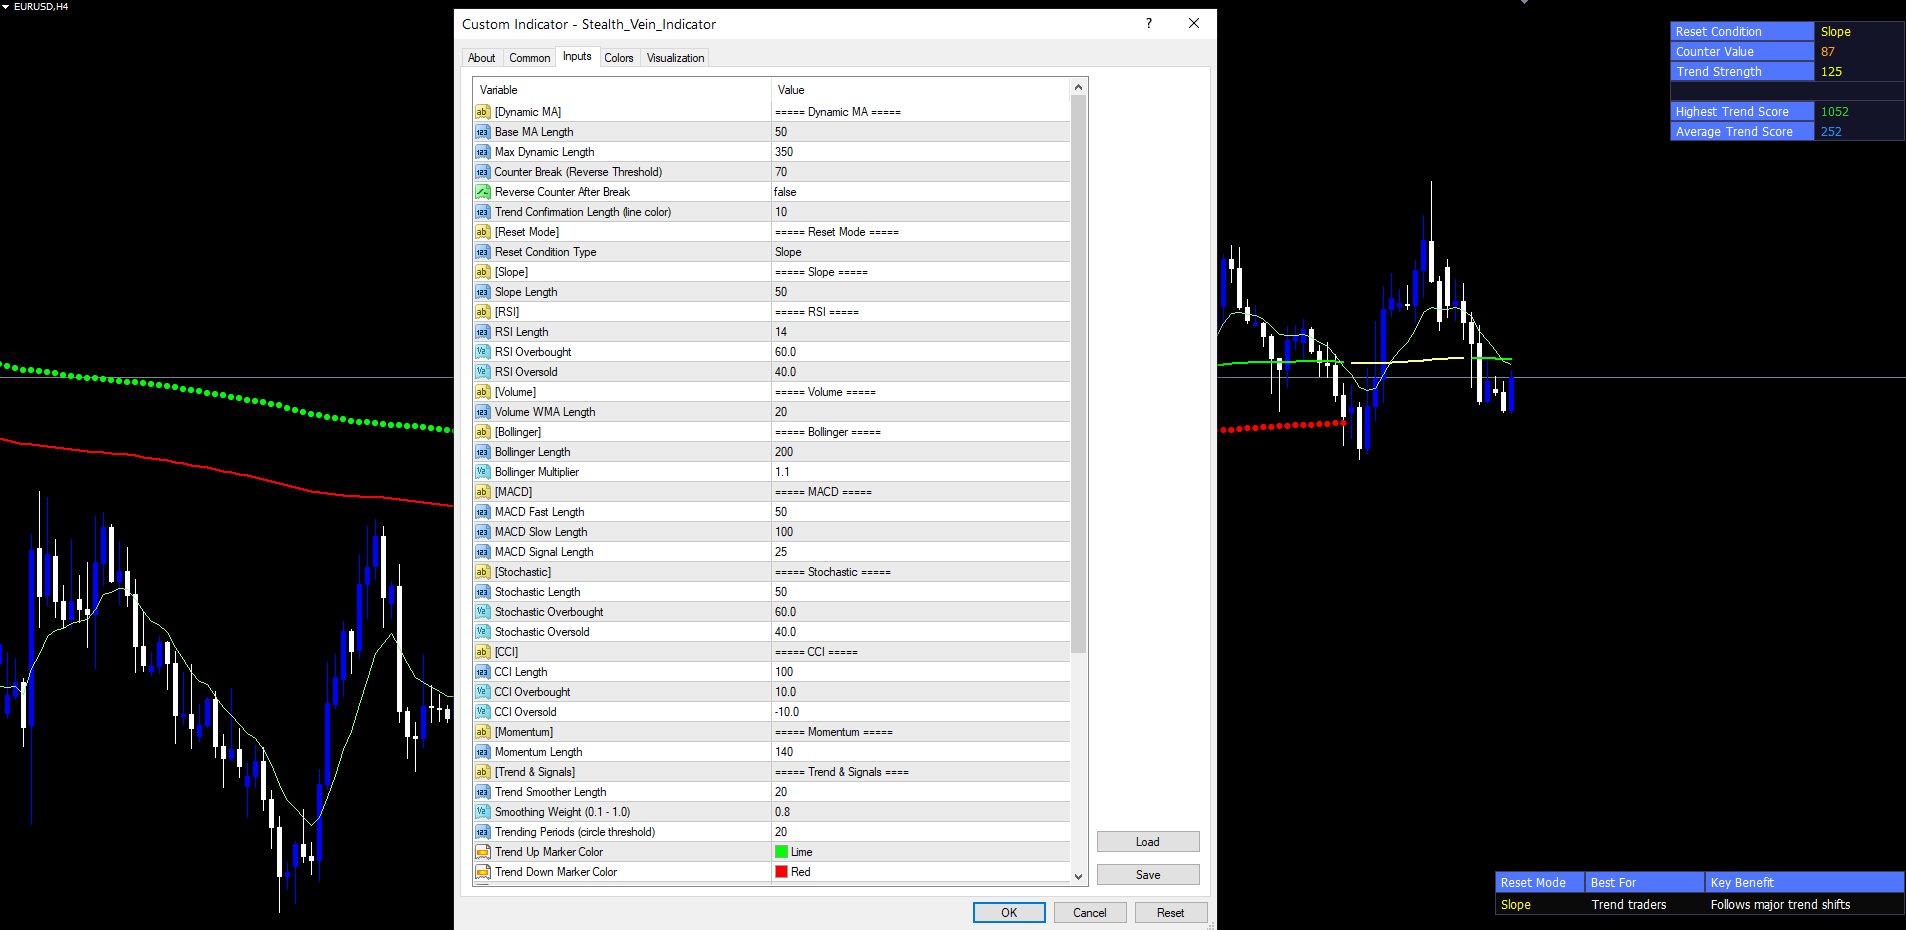
This article explains the technical concepts behind the dynamic-length moving average, walks through each of the nine reset modes, documents the adaptive trend filter, and provides a complete parameter reference.
The Adaptive Dynamic-Length Moving Average
A standard simple moving average computes the arithmetic mean of the last N closing prices. Because N is fixed, the responsiveness of the average never changes. A trader who picks N = 20 to react quickly to short-term moves accepts that the same average will whipsaw inside a wide trend. A trader who picks N = 200 to filter out noise accepts that the average will lag badly behind major reversals.
The Stealth Vein Indicator counts how long the market has remained in a single state. When a chosen state signal stays positive (or negative) for many consecutive bars, the moving-average length grows by one each bar, producing a steadily smoother line. When the state signal flips, the length resets back to the base value. This produces a moving average that is short and responsive at the start of a new trend, and progressively longer and smoother as the trend matures.
The advantage of this counting approach is that it respects market structure rather than just price magnitude. Two markets with identical price ranges may have very different patterns of underlying signals — one may show clean RSI continuation, the other may oscillate around the RSI midpoint. A length that adapts only to magnitude treats them the same. A length that adapts to a structural counter can give one market a long smooth line and the other a short responsive line, even when their raw price action looks similar.
The counter is bounded above by the configured Max Dynamic Length (default: 350). Once the counter reaches the cap, the moving-average length stops growing. An optional reverse-counter mode lets the length contract back toward the base after reaching a threshold, producing a periodic pulse-like behaviour useful for traders who want the moving average to stay responsive during extended trends.
The Nine Reset Modes
The reset mode is the single most important configuration choice for the indicator. It determines which underlying market signal drives the counter, and therefore controls how the dynamic length adapts. Each of the nine modes targets a different aspect of market behaviour.
Slope (default). The state at the current bar is positive when the dynamic MA is above where it was Slope Length bars ago, and negative when below. With the default Slope Length of 50, the counter increments as long as the moving average maintains a consistent slope direction. This is the natural choice for trend-followers, because it lengthens the MA when the trend is most established.
RSI. The state is positive when RSI exceeds the overbought level (default: 60) and negative below the oversold level (default: 40). This mode suits reversal traders who view extreme momentum as evidence of a stable directional bias.
Volume. The state compares the 20-bar simple average of tick volume against a configurable weighted moving average of volume. Positive states correspond to consistently above-average volume; negative states to below-average. This appeals to breakout traders, who treat sustained volume as confirmation of institutional participation.
Bollinger. The state is positive when close exceeds the upper Bollinger Band (default length 200, multiplier 1.1) and negative when close falls below the lower band. This is a volatility-extreme mode: the counter lengthens during sustained price excursions outside the bands.
MACD. The state is positive when the MACD line is above its signal line and negative when below. With default lengths of 50 and 100 and a 25-period signal line, this mode tracks medium-term momentum acceleration versus exhaustion.
Stochastic. The state is positive when raw %K exceeds the overbought level (default 60) and negative below the oversold level (default 40). This is faster than RSI mode at default settings and reacts to short-term swing extremes.
CCI. The state is positive when the Commodity Channel Index (default 100-period, computed on close) exceeds the overbought threshold (10) and negative below the oversold threshold (-10). The narrow thresholds make this mode sensitive to even modest mean-reversion deviations.
Momentum. The state is positive when the rate of change over the configured length (default 140) is positive, and negative otherwise. This is a pure trend-direction mode that does not require extremes — any consistent positive ROC lengthens the MA.
None. The state is permanently zero, which means the counter resets every bar. This effectively turns the dynamic MA into a fixed-length SMA at Base MA Length . Useful as a baseline reference for comparison.
The nine modes are not interchangeable. Slope mode produces smooth trend-following behaviour; RSI mode produces sharp pulses around momentum extremes; Volume mode anchors the dynamics to actual market participation. Traders should experiment with each mode on their preferred instruments and timeframes, using the bottom-right Reset Mode guidance table for a quick reminder of each mode's audience.
The Counter Mechanism
The counter is a per-bar integer that drives the dynamic moving-average length. It starts at 1 and grows by one each bar that the reset-mode state remains in the same direction. When the state flips (positive to negative or vice versa, with zero treated as a reset), the counter snaps back to 1.
The dynamic length at any bar is computed as Base MA Length + (counter - 1) , capped by Max Dynamic Length . With the defaults of 50 and 350, the moving-average length can range from 50 to 350 depending on how long the current state has persisted. A counter value of 1 produces the base length of 50; a counter value of 100 produces a length of 149; a counter value of 300 produces a length of 349.
The optional Reverse Counter After Break setting modifies this behaviour. When enabled, the counter ping-pongs between 1 and Counter Break (default: 70). When the counter reaches Counter Break while incrementing, direction flips and the counter starts decrementing back toward 1. When it reaches 1, direction flips again. The visible effect is a moving average whose length oscillates rhythmically inside any persistent state, producing pulsing responsiveness rather than monotonic smoothing. Useful for traders who find that monotonic smoothing makes the moving average too slow to adjust during mid-trend pullbacks.
The Trend Strength cell in the top-right table shows the counter as a percentage of Counter Break - 1 , scaled to 0–100. This single normalized number describes how mature the current state is, regardless of which reset mode is active. The same table tracks the highest score reached and the average score across all processed bars.
The Two-Pole Adaptive Trend Filter
The dynamic moving average alone is not sufficient for a clean trend reference. To produce the "filteredTrend" series used by the confirmation circles and trend-color logic, the indicator applies a two-pole adaptive filter to the dynamic MA.
The filter operates as a two-stage cascade. The first stage (primary) is a single-pole low-pass that incorporates the difference between the current dynamic MA and the previous primary-filter value. The second stage (secondary) feeds the primary output through another low-pass with a response factor controlling how strongly past values influence the present.
Mathematically: primary = previousPrimary + smoothFactor * (dynamicMA - previousPrimary) , where smoothFactor = SmoothingWeight * 2 * pi / FilterLength . Then secondary = previousSecondary * responseFactor + (1 - responseFactor) * primary , where responseFactor = exp(-smoothFactor) . The final filteredTrend output is the average of the two stages.
This cascade produces a remarkably smooth line that lags the dynamic MA only slightly while filtering out almost all bar-to-bar jitter. Two inputs control behaviour: Trend Smoother Length (default: 20) sets the dominant cycle period, and Smoothing Weight (default: 0.8) sets the damping. Larger smoothing-weight values produce stronger damping; smaller values let more high-frequency content through.
The filteredTrend series has two roles. First, its slope (compared two bars back, not just one, to ignore single-bar jitter) drives the trend-up and trend-down stride counters. Second, its absolute value is the centre line for the ATR-banded confirmation circles. The two-pole structure is critical because a single-pole filter alone tends to overshoot during sharp turns; the secondary stage damps these overshoots substantially.
ATR-Banded Confirmation Circles
When the trend-up or trend-down stride exceeds the configured Trending Periods threshold (default: 20), the indicator plots a circle at the filteredTrend value plus or minus the 200-period Average True Range. Using ATR for the offset makes the band width adapt to current volatility regardless of the instrument or timeframe.
The mapping between strides and circles is intentionally inverted, faithful to the Pine Script source. When the trend-down stride exceeds the threshold (many consecutive bars of falling filteredTrend), the indicator interprets this as confirmation of a strong directional move and plots an upward circle at filteredTrend + ATR(200). Strong directional persistence is confirmation that the market is in a definite regime; the up-circle marks where price would need to travel to break that regime. The opposite mapping applies to up-strides.
The circles serve several practical purposes. They provide a visual reference for the trend's volatility-adjusted boundaries. A trader watching price approach an upper circle during a sustained down-trend can recognize that price has expanded to a volatility extreme and may snap back. They mark zones where a counter-trend reversal would have to break the band. And they only appear during confirmed trend conditions, so their presence on the chart is itself a signal that the dynamic MA is being driven by sustained directional flow rather than chop.
The threshold is configurable. Lowering Trending Periods to 10 produces circles much earlier in each trend run. Raising it to 30 produces circles only during exceptionally persistent runs.
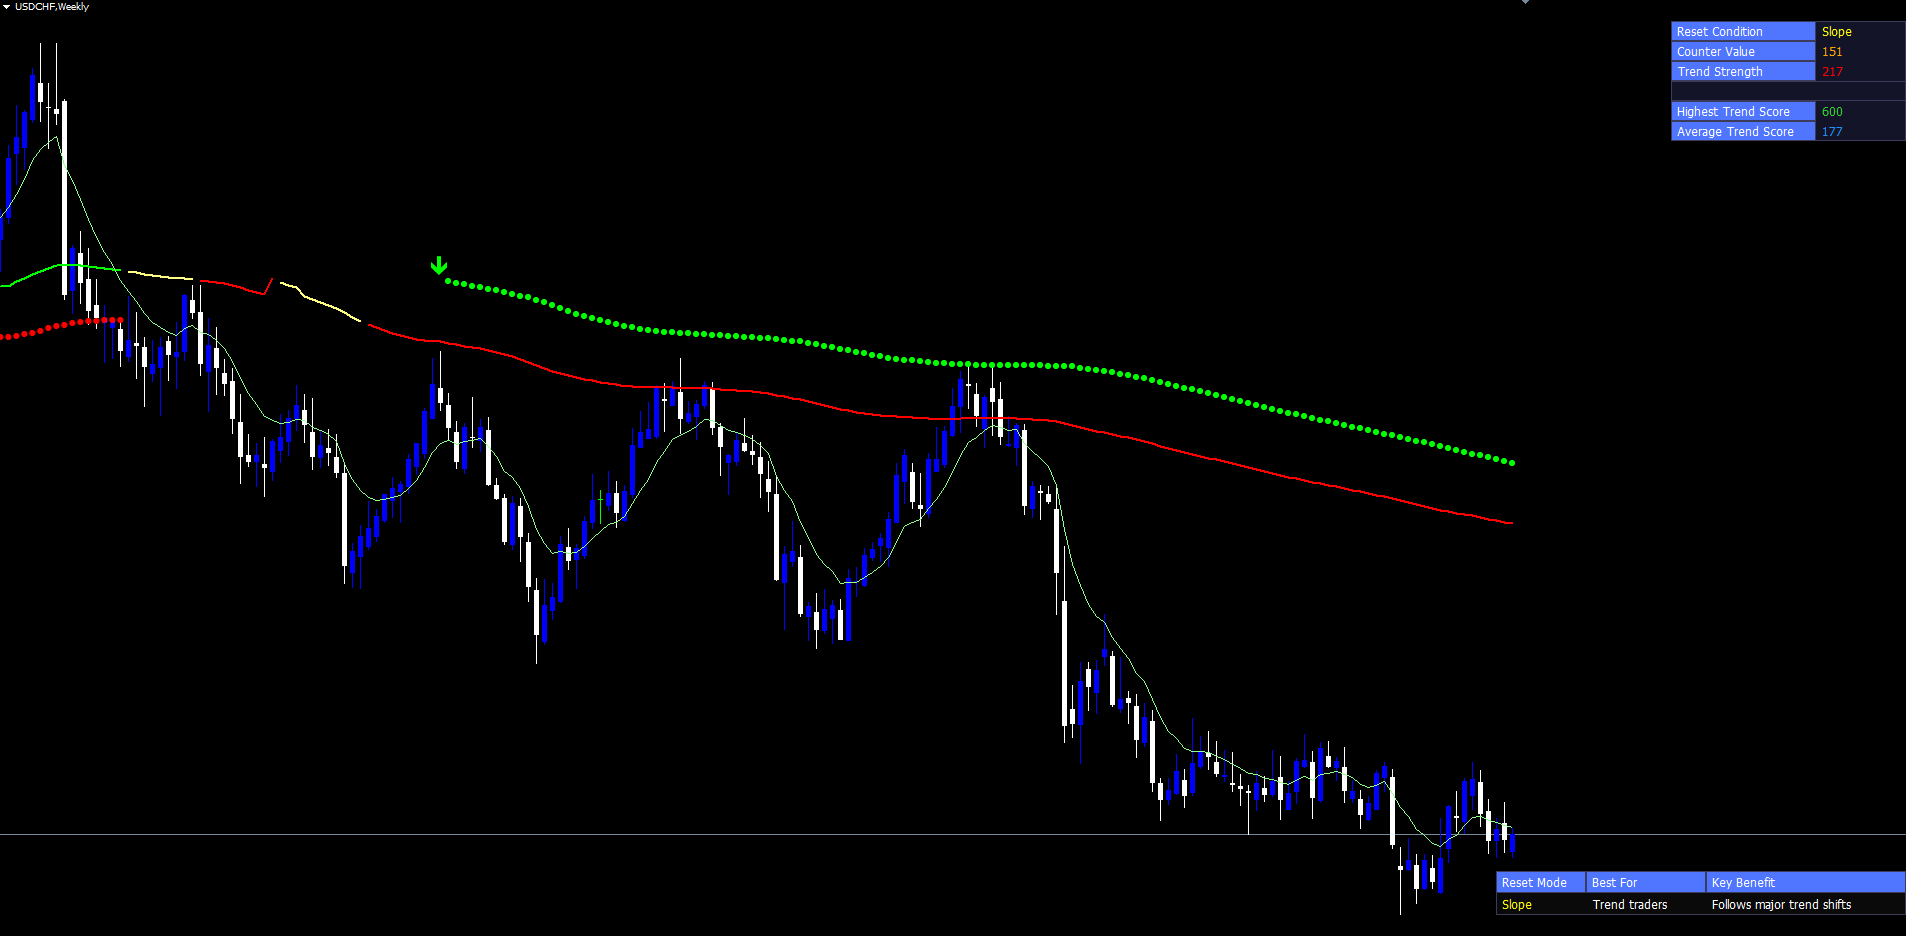
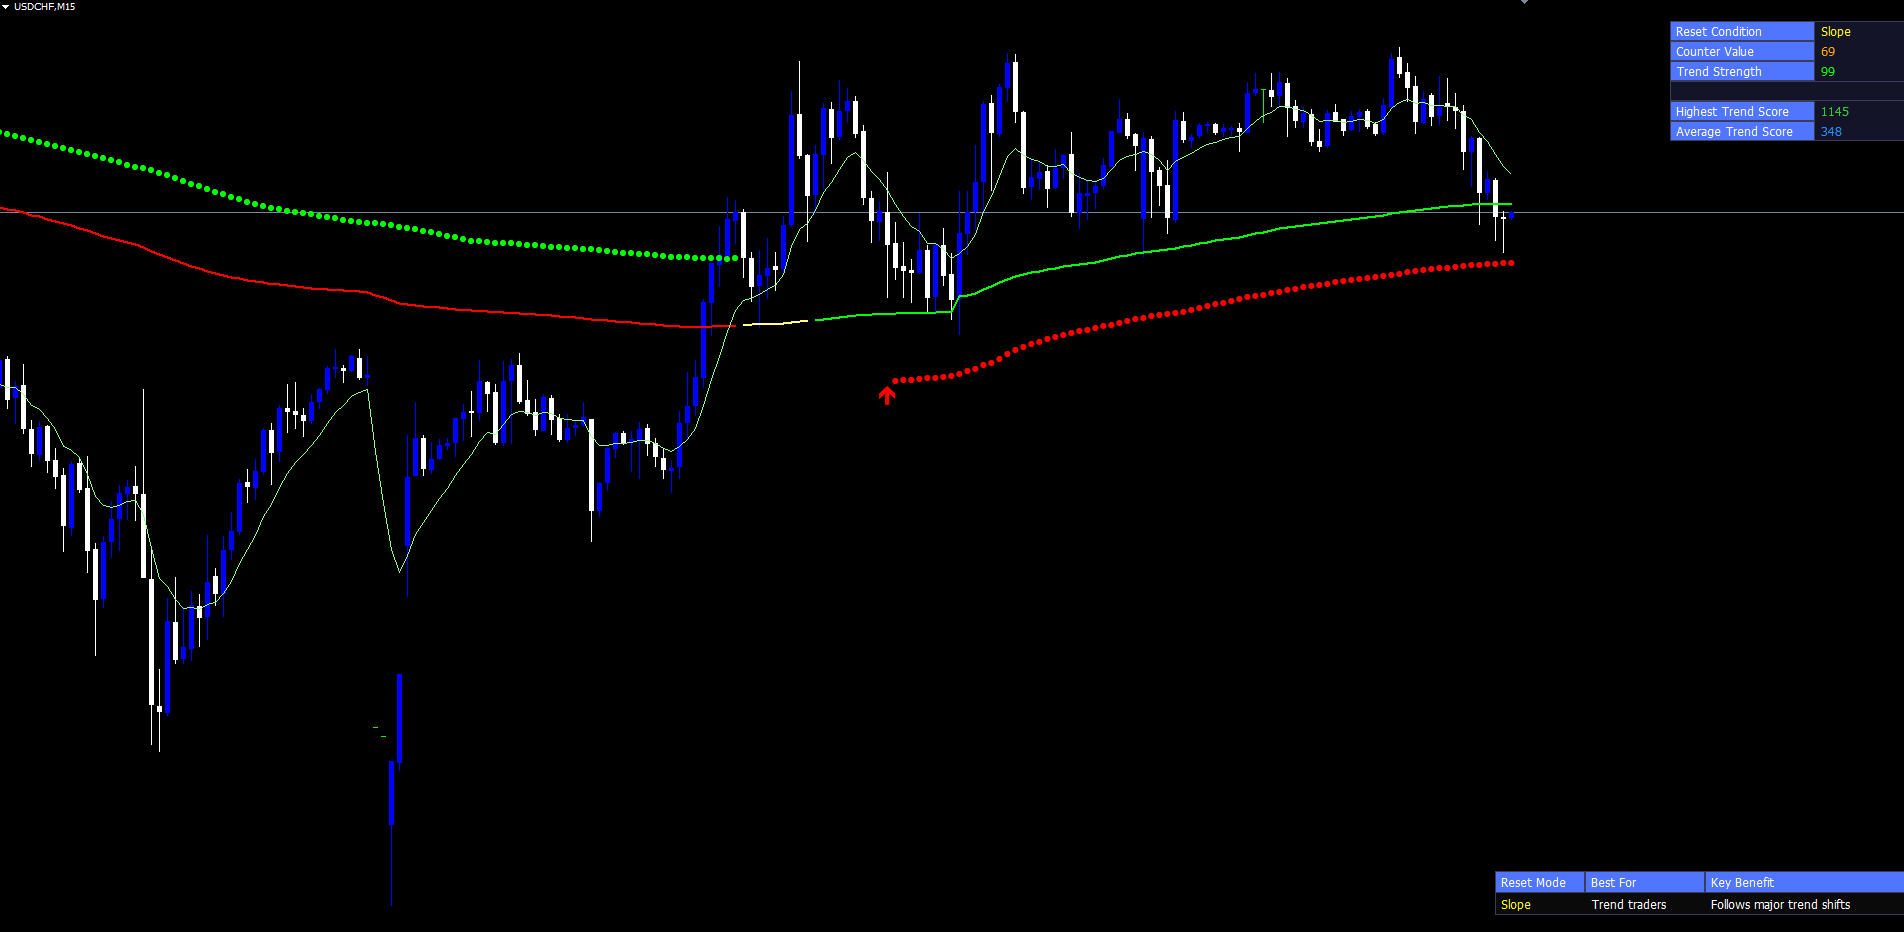
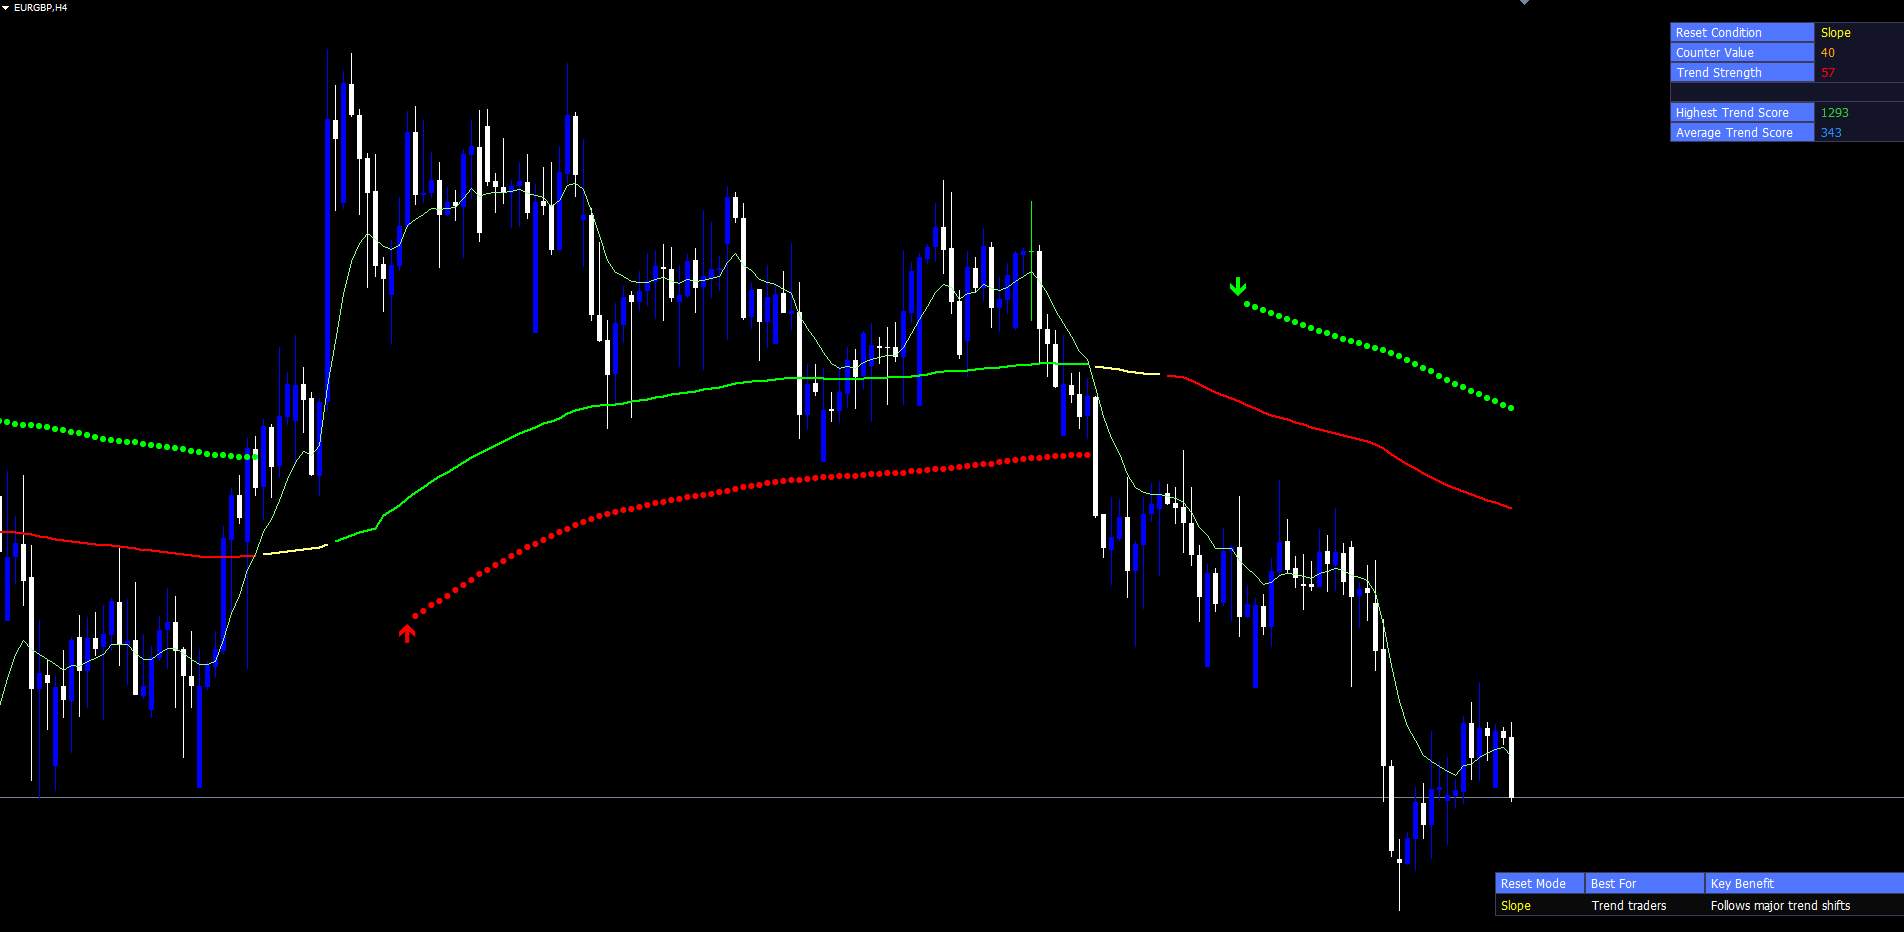
Transition Triangles
While confirmation circles plot continuously throughout each confirmed trend run, transition triangles fire only once at the start of each new run. A PosTrendStart event occurs on the first bar where the up-circle confirmation becomes true after being false; a NegTrendStart event occurs at the first down-circle confirmation flip.
The triangles are drawn at the previous bar's circle position, placing them just to the left of the new circle's first appearance. This creates a visual "starting marker" effect: the triangle highlights where the new trend run began, while continuing circles trace its progression.
Because the triangles are drawn only at the precise moment of state transition, they are sparse. A typical chart over several months may show only a dozen or so triangles, each marking a structurally significant trend start. Their rarity makes them useful for backtest review — a trader can scan the chart and immediately see when major regime changes occurred. In the MetaTrader port, the triangles are implemented as OBJ_ARROW chart objects with Wingdings codes 233 (upward) and 234 (downward), anchored to the bar's time and the appropriate filteredTrend ± ATR price level.
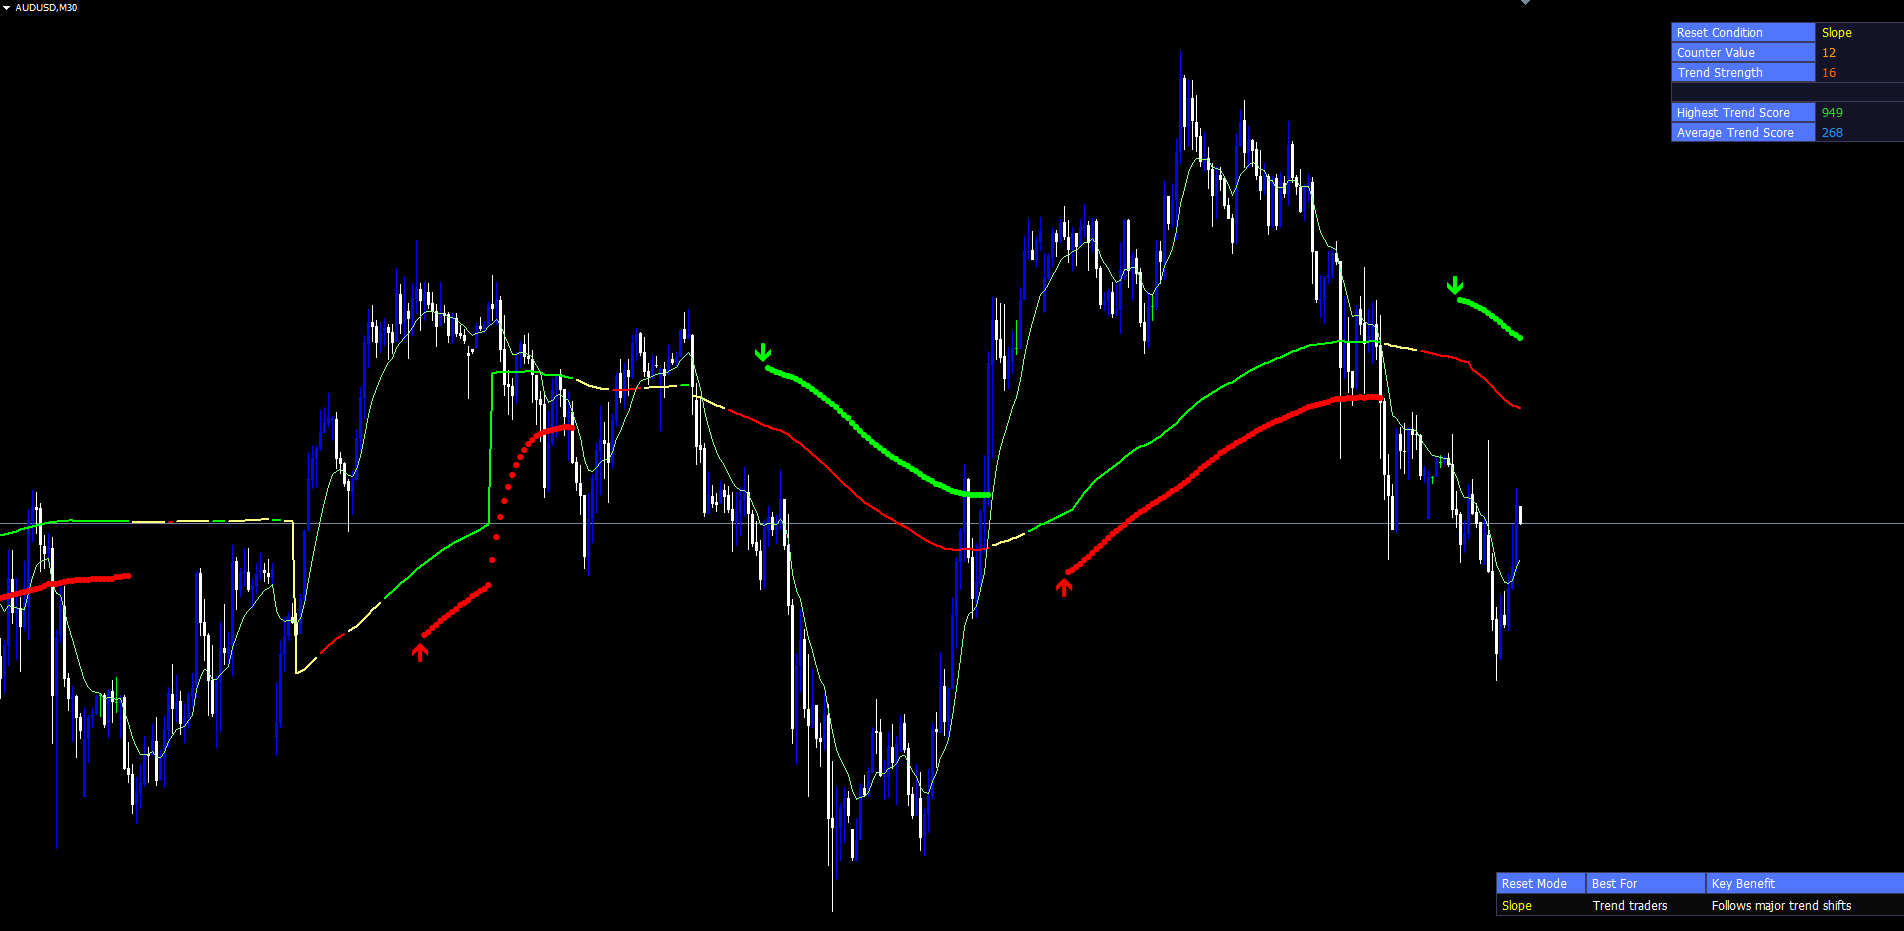
The Three-Color MA Line
The dynamic moving average is rendered through three separate DRAW_LINE indicator buffers: up-color (default lime), down-color (default red), and neutral (default soft yellow). On any given bar, exactly one of the three buffers carries the MA value, and the other two are set to the empty value.
The buffer choice is driven by a separate threshold from the confirmation circles. While the circles use Trending Periods (default: 20), the line color uses Trend Confirmation Length (default: 10). This lower threshold means the MA can change color more readily than circles appear. When the up-stride or down-stride first reaches 10, the line colour shifts to up or down. When neither stride exceeds 10, the line stays in the neutral colour.
The result is a moving average whose visible state communicates two pieces of information simultaneously: the price level (line position) and the trend confirmation status (line colour). A trader scanning the chart can distinguish at a glance between a confirmed up-trend (lime), a confirmed down-trend (red), and a transitional state (yellow). A trader sees the MA shift colour several bars before the first confirmation circle appears, providing an early warning that a regime change may be in progress.
The Trend Cloud Fill
Between the dynamic MA and a 10-period EMA of the close, the indicator draws a DRAW_FILLING cloud. This cloud is two-coloured by design — light green when the MA sits below the EMA (short-term price tracking above the longer-term reference, indicating an up-bias) and light red when the MA sits above the EMA. The two cloud colours are locked at compile time through #property indicator_color directives, ensuring that MT4 and MT5 render the cloud identically out of the box.
The cloud serves as a fast-twitch visual companion to the slower dynamic MA. The 10-period EMA reacts much faster to price changes than the dynamic MA at any meaningful counter value. When close is rising, EMA(10) climbs quickly above the dynamic MA, and the cloud immediately turns green. When close falls, EMA(10) drops below the dynamic MA and the cloud turns red.
This layered design is intentional: the cloud is a fast trend tell, the line color is medium-term confirmation, and the circles are slow high-confidence confirmation. By examining all three together, the trader gets a multi-resolution picture. A single fast tell (cloud only) is useful for early entries with tight stops. Cloud plus line color confirms that the medium-term picture aligns. Cloud plus line color plus circles indicates that even the slow confirmation system has caught up — typically the strongest, most committed phase of a trend.
The cloud width also conveys information. A wide cloud indicates that price is accelerating away from the dynamic MA, signalling momentum. A narrow cloud indicates that price is converging back toward the MA, often a precursor to a flip in cloud colour.
The Two Info Tables
The Stealth Vein Indicator displays two on-chart info tables, both drawn as OBJ_RECTANGLE_LABEL and OBJ_LABEL chart objects. They are pinned to corner positions through absolute pixel coordinates computed from ChartGetInteger(0, CHART_WIDTH_IN_PIXELS, 0) and CHART_HEIGHT_IN_PIXELS , ensuring that the tables stay in their corners even when the chart is resized.
The top-right table is the Trend Strength table. It has six rows organized as label-value pairs, with row 3 intentionally left empty to match the Pine Script source's spacing:
- Reset Condition — the active reset mode name (Slope, RSI, Volume, etc.)
- Counter Value — the current counter as an integer, displayed in orange
- Trend Strength — the normalized trend score (0–100) with a gradient color
- Highest Trend Score — the maximum score observed since the indicator started, in lime
- Average Trend Score — the running average across all processed bars, in dodger blue
The Trend Strength row's colour is computed through a linear RGB interpolation between the neutral gradient anchor and the up-trend or down-trend colour, scaled by how high the corresponding stride is. A small stride produces a colour close to the neutral anchor; a stride at the upper bound produces a colour close to the marker colour, mirroring Pine's color.from_gradient function.
The bottom-right table is the Reset Mode Guidance table. It has three columns: the active mode name, the trader audience the mode is best suited for (e.g., "Trend traders" for Slope, "Reversal traders" for RSI), and a one-line key benefit description. This table is purely informational, designed to remind traders why each mode exists without consulting the manual.
Both tables can be toggled off through InpShowTrendStrengthTable and InpShowGuidanceTable for traders who prefer a cleaner chart.
Practical Trading Workflow
Step 1: Add the indicator to a chart. Find Stealth Vein Indicator in the Navigator panel under Indicators > Market. Drag it onto the chart. Default settings work well on most instruments. Start with a 1-hour or 4-hour chart.
Step 2: Choose a reset mode for your trading style. Trend follower? Leave default Slope mode. Reversal trader? Switch to RSI or Stochastic. Breakout trader? Switch to Volume. The bottom-right guidance table updates automatically when you change modes.
Step 3: Wait for the colour transitions. Watch the cloud change colour first (the fast tell), then the dynamic MA line, then the confirmation circles. The strongest signals occur when all three layers align. If the cloud has been green for several bars and the line just turned lime, you are in an early phase of a confirmed up-trend — useful for aggressive entries. If circles plot consistently above price, the trend is mature.
Step 4: Read the Trend Strength table. A counter value near 1 means the reset just fired and the moving average is at base length. A high counter value means the state has persisted for many bars and the MA is fully smoothed. The Trend Strength score normalises this from 0 to 100, making it easy to compare different sessions or instruments.
Step 5: Set alerts for trend transitions. Enable popup or push alerts for the Trend Flip event and the Confirmed Up/Down Start events. Trend Flip fires the moment close crosses the dynamic MA (earliest trigger). Confirmed Up/Down Start fires when strides exceed the threshold (high-confidence trigger). Some traders enable both: the early flip for situational awareness, the confirmed start for actual entries.
Step 6: Review the chart at the end of the session. Both tables persist, showing the current mode and cumulative session statistics. The triangles mark every regime change, providing a clear visual log of structural events.
Timeframe Considerations
The indicator adapts to any timeframe. On lower timeframes (M5, M15) the counter increments quickly and the dynamic MA reaches its maximum length within hours. On medium timeframes (M30, H1, H4) the counter typically reaches mid-range values during normal trends, producing a balanced mix of responsiveness and smoothing. On higher timeframes (D1, W1) the counter grows slowly across many sessions, producing a heavily smoothed long-period MA that captures only the largest structural trends.
For most discretionary traders, H1 or H4 give the cleanest signal density. For systematic traders, applying the indicator on H1, H4, and D1 simultaneously and looking for alignment across timeframes provides high-confidence entry filtering.
Multi-Chart Setup
Because the indicator operates independently on each chart, traders can attach it to multiple instruments and timeframes simultaneously. Each instance maintains its own counter state, filter values, and tables. Combined with push notifications, a trader can monitor a watchlist of 10+ instruments without manually switching charts. Push alerts include the symbol and trend direction, so the trader can identify which chart the notification refers to.
Parameter Reference
Dynamic MA
| Parameter | Default | Description |
|---|---|---|
| InpBaseLen | 50 | Starting length of the dynamic moving average |
| InpMaxDynLen | 350 | Maximum length the dynamic MA can expand to |
| InpCounterBreak | 70 | Counter value at which reverse-counter mode flips |
| InpReverseCounter | false | When true, counter ping-pongs between 1 and CounterBreak |
| InpTrendingCol | 10 | Bars of one-direction filter slope required to colour the MA |
Reset Mode
| Parameter | Default | Description |
|---|---|---|
| InpResetMode | Slope | Slope, RSI, Volume, Bollinger, MACD, Stochastic, CCI, Momentum, None |
| InpSlopeLookback | 50 | Bars back for slope-mode comparison |
| InpRsiLength | 14 | RSI period |
| InpRsiOB / InpRsiOS | 60 / 40 | RSI thresholds |
| InpVolSmaLength | 20 | Volume WMA length |
| InpBbLength / InpBbMult | 200 / 1.1 | Bollinger Bands settings |
| InpMacdFast / Slow / Signal | 50 / 100 / 25 | MACD settings |
| InpStochLength | 50 | Stochastic %K period |
| InpStochOB / InpStochOS | 60 / 40 | Stochastic thresholds |
| InpCciLength | 100 | CCI period |
| InpCciOB / InpCciOS | 10 / -10 | CCI thresholds |
| InpMomentumLength | 140 | Rate of change period |
Trend & Signals
| Parameter | Default | Description |
|---|---|---|
| InpFilterLength | 20 | Two-pole filter dominant cycle period |
| InpTrendSmoothing | 0.8 | Two-pole filter damping coefficient |
| InpTrendingPeriods | 20 | Stride threshold for confirmation circles |
| InpTrendUpColor | clrLime | Up-trend marker colour |
| InpTrendDnColor | clrRed | Down-trend marker colour |
| InpGradColor | clrYellow | Neutral colour and gradient anchor |
Tables and Alerts
| Parameter | Default | Description |
|---|---|---|
| InpShowGuidanceTable | true | Show bottom-right Reset Mode guidance table |
| InpShowTrendStrengthTable | true | Show top-right Trend Strength table |
| InpAlertTrendFlip | true | Alert on close-cross-MA event |
| InpAlertConfirmedUp | true | Alert on confirmed up-trend start |
| InpAlertConfirmedDn | true | Alert on confirmed down-trend start |
| InpAlertCounterBreak | false | Alert when counter reaches CounterBreak |
| InpAlertResetState | false | Alert when reset state value changes |
| InpAlertPopup / Push / Email / Sound | true / false / false / false | Alert delivery channels |
| InpAlertSoundFile | alert.wav | Sound file for AlertSound channel |
Recommended Configuration Profiles
Conservative trend follower: Reset Mode = Slope, Slope Lookback = 50, Trending Periods = 30, Trending Confirmation Length = 15. Colours the line and plots circles only during very strong, persistent trends.
Balanced default: Use all defaults. Slope mode with standard lookback, default thresholds, full alert package enabled. Suitable for most Forex pairs on H1 and H4.
Aggressive reversal trader: Reset Mode = RSI, RSI Length = 14, RSI OB/OS = 70/30, Trending Periods = 10. Fires confirmation circles after just 10 consecutive aligned bars.
Breakout trader: Reset Mode = Volume, Volume WMA Length = 50, Trending Periods = 15. Volume-driven length adaptation favours breakouts where high volume confirms a sustained move.
Installation
Stealth Vein Indicator is distributed through the MQL5.com Market and installs automatically after purchase.
- Purchase the indicator from the MQL5.com Market product page.
- The indicator downloads and installs automatically into MetaTrader.
- Open the Navigator panel (Ctrl+N) and expand Indicators > Market.
- Find Stealth Vein Indicator and drag it onto any chart.
- Adjust input parameters if needed, then click OK.
Works on all timeframes and instruments. Allow the indicator a few moments to load its historical calculations on first attach. Warmup typically takes 200–250 bars depending on the active reset mode. Subsequent ticks process incrementally with no noticeable delay. Ensure the chart has at least 500 bars of historical data; if shorter, increase Max Bars in Chart in MetaTrader Options. The indicator uses 7 visible buffers and creates SVI_* -prefixed chart objects automatically cleaned up when the indicator is removed.
Download the indicator:
- MetaTrader 5: Stealth Vein MT5
- MetaTrader 4: Stealth Vein MT4
Conclusion
The Stealth Vein Indicator replaces the static moving average with an adaptive dynamic-length system whose behaviour can be tuned through nine reset modes. By counting the duration of a chosen state signal — slope, RSI, volume, Bollinger, MACD, Stochastic, CCI, momentum, or none — the indicator produces a single line that lengthens during persistent regimes and shortens at every regime change.
Layered on top are the two-pole adaptive filter, ATR-banded circles, transition triangles, three-color line, trend cloud, and two info tables. Each layer adds a different resolution of trend information. The cloud is fast, the line color is medium-term, the circles are slow high-confidence confirmation.
A complete alert system covers trend flips, confirmed-trend starts, counter-break events, and reset-state changes via popup, push, email, and sound channels. Every value is computed from closed bars only — historical signals are exactly what live traders saw in real time.
The indicator suits traders who want a structured, repeatable approach to trend identification across Forex, Indices, Commodities, and Crypto. It performs well on M30, H1, and H4 timeframes, adapting to any timeframe through volatility-adjusted ATR bands.
CONTACT & SUPPORT
- Email: info@forexobroker.com
- Questions: Use the Comments section on the product page or send a private message
- Bug Reports: Please include your broker name, account type, and a screenshot
-
✅ All MQL Tools: https://www.mql5.com/en/users/forexobroker/ ✅
--------------------------------------------------------------------------------------------------------------
🏦 **Broker I use**: https://icmarkets.com/?camp=55869
🏦 **Broker For EU Traders I use 1**: https://www.ictrading.com?camp=91414
🏦 **Broker I use 2**: https://one.exnessonelink.com/boarding/sign-up/a/c_thuv62ocfq
💻 **VPS**: https://chocoping.com/processing/aff.php?aff=738
💼 **Companies I use for getting funded**:
Fundednext: https://fundednext.com/?fpr=kestutis39
The5ers: https://www.the5ers.com/?afmc=16kl
FTMO: https://trader.ftmo.com/?affiliates=nRAyOhmFRnEnFdOpdLeh
Risk Disclaimer
Trading foreign exchange and CFDs on margin carries a high level of risk and may not be suitable for all investors. You may sustain a loss exceeding your initial investment. Trend Quorum is a technical analysis tool and does not guarantee profitable trades. Past performance is not indicative of future results. The authors accept no liability for any loss arising from use of the indicator. By using Trend Quorum you acknowledge sole responsibility for your trading decisions.


")
![[XAUUSD]: Weekly Liquidity Activation Points (timings), June 22-26, 2026](https://c.mql5.com/6/1013/splash-preview-771790.png "[XAUUSD]: Weekly Liquidity Activation Points (timings), June 22-26, 2026")
")